
Abstract
Background
Abdominal diffusion-weighted imaging (DWI) has been rapidly increasing during the last few years. For the evaluation of new DWI techniques, the development of suitable phantoms and quality assurance methods is important.
Purpose
To construct a body-diameter phantom for abdominal DWI and study the impact of different acquisition options on image quality.
Material and Methods
A phantom with a diameter of 31 cm and a volume of 26 L was constructed, containing four samples representing a clinically relevant range of apparent diffusion coefficient (ADC) values. Measurements were carried out on 1.5T and 3.0T MRI systems using conventional echo-planar imaging (EPI), readout-segmented EPI, and zoomed EPI (3.0T) sequences. The effects of parallel imaging, coil intensity normalization, and patient-specific B1 shim (3.0T) were also examined. ADC values and signal-to-noise ratios of the samples were measured, and the level of artifacts was visually evaluated.
Results
The agreement of ADC values between different acquisition options was generally good, but higher values (by 0.07 × 10⁻³ mm2/s on the average) with readout-segmented EPI as well as ADC variations of approximately 0.1 × 10⁻³ mm2/s in slice direction were observed. The image artifacts were reduced by using patient-specific B1 shim, readout-segmented EPI, or zoomed EPI.
Conclusion
The body-sized phantom demonstrated well the expected image artifacts in DWI with large field of view. The use of patient-specific B1 shim, readout-segmented EPI, or zoomed EPI improved image quality of DWI in this study.
Keywords
Introduction
In magnetic resonance imaging (MRI), the importance of diffusion-weighted imaging (DWI) has been substantially growing during the last few years. Having long been an essential tool for neuroradiologists, the center of mass of clinical DWI has now moved closer to the center of mass of the human body – the abdomen. An important consensus paper by Padhani et al. (1) described the possibilities and partially unsolved problems of DWI in oncology. The standardization of imaging protocols and the comparability of apparent diffusion coefficient (ADC) values between different centers were in the focus of discussion.
One of the challenges stated by the consensus paper was the development of suitable phantoms and quality assurance methods for DWI. Delakis et al. have developed and applied a quality assurance protocol for diffusion MRI studies (2). Chenevert et al. have published a study of an ice-water phantom (3), followed by a repeatability and reproducibility study (4). Lavdas et al. have introduced a DWI phantom using different concentrations of agarose, sucrose, and nickel, and used it for comparison of 1.5T and 3.0T MRI systems (5,6). Other studies have investigated suitable materials for DWI phantoms (7–9). Miquel et al. have studied the repeatability of abdominal DWI, with phantom and in vivo (10). None of the mentioned phantoms have represented the dimensions of the abdominal area of a normal-sized or large patient.
Abdominal imaging at 3.0T has been problematic because of the signal inhomogeneity due to standing waves in the body area, leading to inhomogeneous distribution of the B1 field and hence incomplete excitation of the protons (11,12). Parallel transmission has been developed to overcome these problems (13). Parallel transmission allows also the shimming of the B1 field and the excitation of a selective volume. This approach can be used in zoomed diffusion-weighted echo-planar imaging (EPI) that utilizes smaller number of k-space lines leading to fewer artifacts in the final image (14,15). In addition, Porter et al. (16) have published a method for readout-segmented EPI, which divides the k-space into several segments in readout direction. This method substantially reduces the artifacts caused by phase errors in conventional EPI sequences.
The objectives of this study were: (i) to construct a body-sized phantom suitable for the image quality evaluation of abdominal DWI; and (ii) to investigate the uniformity of the ADC values, signal-to-noise ratios (SNR), and the level of artifacts with different field strengths and acquisition options, including parallel imaging, coil intensity normalization function, patient-specific B1 shim, readout-segmented EPI, and zoomed EPI.
Material and Methods
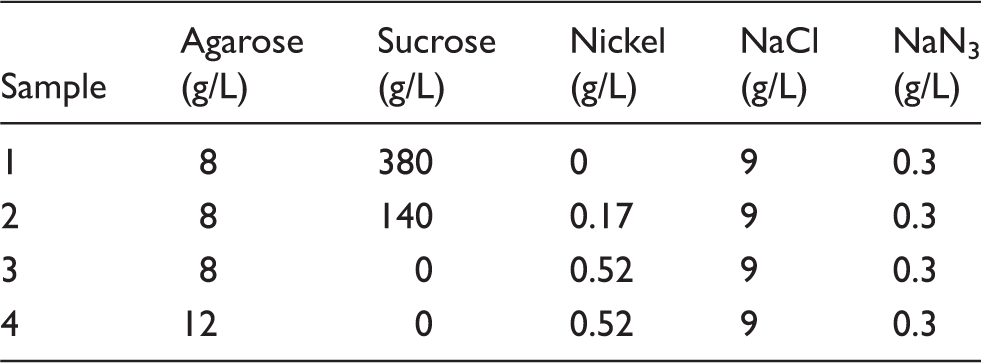
Phantom construction
The compositions of the samples inside the phantom.
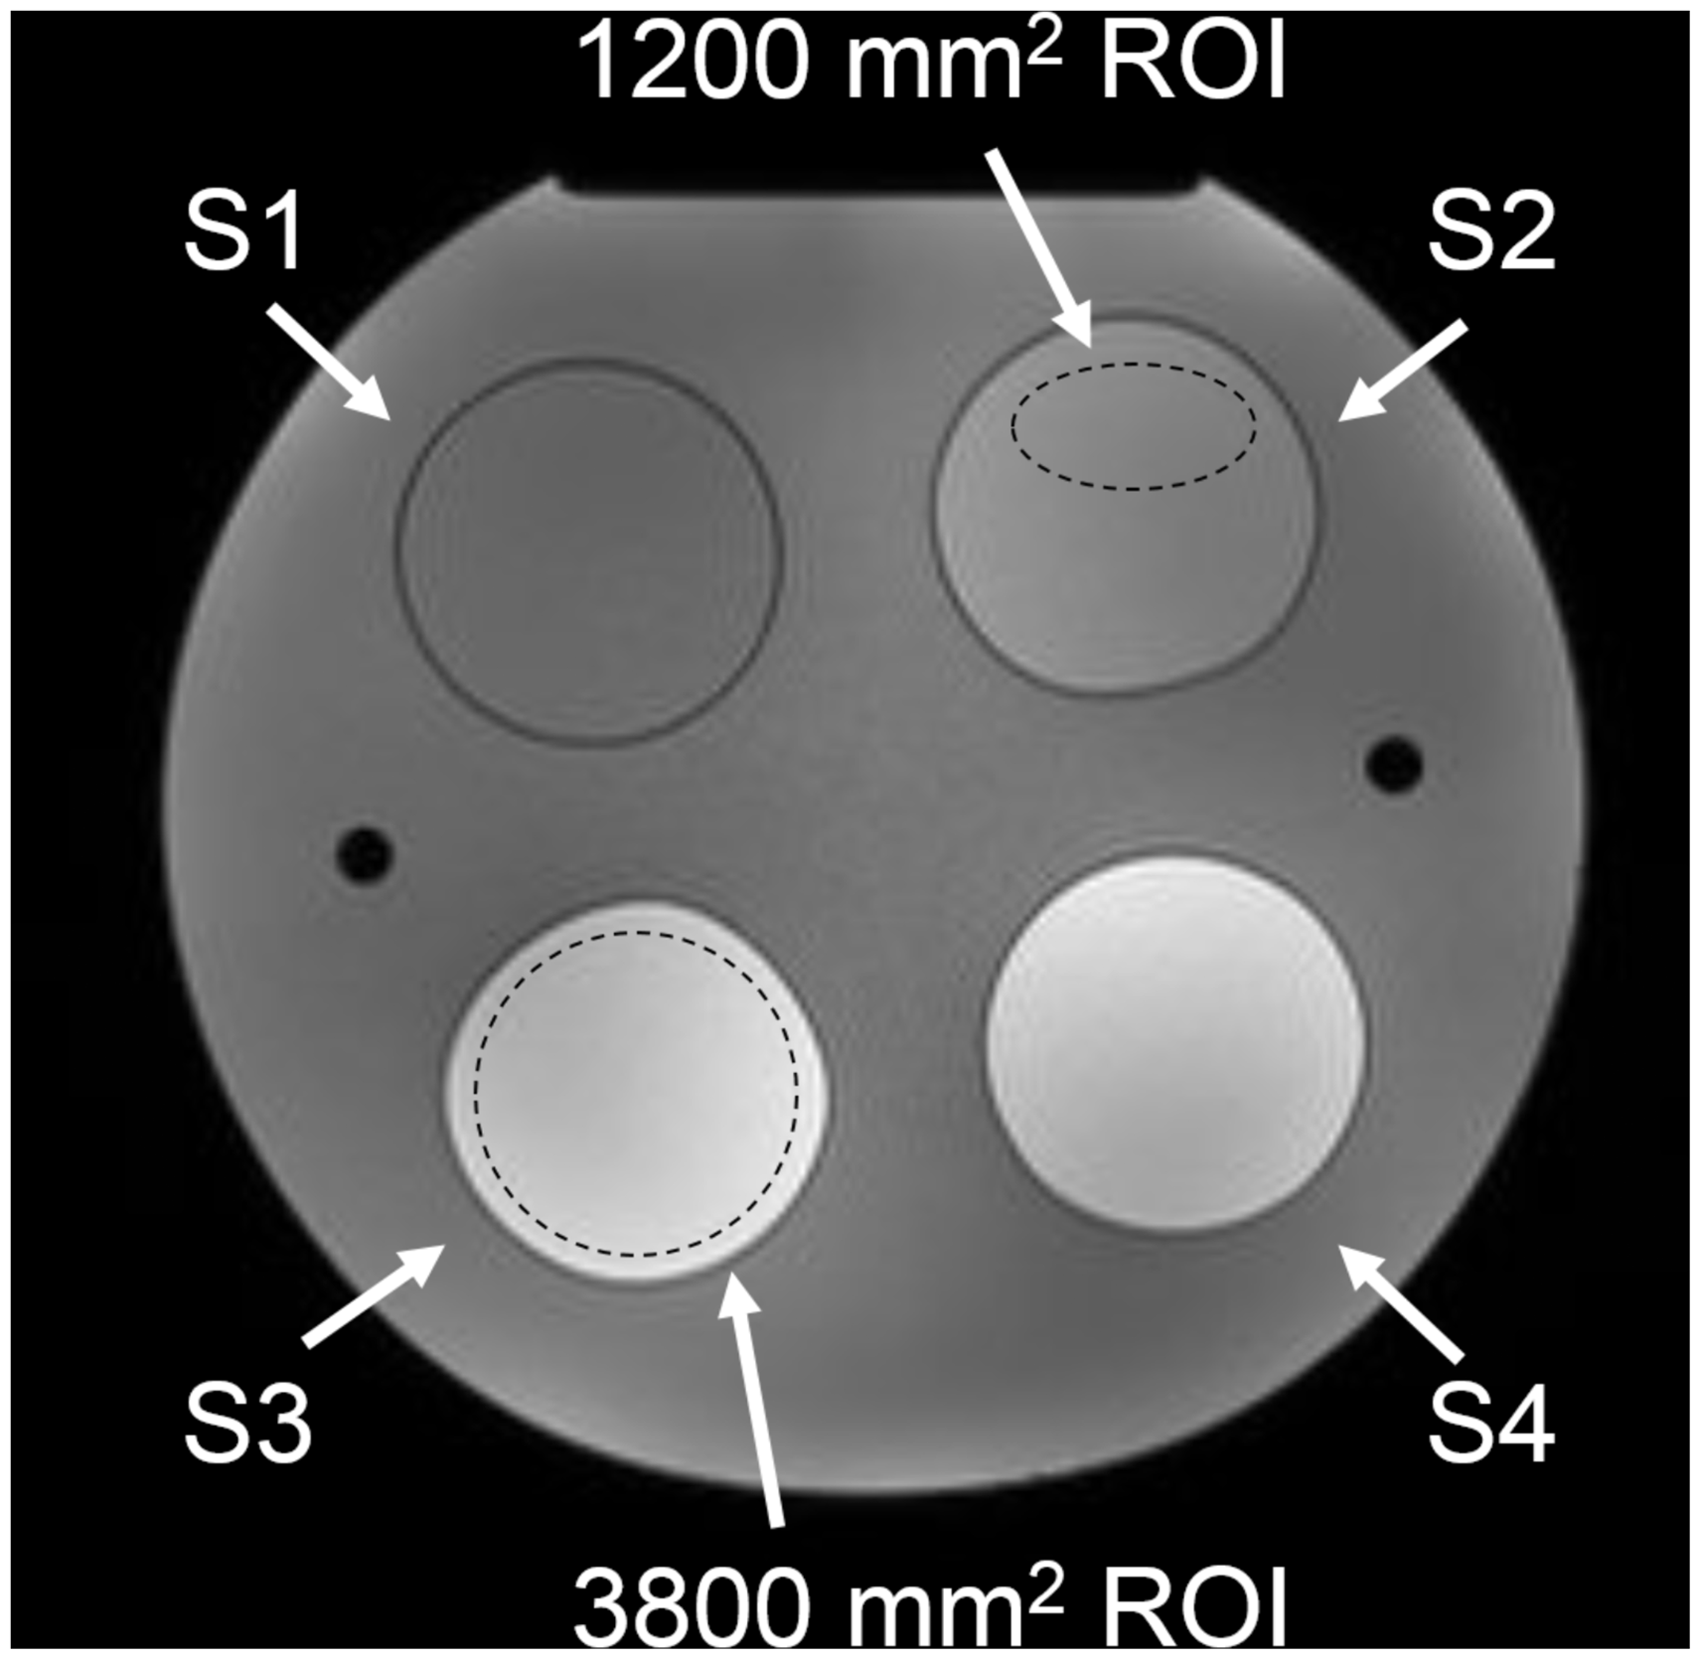
The numbering of the samples 1–4 (S1–S4) and examples of the regions of interest (ROI) used in the image analysis, superimposed on an axial T1W image (2D FLASH sequence: TR, 169 ms; TE, 4.76 ms; flip angle, 70°) of the phantom acquired with a 1.5T system.
Image acquisition
The images were acquired with Siemens Magnetom Aera 1.5 T and Siemens Magnetom Skyra 3.0T (Siemens Healthcare, Erlangen, Germany). Both systems were completely installed in a clinical site but not yet taken into clinical use. The phantom was brought to the imaging room one day before the measurements to let its temperature stabilize at the room temperature. Before and after the measurements, the temperature of the room was measured with a Protimeter Hygromaster (GE Measurement & Control, Billerica, MA, USA). The temperature changed from 22.1℃ to 22.6℃ in the 1.5T room and from 19.3℃ to 19.1℃ in the 3.0T room during the measurements. On both MRI systems, the phantom was positioned on a 32-channel spine coil and an 18-channel body coil was secured on top of it (Fig. 2).
Positioning of the phantom.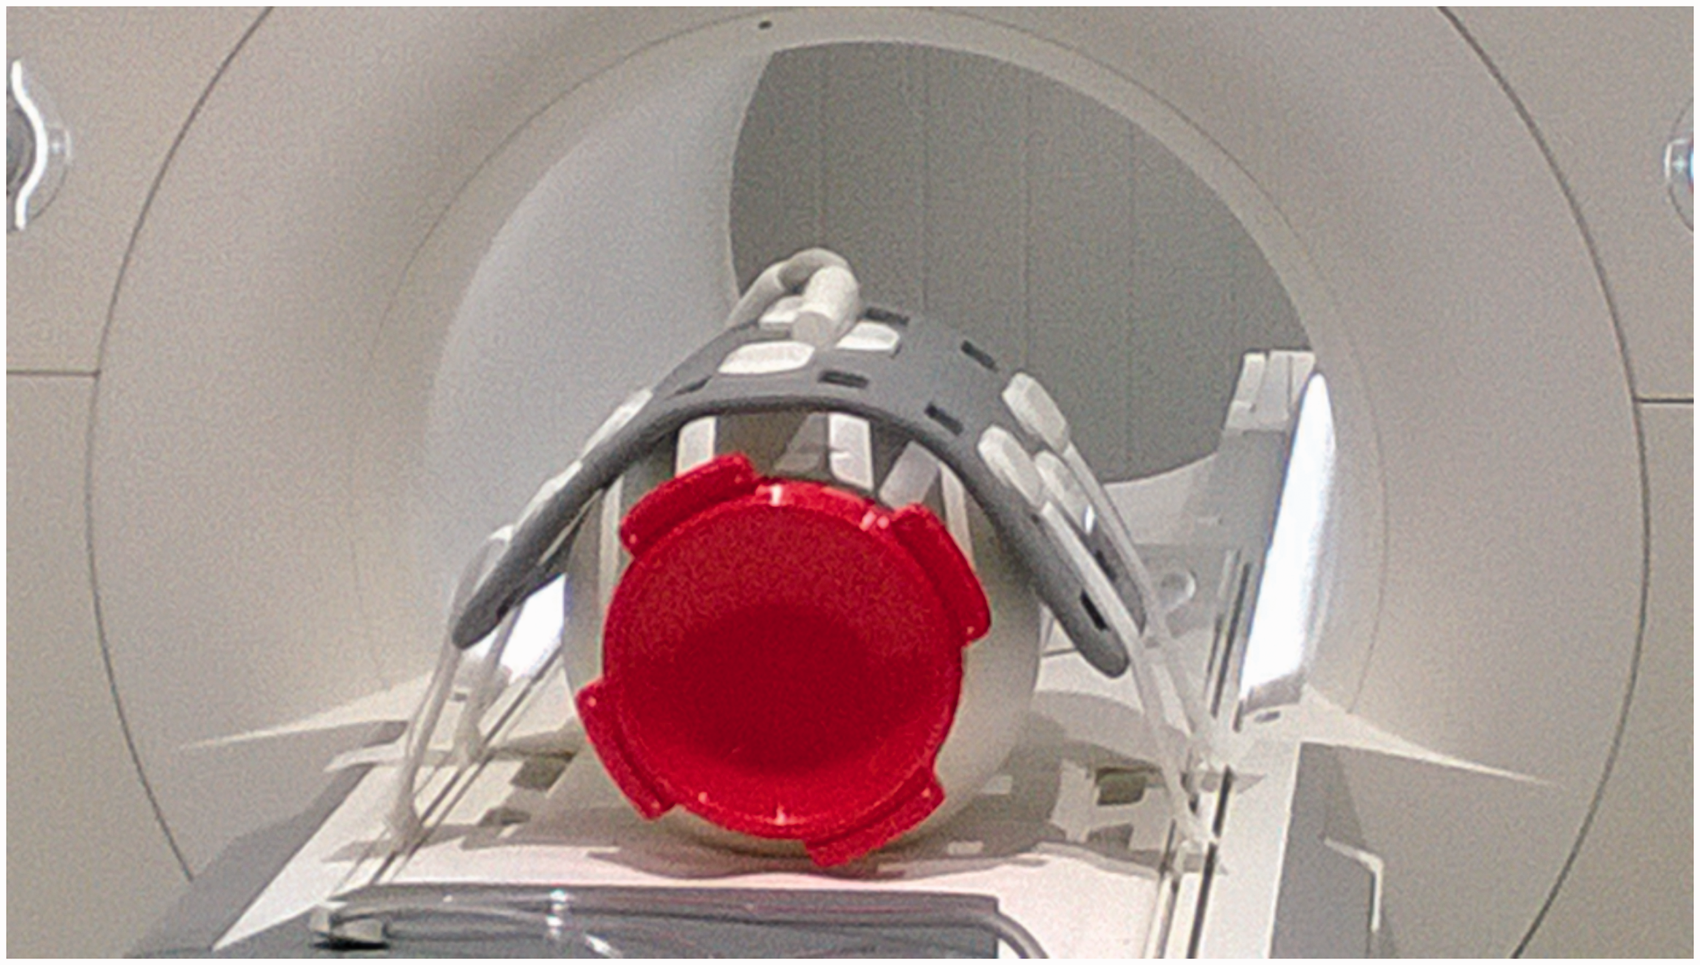
The following series were acquired:
a conventional abdominal DWI EPI series; series no. 1 without parallel imaging, increasing the TR value to 6800 ms (1.5T) or 7000 ms (3.0T) and TE values to 111 ms; series no. 1 with coil intensity normalization (prescan normalize); readout-segmented EPI (syngo RESOLVE, Siemens Healthcare); zoomed EPI (syngo ZOOMit, Siemens Healthcare; only 3.0T) on four separate field of view (FOV) locations, each covering one sample in the phantom; and series no. 1 with patient-specific B1 shim option (only 3.0T).
Key imaging parameters of the conventional, readout-segmented-EPI and zoomed EPI series.

EPI, echo planar imaging; FOV, field of view; GRAPPA, generalized autocalibrating partially parallel acquisitions; SPAIR, spectral attenuated inversion recovery; TE, echo time; TR, repetition time
Measurement of the ADC values
The mean ADC values and standard deviations (SD) were measured from the ADC map of the central slice of each acquired series with ImageJ version 1.44p (18). Two regions of interest (ROI) were placed on each of the four samples. An oval ROI (1200 ± 24 mm2) was placed on an artifact-free region. A circular ROI covered 75% of the sample (3800 ± 80 mm2). Examples of the ROIs are presented in Fig. 1. For inter-system comparisons, the ADC values were corrected for the average temperature difference of 3.2℃ between the two examination rooms, using the correction factor of 2.4%/℃ (19). To check the ADC uniformity in slice direction, the ADC values from all slices of conventional, readout-segmented EPI, and zoomed EPI series were measured for sample 1 with the 1200 mm2 ROI.
SNR measurements
Noise images, i.e. subtraction images from two consecutive acquisitions were calculated with ImageJ for trace-weighted images (b = 800 s/mm2). Before subtraction, an arbitrary fixed value of 500 was added to the pixel values of the images of the first acquisition to avoid problems with negative pixel values. SNR values were calculated from the central-slice image for each of the four samples by:

Assessment of the artifacts
A visual assessment of artifacts was carried out in consensus by a medical physicist and an MRI scientist with 10 and 7 years of experience in MRI quality assurance, respectively. The assessment was performed for two trace-weighted central-slice images (b = 0 s/mm2, b = 800 s/mm2) and the ADC map of each acquisition option, at both field strengths when applicable. To better visualize the artifacts, edge detection images were calculated for all the assessed images with Matlab 2014 a (The MathWorks, Inc., Natick, MA, USA) using the Sobel filter. They represented image intensity gradient magnitude, and they were scaled utilizing the mean intensity of the original slice.
Each image to be evaluated was opened side by side with an edge detection image calculated from it. Each sample 1–4 was given an image quality score of 0–3 (0, no artifact or obtrusive local noise; 1, small or mild single artifact or some obtrusive noise; 2, substantial artifact or noise, yet enabling a reasonable ADC measurement or reading of the image; 3, artifact or noise that notably affects the ADC measurement or reading of the image). All scores of each technique at both field strengths were summed and a relative artifact level index was calculated for each acquisition option AO by:
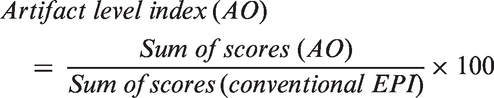
The artifact level indices for patient-specific B1 shim and zoomed EPI options were calculated based on 3.0T data only.
Results
The ADC values measured at the 1.5T system and the temperature-corrected ADC values from the 3.0T system are presented in Supplementary Table 1 (online only) for the two ROI selections. Apart from zoomed EPI and readout-segmented EPI, the differences of sample-specific ADC values measured with 1200 mm2 ROIs were <0.05 × 10⁻³ mm2/s compared to the conventional series at the same field strength. The values at 1.5T were slightly higher (0.05 × 10⁻³ mm2/s on the average) than at 3.0T. The readout-segmented and zoomed EPI sequences produced slightly higher ADC values (0.07 × 10⁻³ mm2/s and 0.03 × 10⁻³ mm2/s on the average, respectively) than the conventional sequences. The standard deviations of the 1200 mm2 ROI pixel values were ≤0.12 × 10⁻³ mm2/s in all measurements. With 3800 mm2 ROIs, the highest SD values were 0.16 × 10⁻³ mm2/s for 1.5T and 0.51 × 10⁻³ mm2/s for 3.0T. The highest SD values originated from B1 artifacts. Variation of approximately 0.1 × 10⁻³ mm2/s in ADC values as a function of slice number was observed, as well as sequence-dependent differences in this measurement (Figs. 3 and 4).
Slice by slice measurement of sample 1 ADC values in 1.5T from two consecutive acquisitions. Values of the first and last slices may have been affected by the edge of the sample. Slice-by-slice measurement of sample 1 ADC values in 3.0T from two consecutive acquisitions 1 and 2. Values of the first and last slices may have been affected by the edge of the sample. The zoomed EPI series had a restricted coverage in slice direction and the slice numbers are shifted to match the actual location of the phantom with other measurements.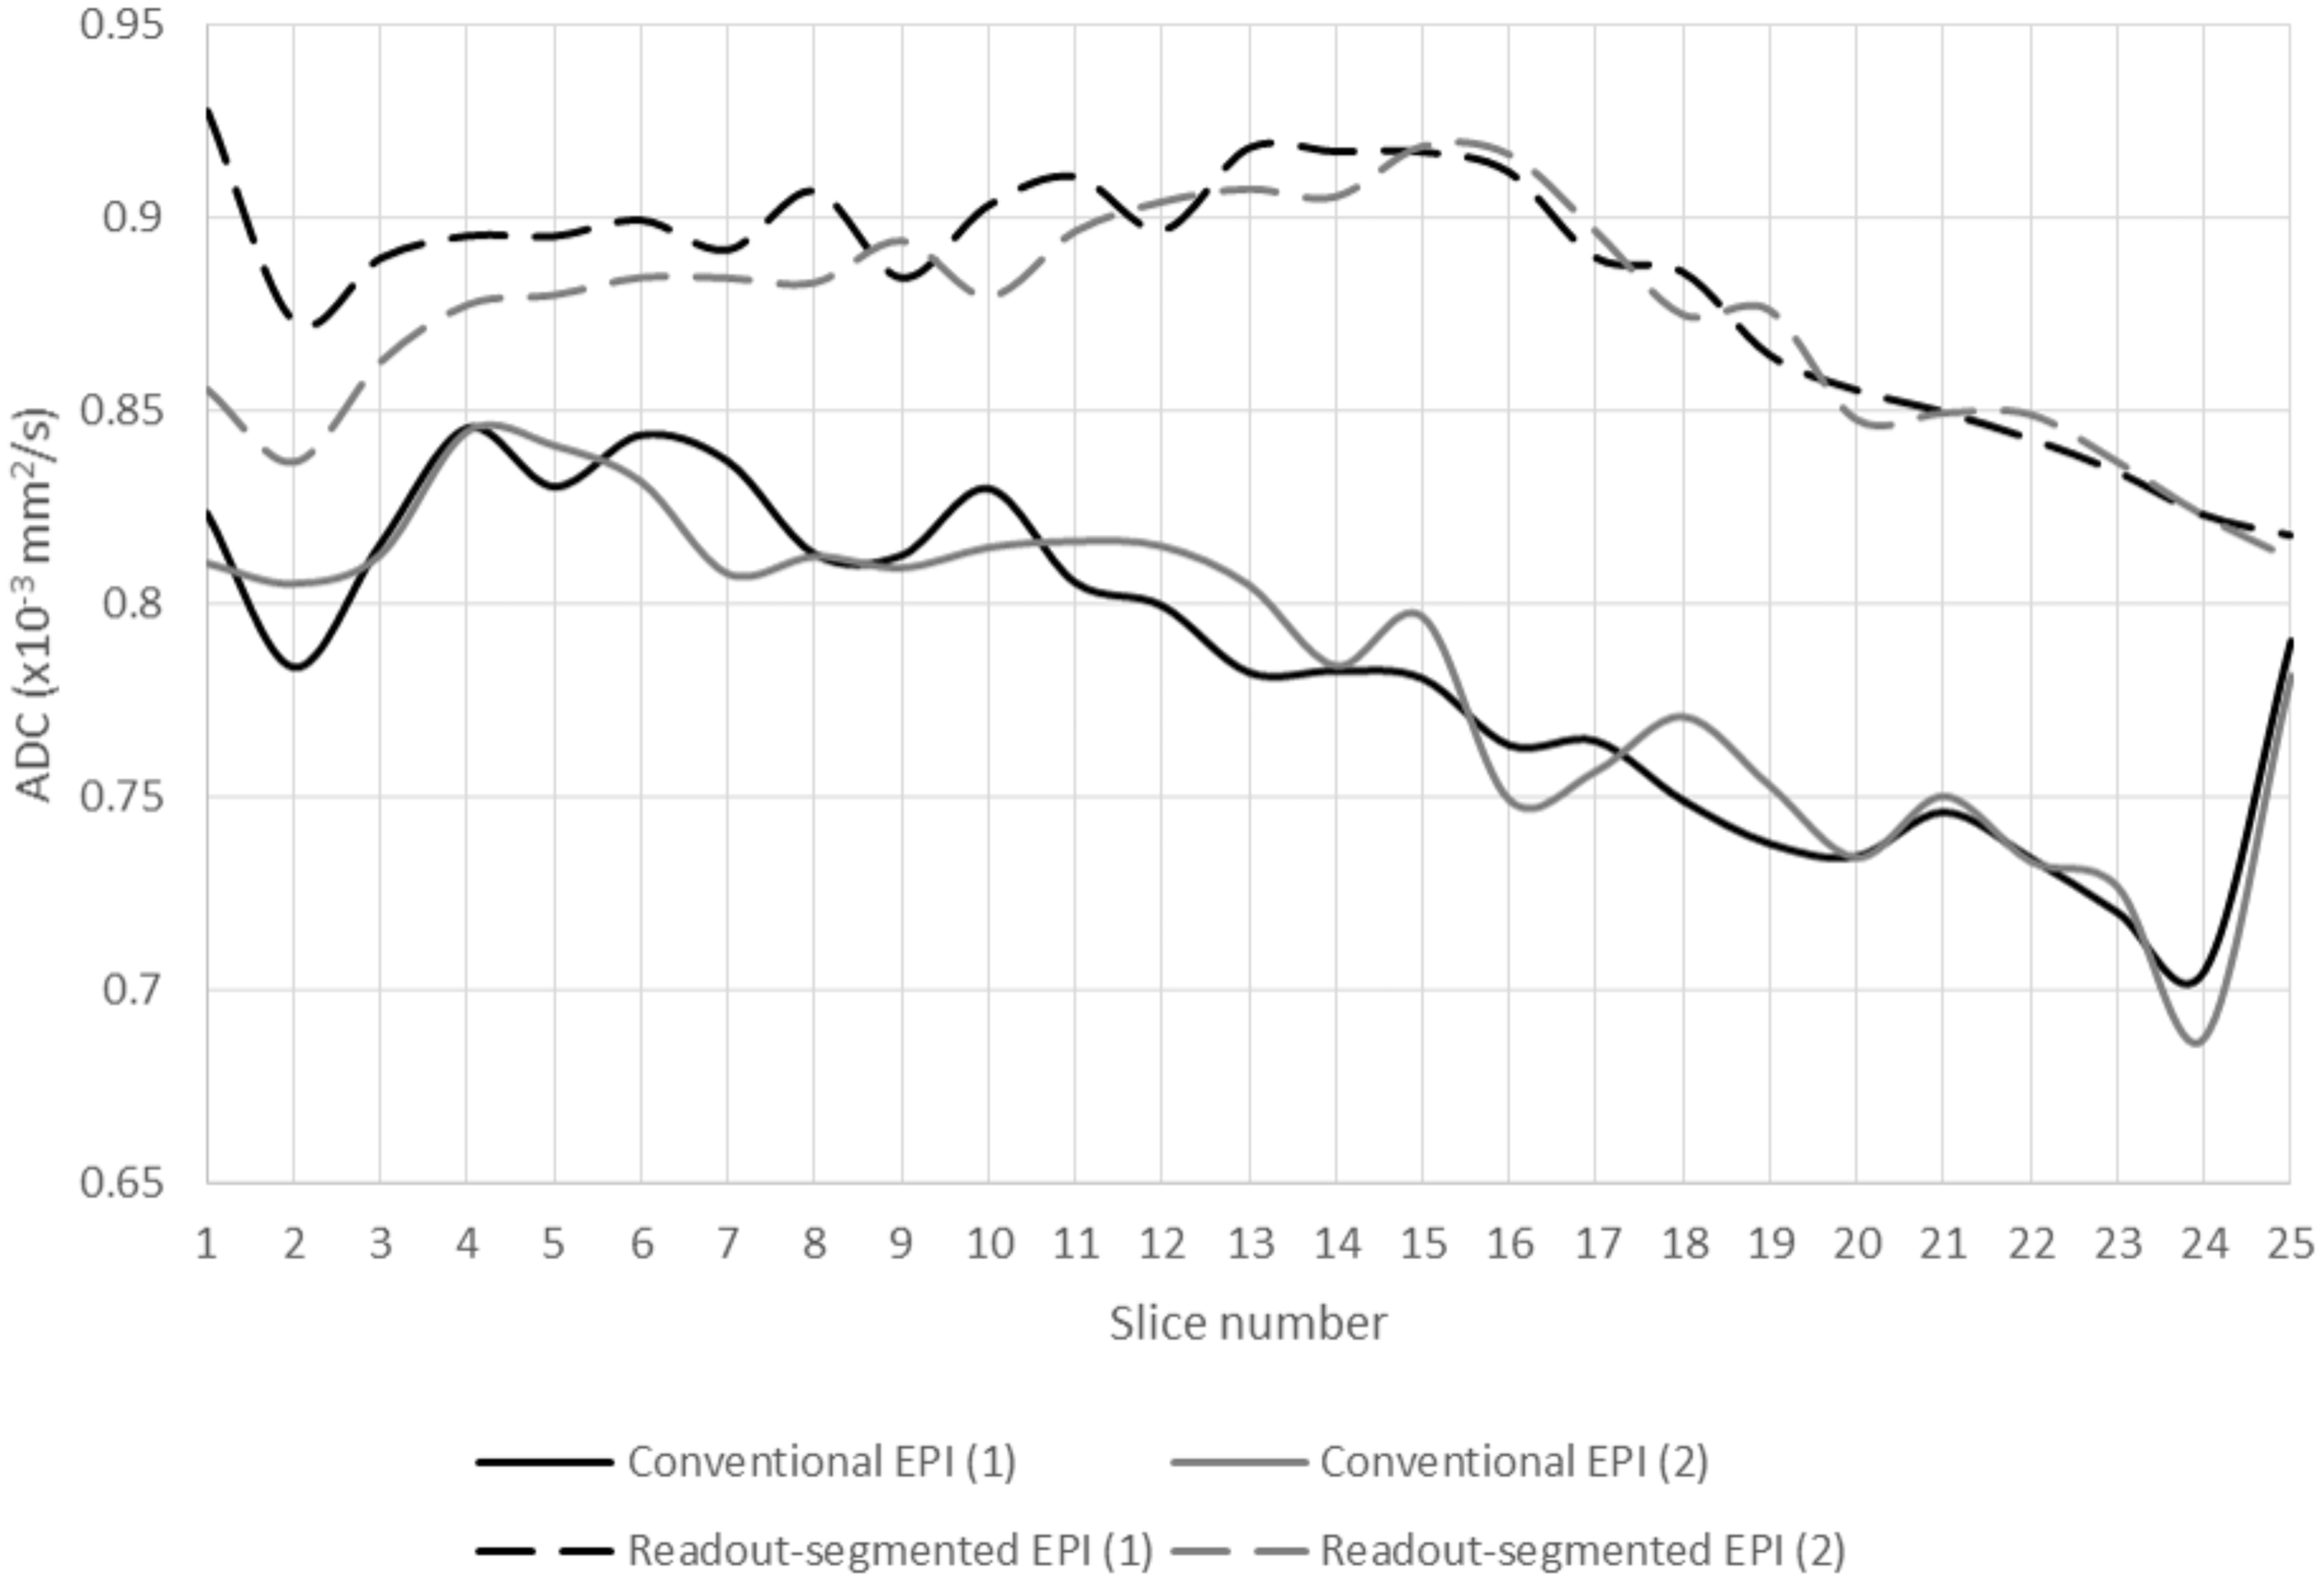

Signal-to-noise ratios (SNR) of diffusion-weighted images (b = 800 s/mm2) of individual samples 1–4 for different acquisition options.
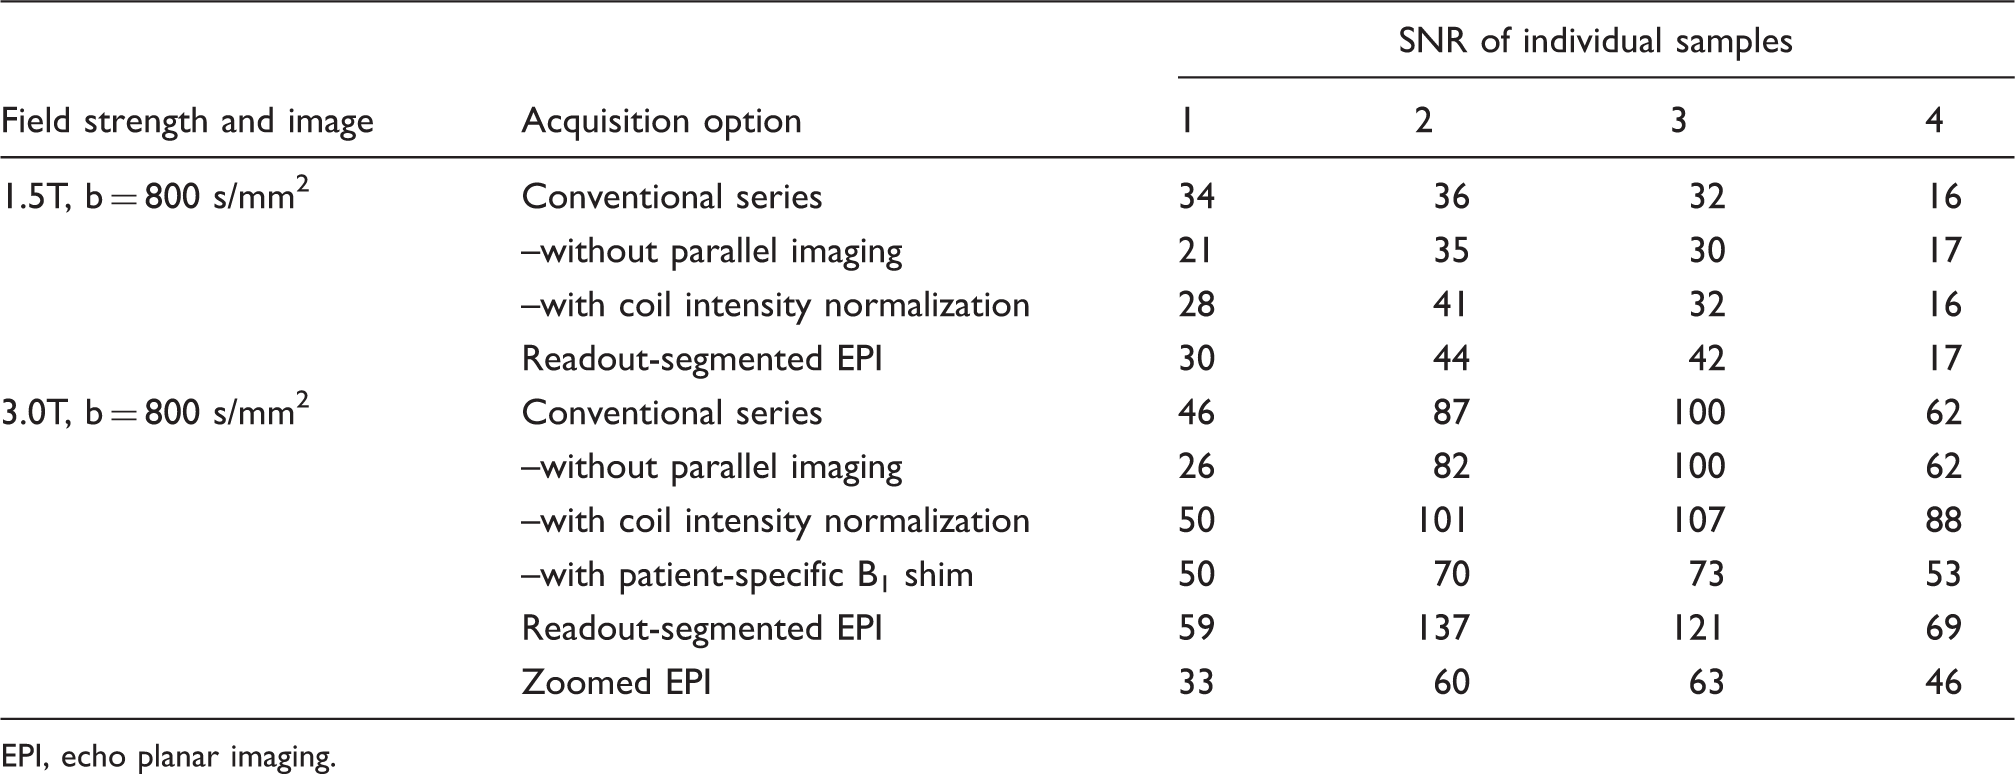
EPI, echo planar imaging.
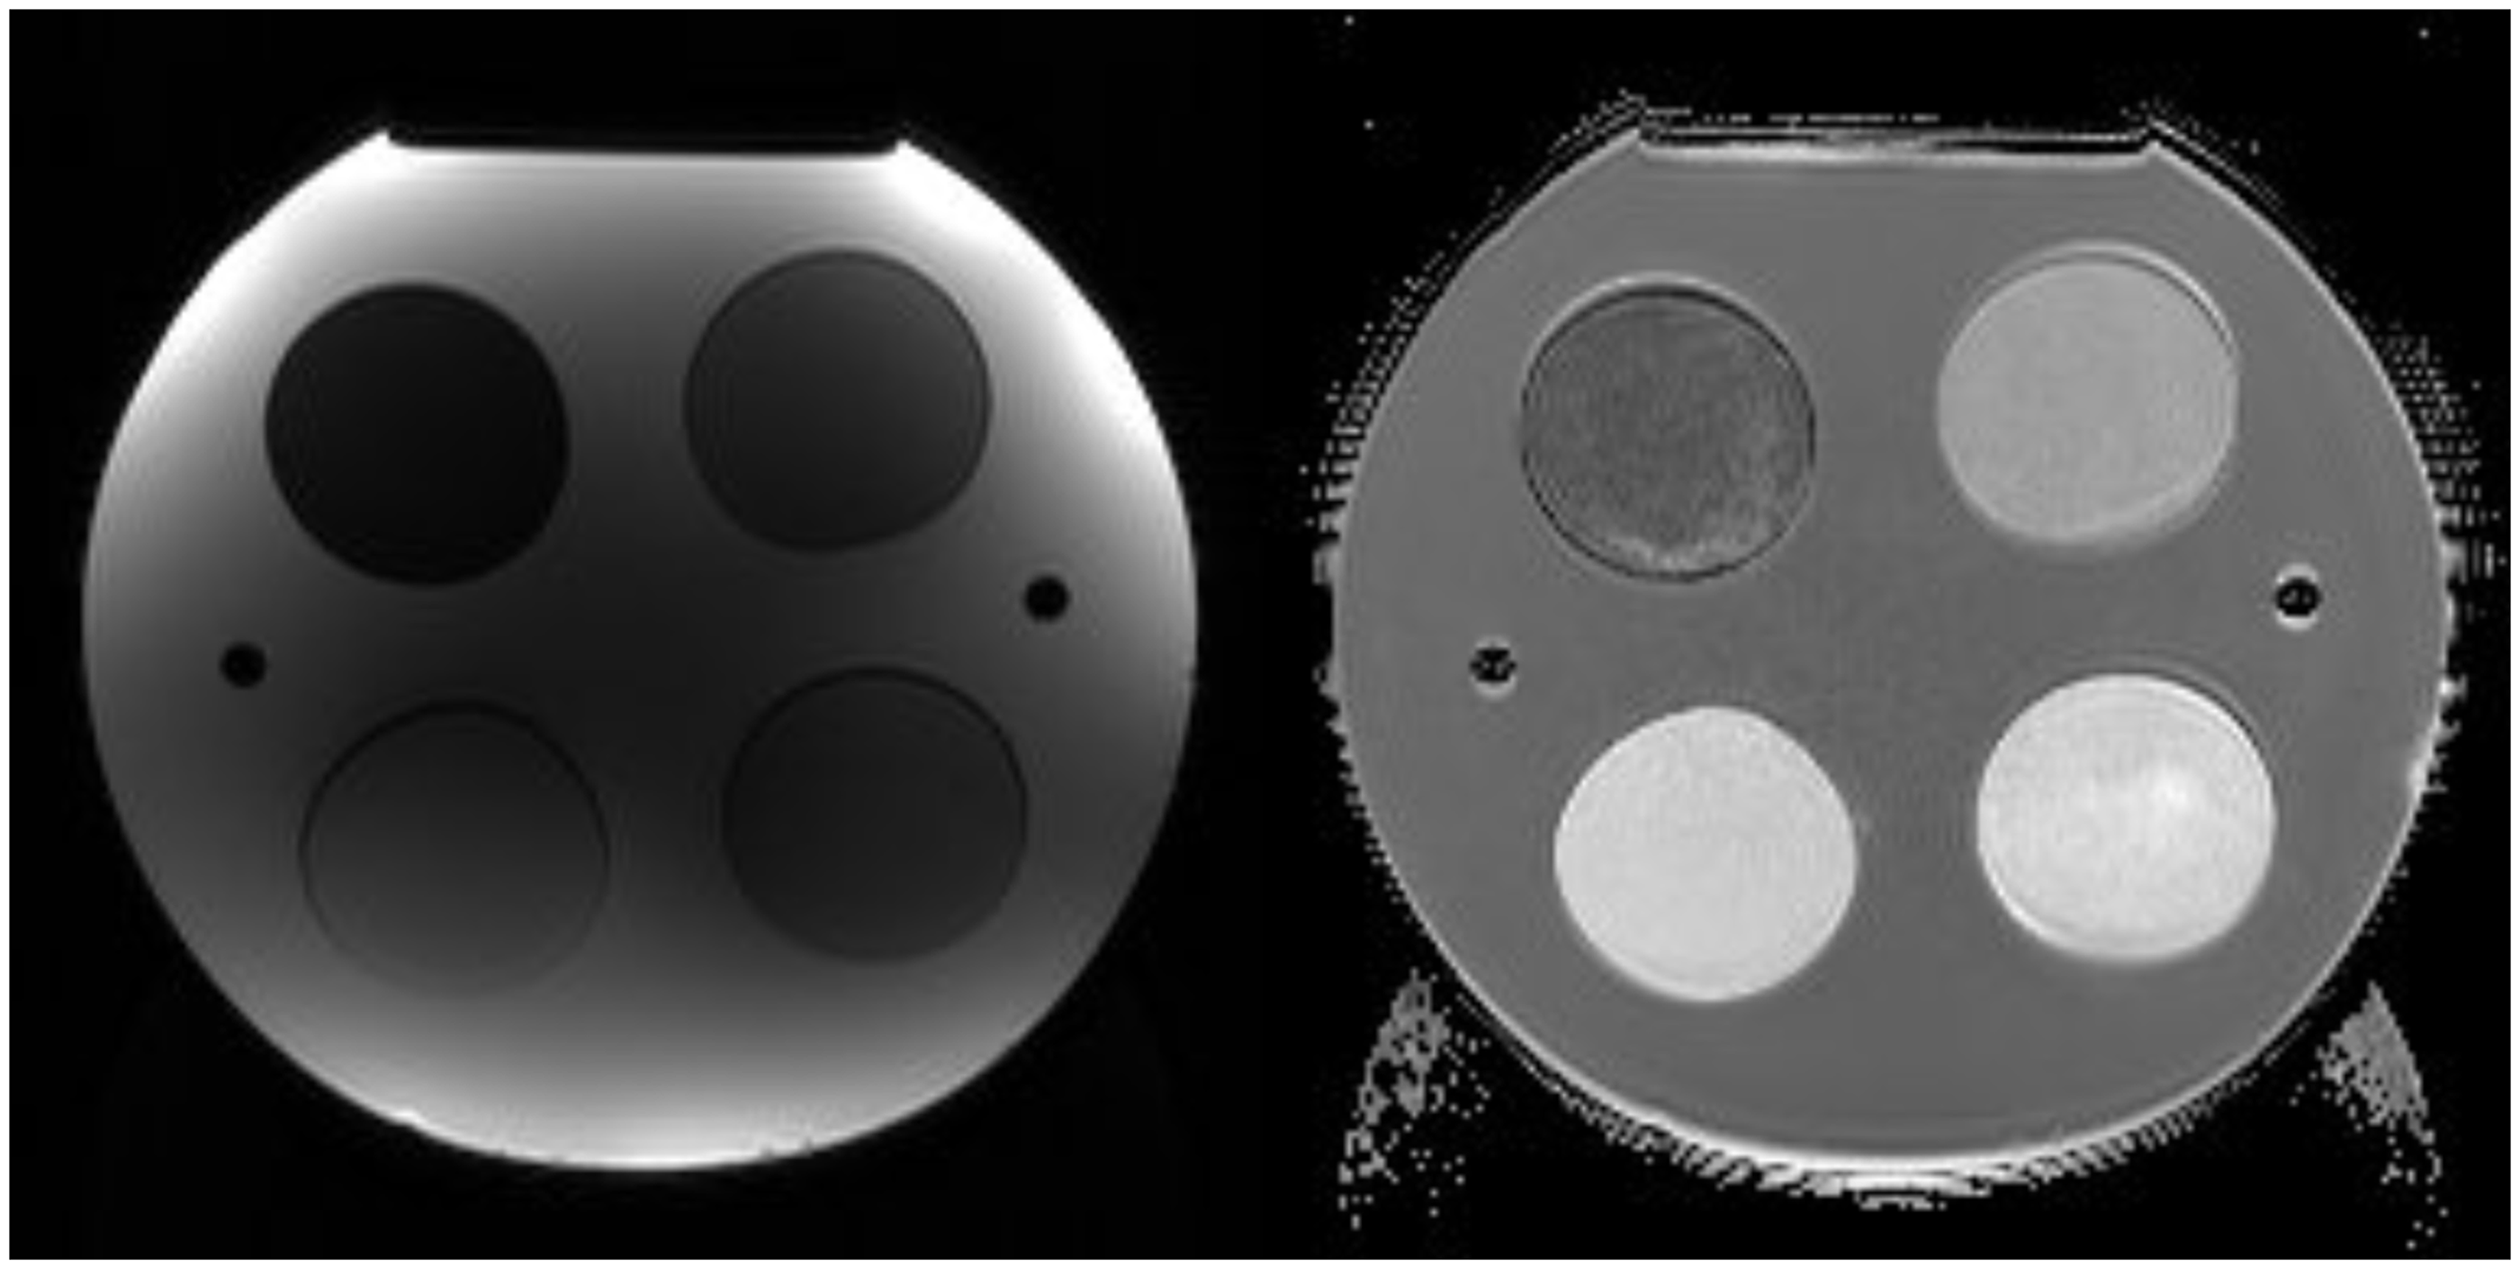
In the visual assessment of the artifacts, a relative artifact level index was calculated for each acquisition technique (conventional EPI = 100). The lowest index, meaning the lowest level of artifacts, was calculated for readout-segmented EPI (=64), followed by zoomed EPI (=78) and patient-specific B1 shim (=89). The images acquired without parallel imaging (=118) or with coil intensity normalization (=118) were given higher indices than conventional EPI. The positive effects of the patient-specific B1 shim function were clear at 3.0T (Fig. 5). The geometric distortion, blurring and N/2 artifacts were mostly absent from the readout-segmented EPI images (Fig. 6). Zoomed EPI produced mostly artifact-free images, apart from B1 artifact similar to conventional and readout-segmented EPI. An example of edge detection image is presented in Fig. 7, demonstrating stronger artifacts in a 3.0T image compared with a 1.5T image.
The effect of patient specific B1 shim option (right) in trace-weighted image (b = 400 s/mm2) at 3.0T. A trace-weighted image (b = 0 s/mm2) and an ADC map acquired with readout-segmented EPI sequence at 1.5T. Edge detection images reflecting image intensity gradient magnitude, calculated from trace-weighted images (b = 800 s/mm2) including coil intensity normalization option at 1.5T (left) and 3.0T (right). With this option there are no strong intensity gradients near the coil elements on the phantom surface area. The increased intensity in the central area of the image arises from increased noise due to signal (and noise) amplification, and partly from parallel imaging. The intensity gradients on the sample areas are stronger at 3.0T. The chemical shift effects and distortion are also larger at 3.0T, as expected. Note the effect of a distortion correction filter seen on the edges of the images.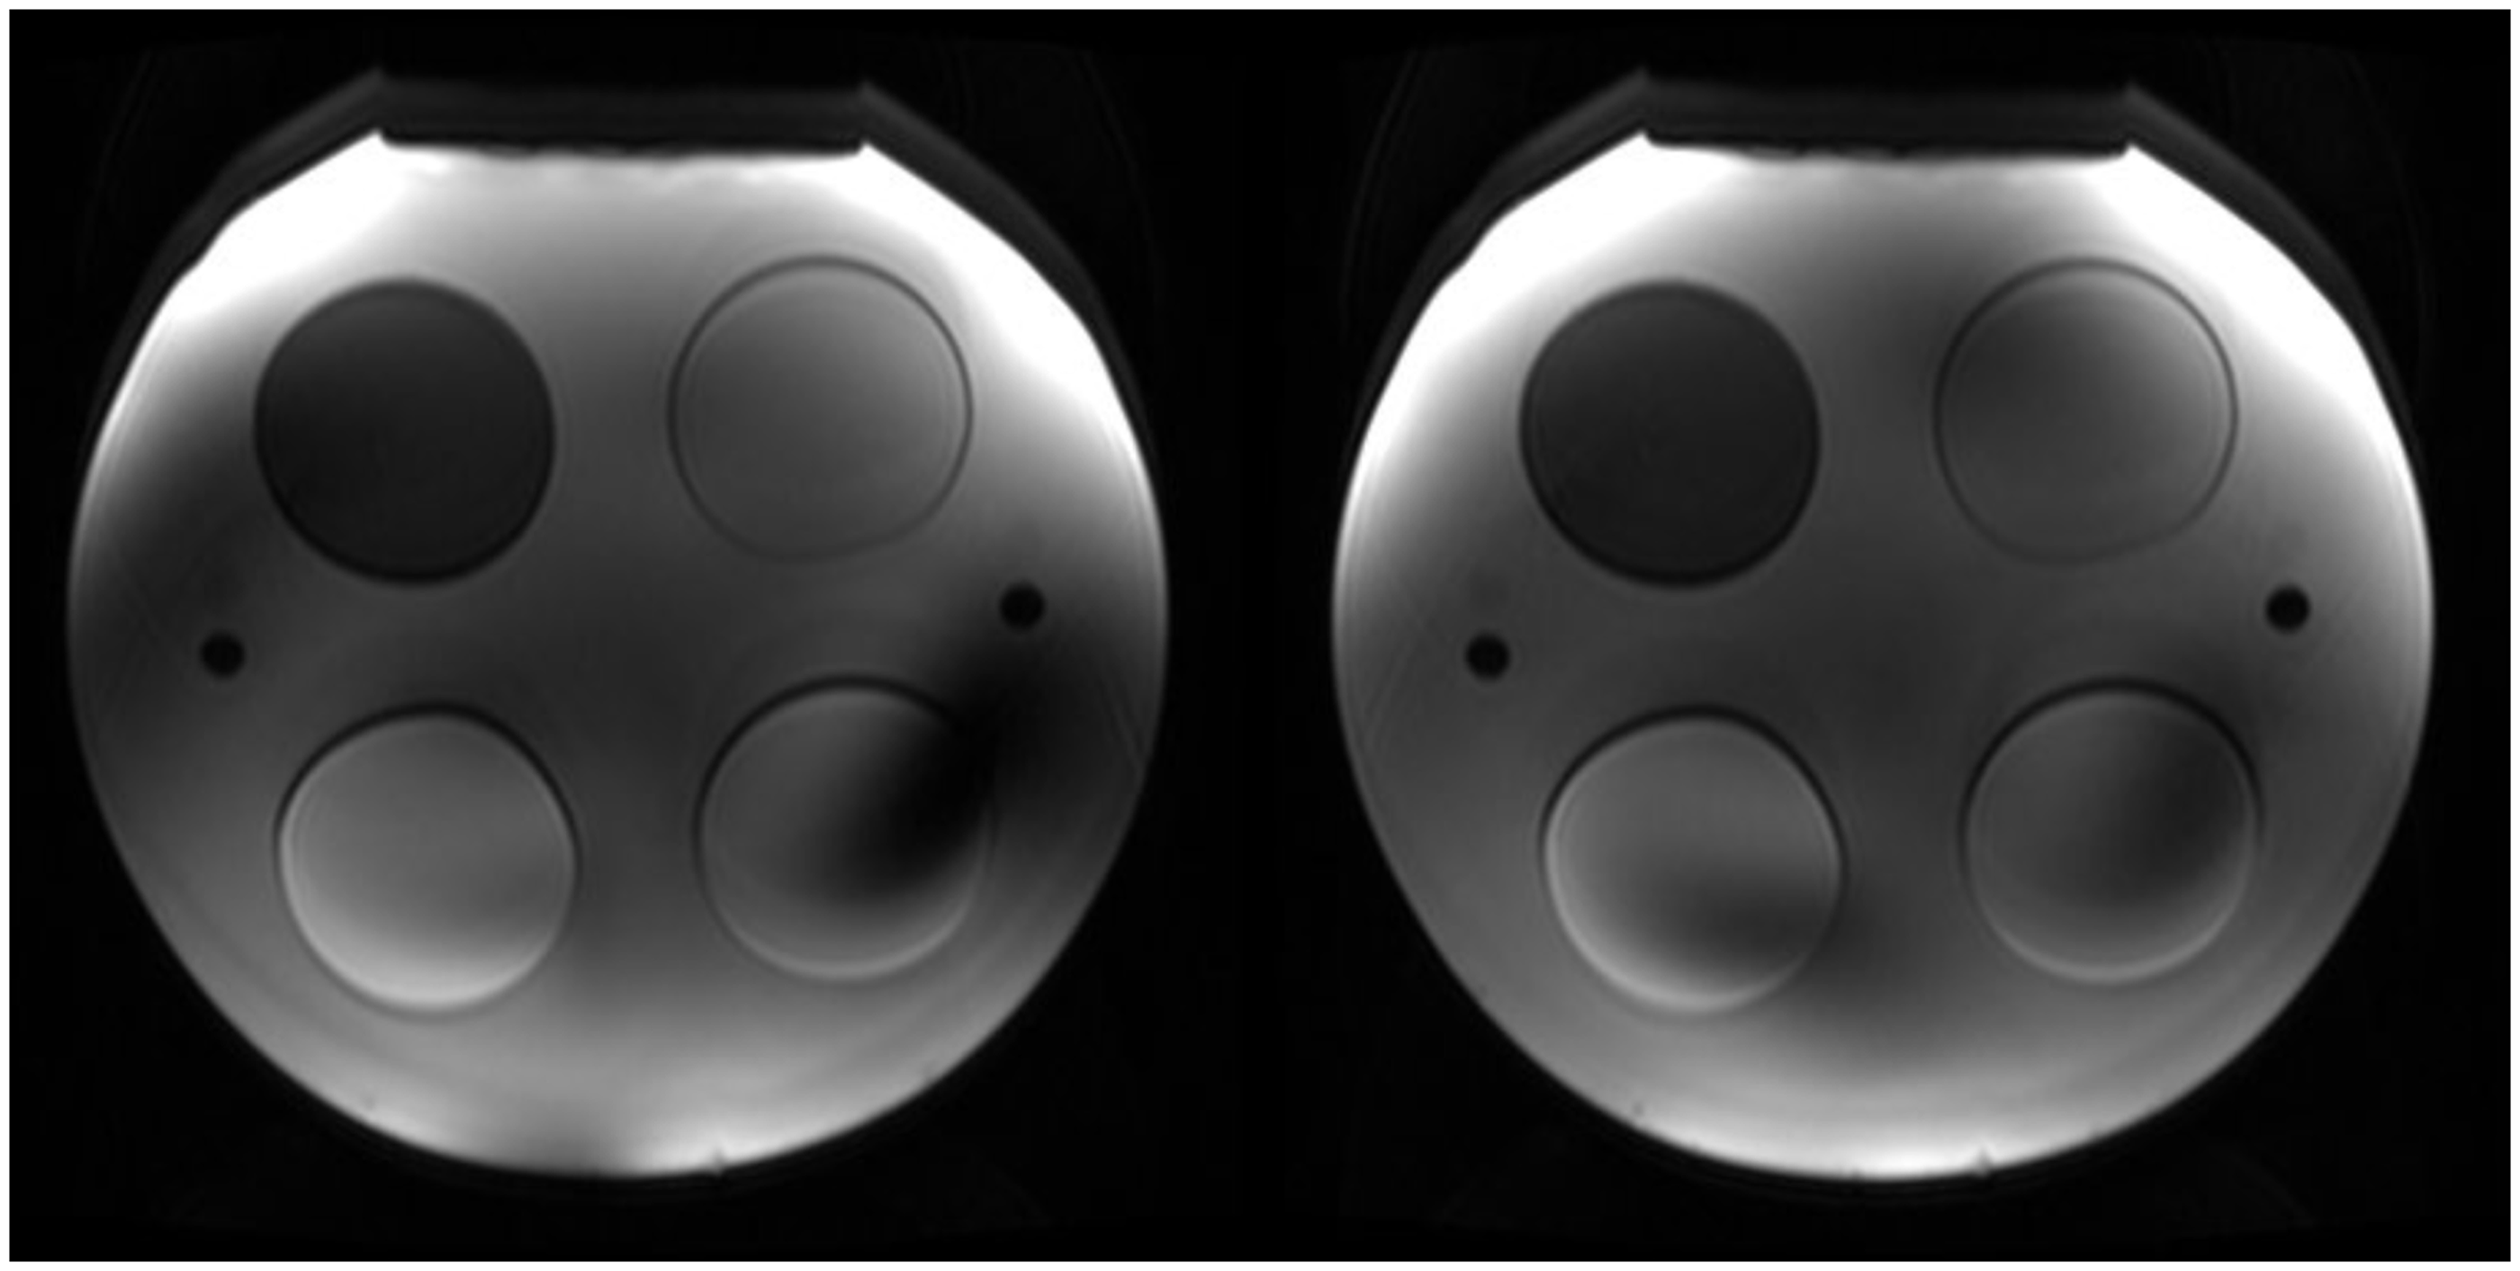

Discussion
The aim of this study was to construct a body-sized phantom for the evaluation of diffusion-weighted body MR image quality and ADC values with different acquisition options at 1.5T and 3.0T. The agreement of ADC values was generally good, but differences between conventional and readout-segmented EPI acquisition as well as off-center variation in slice direction were observed. The phantom demonstrated well the lower level of image artifacts in acquisitions using patient-specific B1 shim, readout-segmented EPI, or zoomed EPI.
Although a body-sized phantom can be considered impractical (6), the phantom construction was a straight-forward procedure. The size of the phantom was essential to reflect abdominal imaging conditions and especially in demonstrating the artifacts related to the inhomogeneous B1 field. The observed ADC values differed slightly from the expected. This may have been caused by slight modifications to the manufacturing process of the gels compared to Lavdas et al. (5).
We observed a small difference in the ADC values between 1.5T and 3.0T systems, which is in concordance with the values reported by Lavdas et al. for the same vendor (6). In our study the temperature differences, although corrected, may have caused uncertainty in the observed ADC values. The difference between the room temperatures at the beginning and at the end of the measurements was ≤0.5℃. However, the phantom may have warmed up in the system bore during the measurements, which could be detected only by measuring the temperature directly from the liquid inside the phantom. Also, the ADC temperature correction may be not accurately valid for the gels; however, the temperature differences in our study were small. We believe that the accuracy of controlling the phantom temperature was sufficient for this study.
A suitable phantom could be used in calibration of the ADC values in an imaging center using several MRI systems, which in turn would facilitate the use of the values, e.g. in the therapy response evaluation. There are, however, intra-system problems as well. The slice-by-slice variation of the ADC was in line with the observation of Malyarenko et al., who have reported the measurements being less reproducible across scanners in the off-center region, explained by gradient non-linearities (4). This issue affects especially the DWI of liver, because a large part of the liver can be located near the edge of the FOV. In our study gradient non-linearity could explain the trends observed in Figs. 3 and 4, but not the differences between conventional and readout-segmented EPI sequences. These differences require further investigation. Significant differences in the ADC values between conventional and readout-segmented EPI were not observed in other recent phantom or patient studies (20,21).
The efforts for the standardization of the DWI have focused on the ADC, even if reviewing of the trace-weighted images is at least equally important in clinical routine. We observed variability in SNR and contrast in the trace-weighted images acquired with different imaging options. Although coil intensity normalization had only minor effects on the ADC values, it altered the contrast of individual objects substantially in the trace-weighted images. The use of coil intensity normalization should therefore be standardized in clinical protocols.
The image artifacts arose from the basic properties of the EPI sequence (N/2-type artifacts, blurring, and geometric distortion), the use of parallel imaging, and B1 inhomogeneity at 3.0T. The use of patient-specific B1 shim function enabled reduction of the artifacts. The use of parallel imaging is beneficial in abdominal DWI, but the artifacts can be problematic in the ADC measurements. These artifacts are probably pronounced in phantom images. The effects of parallel imaging on ADC measurements have not been reported in human studies (22,23). The typical artifacts of the conventional EPI sequence were largely removed by using the readout-segmented EPI sequence in this study. Based on these encouraging results, the clinical feasibility of this sequence in body area should be closer studied, despite the longer imaging time and possible problems with motion. Also zoomed EPI has clinical potential in artifact reduction, shown also in clinical studies published so far (24–27).
The number of ADC measurements was limited, thus the results of the ADC differences were preliminary in nature. The measures to control the effects of temperature dependency were also limited, which could be addressed by replacing one of the samples with a bottle of pure water to act as a standard of reference. Intra-system repeatability of the phantom ADC results was not measured. However, Lavdas et al. have found the ADC intra-system repeatability to be excellent for similar sample compositions (5). Finally, our phantom study offered a limited view on clinical DWI. The perfusion effect or motion were not present in the phantom, and large volume of liquid and sharp interfaces may have produced stronger artifacts than a real patient.
In conclusion, the evaluation of diffusion-weighted MRI data with the body-sized phantom showed good agreement of ADC values between different acquisition options and field strengths. The use of patient-specific B1 shim, readout-segmented EPI, or zoomed EPI reduced the artifacts of DWI in this study.
Footnotes
Acknowledgements
The authors would like to thank Matti Keinänen, laboratory technician, for his help in constructing the phantom.
Declaration of conflicting interests
The author(s) declared no potential conflicts of interest with respect to the research, authorship, and/or publication of this article.
Funding
The author(s) received no financial support for the research, authorship, and/or publication of this article.
References
Supplementary Material
Please find the following supplemental material available below.
For Open Access articles published under a Creative Commons License, all supplemental material carries the same license as the article it is associated with.
For non-Open Access articles published, all supplemental material carries a non-exclusive license, and permission requests for re-use of supplemental material or any part of supplemental material shall be sent directly to the copyright owner as specified in the copyright notice associated with the article.