



Abstract
Background
Left ventricular (LV) function has traditionally been the focus for cardiac magnetic resonance imaging (MRI) investigations, but similar methods can also be applied to the left atrium (LA). Previous studies elsewhere have almost entirely involved the use of 1.5T systems, but 3T MRI can provide faster data acquisition with thinner image slices, and may be more suitable for quantifying the structure and function of the LA.
Purpose
To evaluate 3T-MRI for LA volume assessments in: (i) healthy volunteers (HV); (ii) patients with LV-hypertrophy and ischemia (LVHI); and (iii) patients with LV-hypertrophy and diabetes (LVHD).
Material and Methods
Participants were imaged using a balanced steady-state free precession sequence. Healthy volunteers were scanned twice and patients were scanned on one occasion. Volumes were segmented by two observers, and coefficients of repeatability (CoR) were derived.
Results
For LA volumes (indexed to body surface area), CoRs were in the range of 1.3–4.6 mL/m2. The LVHI patients had enlarged LA volumes (diastolic, 46.4 mL/m2; systolic, 25.9 mL/m2) and reduced ejection fraction (EF) (44.9%) relative to the HV (diastolic, 39.0 mL/m2; systolic, 17.8 mL/m2; EF, 54.5%) and LVHD groups (diastolic, 41.4 mL/m2; systolic, 20.2 mL/m2; EF, 50.7%). LA volumes were moderately correlated with LV mass in the HV group (R2 = 0.59 for LA end-systolic volume), but became weaker (R2 ≤ 0.17) for patient groups.
Conclusion
3T-MRI derived LA volume measurements are simple and repeatable, and can elicit clear differences between LVHI patients and HVs. These MRI endpoints provide scope for improved radiological interpretation of LA structure and function, and the high degree of repeatability validates their use for longitudinal investigations where precision work is essential.
Introduction
Left atrial (LA) size and function are known to be important prognostic factors for cardiovascular disease (CVD). An enlarged LA may be indicative of pathology such as atrial fibrillation (AF) (1), cerebral ischemic events (2), and various cardiomyopathies (3–5) leading to increased risk of morbidity and mortality (6).
Magnetic resonance imaging (MRI) offers many advantages for cardiac imaging, including flexible field of view (FOV), excellent blood-tissue contrast, and the ability to apply precise geometric coverage to any imaging plane. The image resolution permits clearer border detection of the LA compared to other techniques such as ultrasound (7), and the use of CINE steady-state free precession (SSFP) sequences has evolved as the sequence of choice since it can provide excellent depiction of the LA (8).
In order to measure LA structure and function, simple assessments of length or area can be acquired, and model-based assumptions may be applied where the volume is calculated by “bi-plane” area-length measures (9) or by ellipsoid geometry (10). These assessments are quick, but shape modeling assumptions can be susceptible to errors since the LA is an asymmetric cavity. Further, LA dilation is unlikely to be evenly distributed in all planes and measurements of simple dimensions may be further insensitive to change for this reason (11).
Previous studies where Simpson’s rule has been used to define LA volume parameters.

Abs, absolute value; AF, atrial fibrillation; CC, cyclic volume change; DCM, dilated cardiomyopathy; E, excluded; F, female; fGRE, fast gradient echo; FOV, field of view; GRE, gradient echo; HC & A, healthy children and adolescents; HCCMD, heritable cardiac conduction and myocardial disease; HCM, hypertrophic cardiomyopathy; HLA, horizontal long axis; HTP, heart transplant patient; HV, healthy volunteers; I, included; LAA, left atrial appendage; M, male; N, data not available; Norm, normalized value; Old, older group; P, prospective gating; Pulse seq, pulse sequence; PV, pulmonary vein; R, retrospective gating; Ref, reference as numbered in manuscript; SA, short axis; SPGR, spoiled gradient echo; SSFP, steady-state free precession; STEMI, ST segment elevation myocardial infarction; T, Tesla; Var, variable field strength; VLA, vertical long axis; Y, yes; Young, younger group.
The primary aim of this pilot study was to implement a suitable 3T MRI protocol for optimized scanning of LA structure and function. For the technique to be considered useful, the resulting LA assessments should be: (i) sensitive to variation between different clinical groups; (ii) repeatable over successive scans within a short timescale; and (iii) consistent whether single or multiple observers undertake the postprocessing. Therefore, the specific objectives were to address these research questions by scanning a group of healthy volunteers at two time points over the course of a single day (“AM” and “PM”), and two groups of patients with CVD on a single occasion. The former would enable “single time-point”, “scan-to-scan”, “intra-observer”, and “inter-observer” measurement repeatability to be examined, while the latter would enable LA structural and functional differences between the study groups to be identified.
Material and Methods
The following three fully-informed and consenting study groups were recruited: 1, healthy volunteer (HV) group (8 men, 7 women; age range, 24–39 years; mean age, 31 years), with no prior history of cardiovascular disease and no contraindication to MRI. This group was included to derive a young “baseline” range for LA volumes and to provide a “hardest case” (smallest LA volumes) test for repeatability testing of the analysis software; 2, patients with LV-hypertrophy and ischemia (LVHI) group (13 men, 6 women; age range, 50–79 years; mean age, 66 years), with known history of ischemic heart disease or angina, LVH by M-Mode echocardiography as defined by the American Society of Echocardiography (115 g/m2 for men, 95 g/m2 for women), blood pressure (BP) <150/90, and no contraindication to MRI; 3, patients with LV-hypertrophy and diabetes (LVHD) group (11 men, 8 women; age range, 40–81 years; mean age, 64 years), with clinical type 2 diabetes, LVH (as defined above), BP <150/90, and no contraindication to MRI.
Healthy volunteers were scanned at two time-points (“AM” and “PM” on the same day) and patient volunteers were scanned at a single time-point. MRI was performed on a 3T Magnetom Trio (Siemens, Erlangen, Germany) using body array and spine matrix coils.
For LA assessment, a two-dimensional (2D) ECG-gated segmented CINE True Fast Imaging with Steady-State Free Precession (TrueFISP) sequence with retrospective gating was used to acquire a stack of “2ch” images (typically 10–14 slices) from the lateral side of the LA to the atrial septum (Fig. 1). Two slices (each 5 mm) were acquired per breath-hold at end expiration. Other imaging parameters were: TR/TE, 3.4/1.5 ms; flip angle (FA), 50°; parallel imaging (GRAPPA) factor, 3; and in-plane resolution, 173 × 256 over a targeted FOV of 360–420 mm. The same sequence was also used for LV assessment, where a short axis (SA) stack of data was acquired from the atrio-ventricular ring to the apex. The imaging parameters were: TR, 3.4 ms; TE, 1.5 ms; and FA, 50°. Two slices per breath-hold were obtained, with a parallel imaging (GRAPPA) factor of 2 and slice thickness of 6 mm (4 mm gap). The in-plane resolution was 128 × 192 pixels, with a FOV in the range of 340–450 mm.
Image acquisition and segmentation of quantitative left atrial parameters.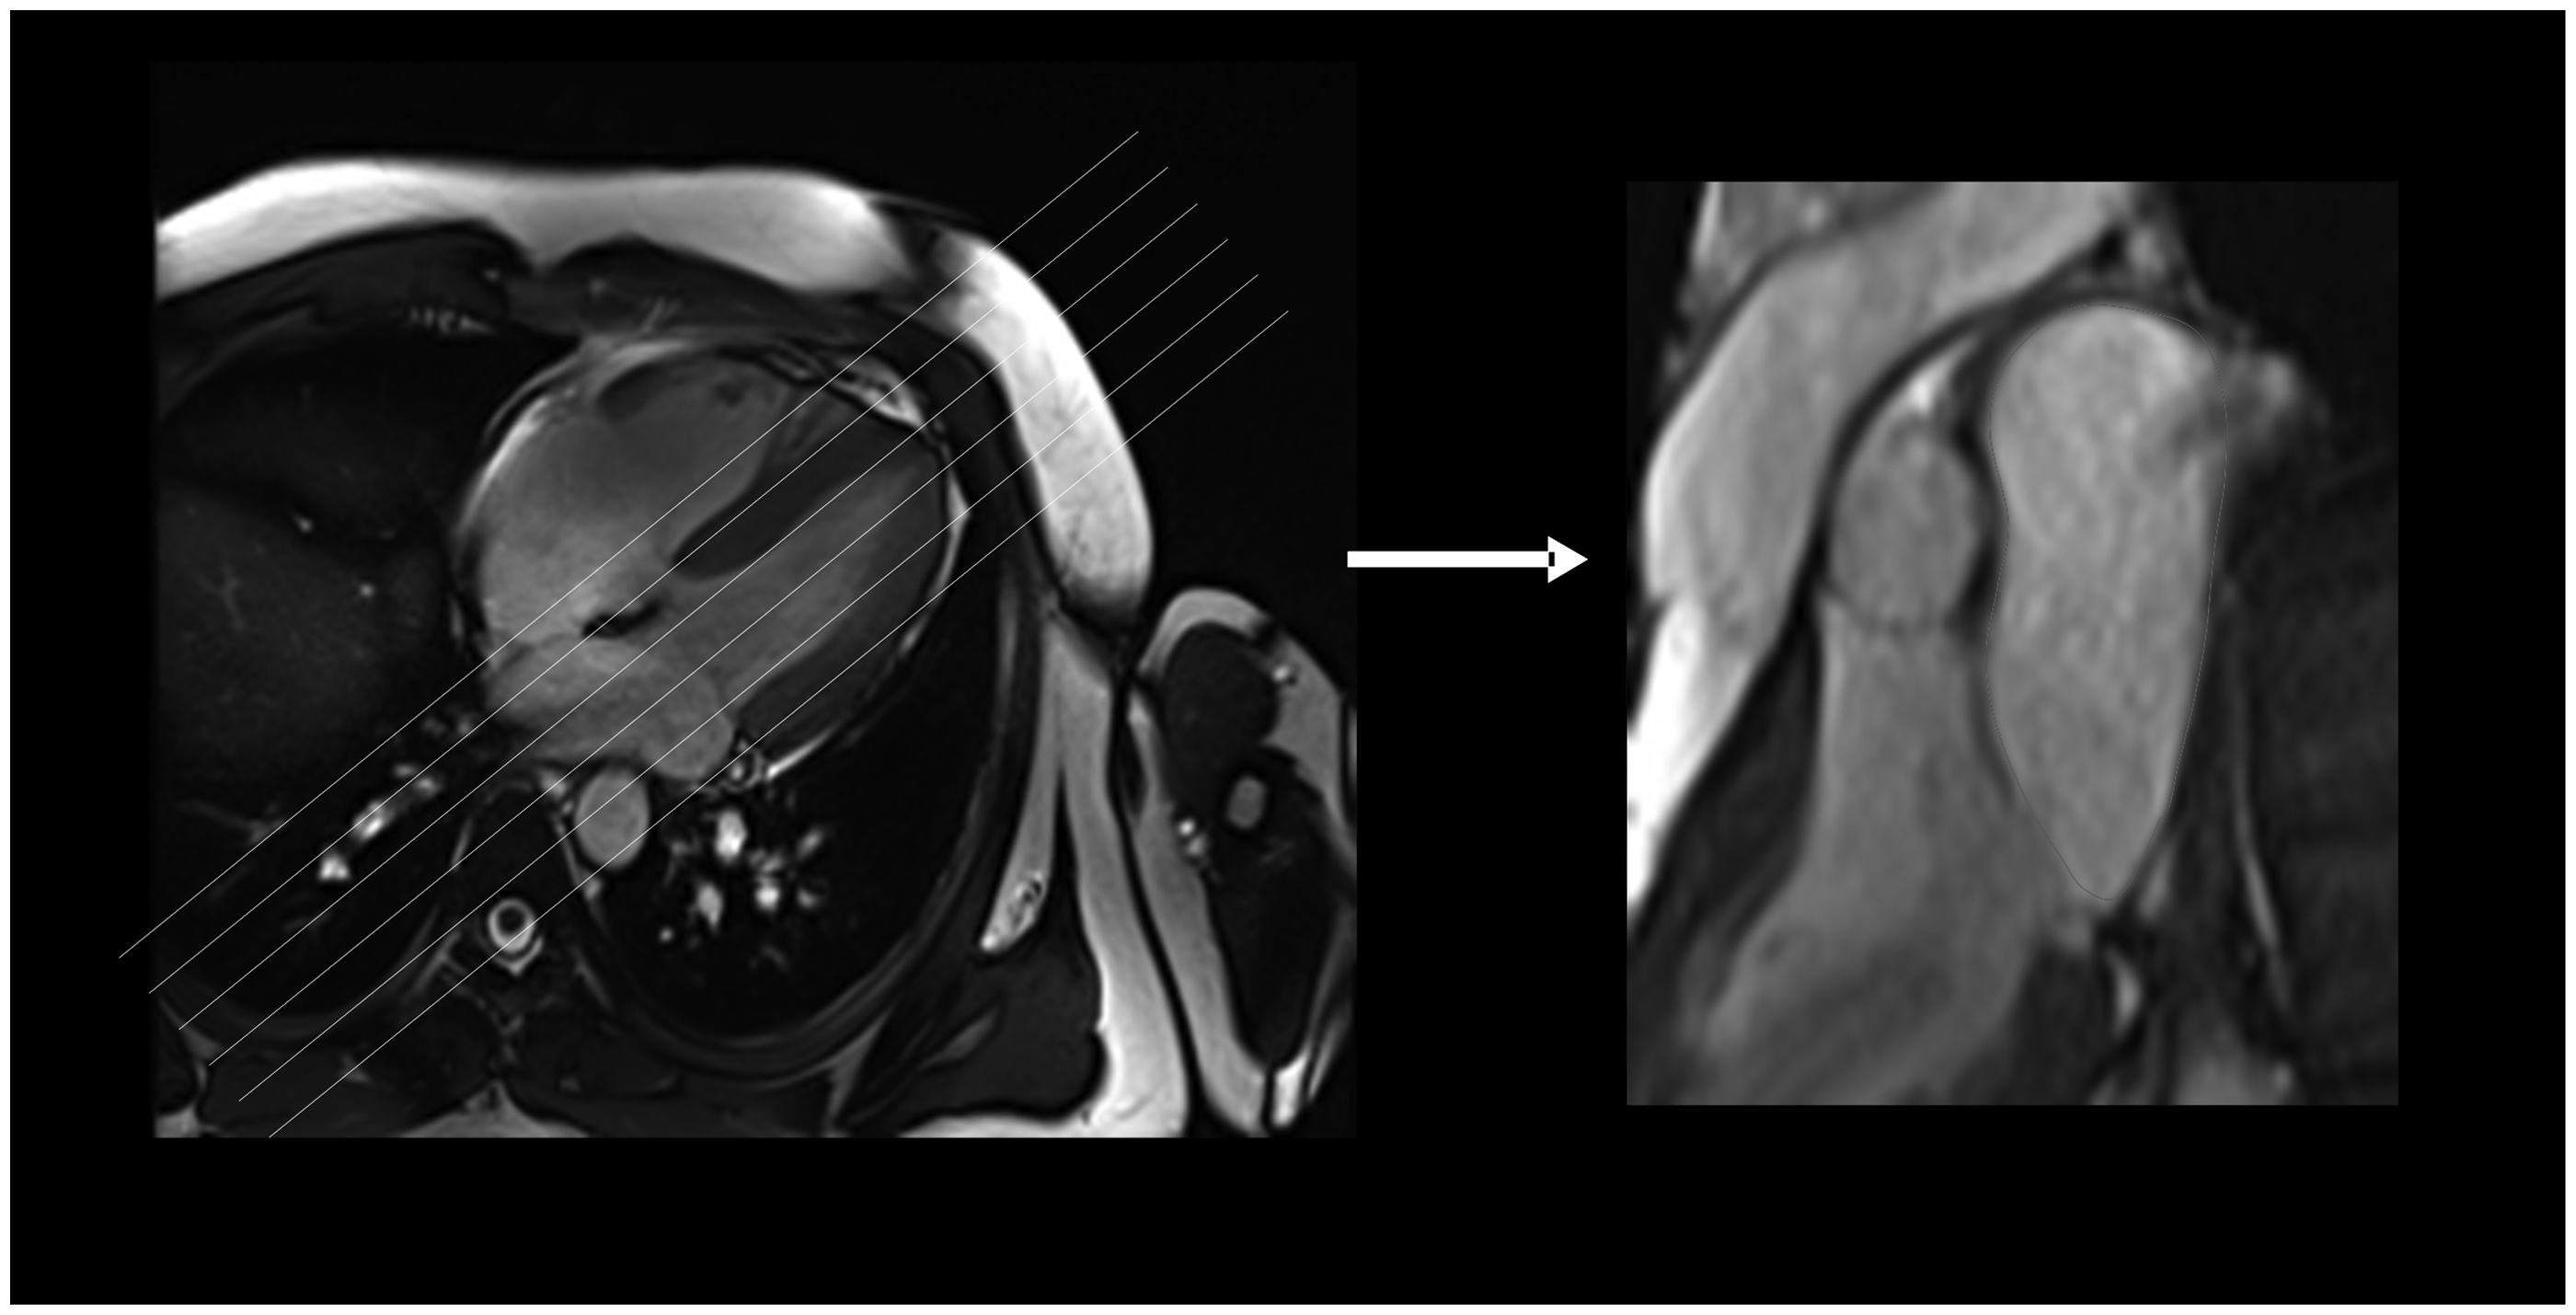
Segmentation of the LA (Fig. 2) for all participants was performed twice by an MRI physicist observer (with 10 years of CMR experience) using commercial software (“Argus”, Multi-Modality Work Platform, version VB17, Siemens). Contours were defined at atrial diastole and systole by measuring the blood volume contained by the atrial wall and the mitral valve. The LA appendage was included, and pulmonary vein structure was excluded wherever possible. Repeated segmentations were completed with at least 1 month between each analysis to ensure that “learning bias” was minimized. Additionally, a second MRI physicist observer (with 7 years of CMR experience) performed the segmentation once for every participant in order to establish inter-observer variability. The LA ejection fraction (LA-EF), end-diastolic volume (LA-EDV), end-systolic volume (LA-ESV), and stroke volume (LA-SV) were derived and indexed to body surface area (BSA) (35). Segmentation of the LV SA data was also undertaken in order to derive LV ejection fraction (LV-EF), end-diastolic volume (LV-EDV), end-systolic volume (LV-ESV), stroke volume (LV-SV), and LV mass. The LV endocardial and epicardial borders were defined on images at end-diastole (ED) and end-systole (ES) by each observer. Image slices were included if more than 50% full-thickness myocardium was visible, and papillary muscles were included within the LV mass if they were visibly indistinguishable from the endocardial wall.
Statistical testing for normality of all data was examined using the Shapiro-Wilks test (SPSS, IBM Corporation, Armonk, NY, USA) and analysis was performed using one-way analysis of variance (ANOVA) to test the null hypothesis that there were no structural or functional differences in the mean LA parameters between any of the groups. Intra- and inter-observer repeatability of LA measurements was examined by use of Bland–Altman statistics and described by the coefficient of repeatability (CoR). Correlations between LA volumes and the LV parameters were also investigated.
Results
All MR data were acquired successfully except for one healthy volunteer who “moved” during the PM LA scan. This dataset was removed from the subsequent analysis phase.
An example of a LA (with contour placement) in the 2ch plane is shown in Fig. 2. Visual inspection revealed that the LA volumes in the LVHI group appeared larger than for the other groups. An example is shown (Fig. 2), where images at LA end-diastole and LA end-systole are illustrated side-by-side for LVHI and HV participants.
Example left atrial segmentation in (a) a healthy volunteer (HV) and (b) a patient volunteer with LVH and angina (LVHI).
Left atrial volume data – for healthy volunteers (HV – at AM and PM), patient volunteers with left ventricular hypertrophy and ischemia (LVHI), and patient volunteers with left ventricular hypertrophy and diabetes (LVHD). Data were acquired by observers 1 and 2.

Significant differences were identified between the LVHI and HV groups for mean LA-EDV (46.4 mL/m2 vs. 39.0 mL/m2, P < 0.05), LA-ESV (25.9 mL/m2 vs. 17.8 mL/m2, P < 0.05), and LA-EF (44.9% vs. 54.5%, P < 0.05). Similar changes were also identified between the LVHI group and the LVHD group for mean LA-ESV (25.9 mL/m2 vs. 20.2 mL/m2, P < 0.05) and LA-EF (44.9% vs. 50.7%, P < 0.05). The mean LA-EF was also slightly lower in the LVHD group relative to the HVs (50.7% vs. 54.5%, P < 0.05) but otherwise there were no significant differences measured between these two groups. The mean LA-SV remained stable across all study groups (21.2 +/− 3.7 mL/m2 for HV, 20.5 +/− 5.7 mL/m2 for LVHI and 21.2 +/− 7.4 mL/m2 for LVHD), suggesting that blood volume delivery into the LV remains preserved – despite the structural differences identified.
Corresponding LV parameters have been measured but are not described in detail in this report since the focus of the work was to examine the LA. However, the relationship between LA size (LA-EDV and LA-ESV) and LVM was assessed (Fig. 3). The mean LVM values were found to be significantly raised in the LVHI group (68.5 g/m2) relative to the HV group (59.5 g/m2, P < 0.05), and approaching significance relative to the LVHD group (62.0 g/m2, P < 0.08), i.e. a similar pattern of change to that observed for the mean LA-EDV and LA-ESV measurements. For individual measures, the best correlation was found between LA-ESV and LVM for the HV group: R2 = 0.59; but equivalent correlations were reduced in both patient groups (R2 = 0.02 for LVHI, and R2 = 0.12 for LVHD). A similar pattern was evident between LA-EDV and LVM, with R2 = 0.31 for HV, R2 = 0.12 for LVHI, and R2 = 0.17 for LVHD. Better correlations were achieved between LV and LA measures for stroke volume (R2 = 0.40 for HV; 0.72 for LVHI; and 0.78 for LVHD), along with maximum chamber volumes (R2 = 0.67 for HV; 0.47 for LVHI; and 0.74 for LVHD). However, correlations were weaker when minimum chamber volumes were compared (R2 = 0.24 for HV; <0.01 for LVHI; and 0.46 for LVHD).
Relationship between mean LA-EDV, LA-ESV, and LVM values for the three groups studied. Significant changes (increases) were noted in the LVHI group for mean LA-EDV, mean LA-ESV, and mean LVM relative to the HV population.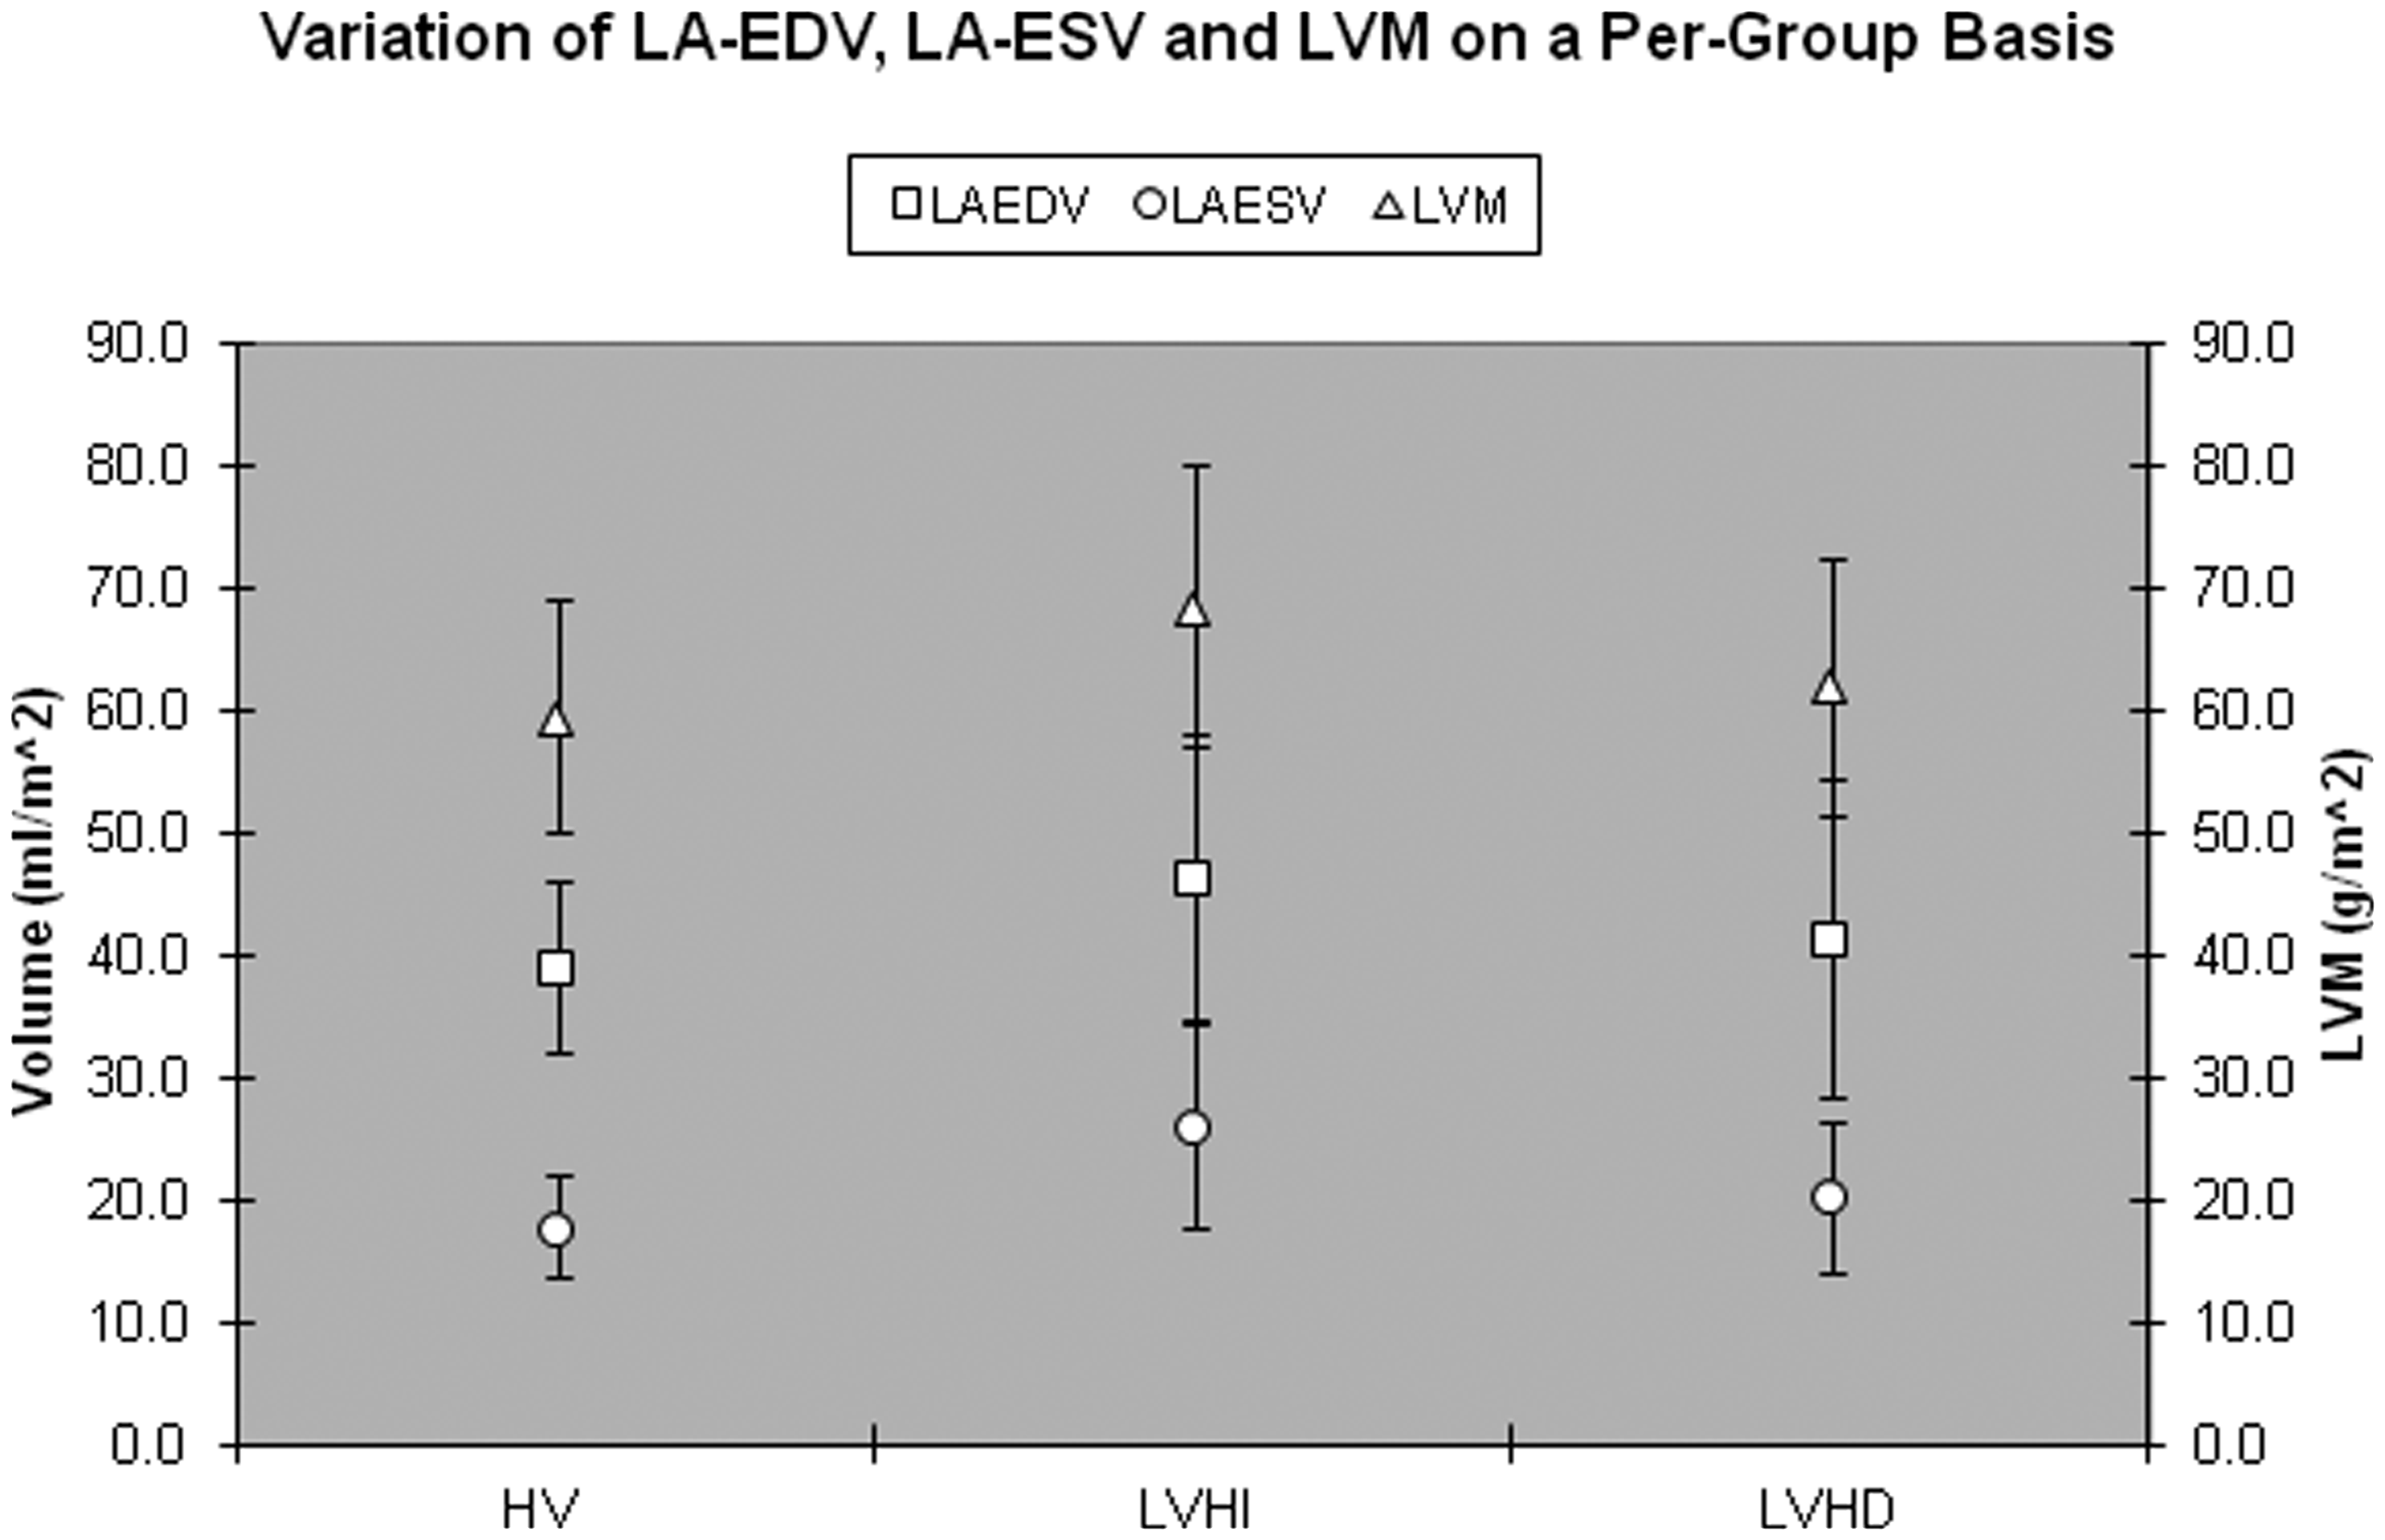
Discussion
In this study, we used a 3T MRI scanner to derive repeatable measures of LA structure and function when: (i) analyzed by single or multiple observers; (ii) acquired at single or multiple time-points; or (iii) derived from different study populations. With relatively easy LA boundary detection resulting in typical CoRs of 2–3 mL/m2, the measurements are stable, even when different time-points or observers are involved.
Differences in these LA parameters between the clinical and healthy volunteer groups have also been observed. Although of interest, clinical interpretation should be made with caution since the precise inclusion criteria for each group were different (e.g. age, gender, blood pressure matching). However, Maciera et al. (25) have described no clear association of LA volume with age and gender (when normalized to BSA) which is reassuring since it suggests that our LA volume differences could be reflective of cardiovascular change. A limitation of the work is that the size of each group (study “n”) is relatively small (although still larger than previously reported “sample size” calculations for CMR studies (36)). It would be interesting to examine further the effect of age and gender on much larger “population-based” cohorts as part of future work.
Previous investigations of the LA have almost exclusively utilized 1.5T machines, and we can only find two cases where 3T scanners have been described (20,26). Wen et al. (26) used 3T MRI for evaluating the LA in a cohort of patients with clinical indications for coronary CT. Their mean maximum LA volume by MRI was 46.2 +/− 9.7 mL/m2, which is similar to our LVHI group (46.4 +/− 11.6 mL/m2). Similarly, Hudsmith et al. (20) reported maximum LA volumes of 78 +/− 25 mL for a healthy volunteer group (n = 10 men) using 3T MRI with an SSFP sequence, which if corrected for body surface area (approximately 2 m2) results in similar data to our HV group (39.0 +/− 7.0 mL/m2). The above consistencies also suggest that similar data can be acquired on different scanners at different sites and with different vendors. This is encouraging from the perspective of larger multi-center studies, where consistency across different machines may be beneficial. A limitation of our work is that a direct comparison with 1.5T data acquired on the same participants was not undertaken. However, a report by Hudsmith et al. (20) stated that “field strength had no effect on LA volume and function assessment using either FLASH or SSFP,” suggesting that 1.5T and 3.0T can be used interchangeably.
Previous measurements of the LA have been acquired in the 2ch, 4ch, SA, or axial plane, with the SA orientation (“extension” of an LV assessment) being the most common. However, it is difficult to identify the LA at the mitral valve in this plane, so we used the 2ch orientation (clearer view of the mitral valve plane) as recommended initially by Jarvinen et al. (12). Our choice of slice coverage every 5 mm was generally successful, providing clear LA boundaries and no significant partial volume difficulties. However, it does require the volunteer/patient to remain absolutely still to ensure that each image slice corresponds to the correct anatomy. A complete LA acquisition took typically 5 min to complete. The use of 3T was chosen because of the potential to utilize the “additional signal” to acquire data faster (i.e. more “slices per breath-hold”) using more parallel imaging and thinner image slices. However, some extra time was required for patient-specific targeted shimming in order to minimize resonance-offset and flow-related artifacts. For data analysis, the time taken for completion of a typical LA segmentation was about 15 min. We acknowledge that quicker methods are available, such as those that use the biplane area-length method for deriving LA volume. However, these methods rely upon geometric assumptions which may be less valid for cohorts with CVD where atrial remodeling has taken place.
In conclusion, this pilot study has demonstrated that 3T MRI-derived measurements of LA structure and function are reproducible and able to distinguish differences between the healthy individuals and patient groups. These LA endpoints are anticipated to provide a useful aid for future clinical interpretation of LA structure and function, and may also improve longitudinal investigations where consistency between “baseline” and “follow-up”’ examinations is paramount.
Footnotes
Declaration of conflicting interests
The author(s) declared no potential conflicts of interest with respect to the research, authorship, and/or publication of this article.
Funding
The author(s) disclosed receipt of the following financial support for the research, authorship, and/or publication of this article: We would like to acknowledge the financial support of: (i) the Medical Research Council (MRC) for the LVHI study; and (ii) Diabetes UK for the LVHD study.
Acknowledgments
The authors would like to acknowledge: (i) the assistance of the MRI radiographers who have participated in the study; (ii) Mrs Norma Gourlay for her assistance with patient and volunteer bookings, and (iii) the patients and volunteers who kindly gave their time to be scanned.