
Abstract
Background
Recently, magnetic resonance imaging (MRI) has been established as an effective technique for evaluating iron overload by measuring T2* in the liver.
Purpose
To investigate the effects of various factors associated with T2* calculation on the resulting measurement and to determine the analysis criterion that provides the most accurate T2* measurements.
Material and Methods
Both phantom and in vivo MRI experiments were conducted to study the effects of the selected region of interest (ROI) location and size, signal-averaging method, exponential-fitting model, echo truncation, iron-overload severity, and inter-/intra-observer variabilities on T2* measurements. The results were compared to reference values from the scanner processing software.
Results
The pixel-by-pixel calculation method provided results in better agreement with the reference values from the MRI scanner than the average or median methods. The choice of the exponential fitting model affected the results, depending on signal-to-noise ratio, number of echoes, minimum and maximum echo times, and tissue composition inside the selected ROI. The single-exponential model resulted in smaller error than the bi-exponential or exponential-plus-constant models, where the latter two models showed similar results. The relative performance of the different models and methods was not affected by the degree of iron-overload.
Conclusion
Various factors associated with the adopted T2* calculation method affect the resulting measurement. In this study, the pixel-by-pixel calculation method and single-exponential model provided the most accurate results based on the conducted phantom and in vivo MRI experiments.
Introduction
Iron toxicity is the main reason for tissue damage and organ failure in patients with iron overload (1,2). Accurate evaluation of iron overload is critical for prompt initialization of chelation therapy to minimize, and even reverse, its effects. Although liver biopsy is the gold standard for quantifying hepatic iron contents, the technique’s invasiveness, high cost, and influence by the sampling error preclude its widespread use (3). Recently, magnetic resonance imaging (MRI) has been considered for evaluating iron overload, which showed to be correlated with reduced tissue T2* values (4,5). By acquiring a number of T2*-weighted (T2*W) images at different echo times (TE), the signal intensity of the tissue of interest could be plotted against TE, from which T2* (measured in ms), and its inverse R2* = 1000/T2* (measured in 1/s), can be calculated (6–8).
T2* is estimated by fitting the signal intensities acquired at multiple TEs to an exponentially decaying curve. Although the analysis process is conceptually straightforward, there are a number of factors associated with the calculation method that could affect the resulting T2* value, including the choice between pixel-wise and region of interest (ROI) analysis methods, location of the selected ROI for analysis and whether it includes vascular structures or not, selected data fitting model, and number and values of TEs at which signal intensity is measured. The ROI-based techniques could be classified into three categories: pixel-wise (PIXEL), where exponential fitting is applied to each pixel inside the ROI, followed by obtaining the mean value of the resulting T2* measurements; average (AVG), where the average signal intensity inside the ROI is first calculated, followed by exponential fitting of the resulting values acquired at different TEs; and median (MED), where the median signal intensity inside the ROI is first calculated, followed by exponential fitting of the resulting values acquired at different TEs. On the other hand, the curve fitting model could be classified as (9–12): bi-exponential decaying model (BI-EXP, equation 1); single-exponential decaying model (SNGL-EXP, equation 2); or exponential-plus-constant model (CNST-EXP, equation 3). In the following equations, S and S0 represent signal intensity and its initial value at TE = 0 ms.


In this study, we hypothesize that the method by which T2* is calculated and the particular selection of the aforementioned parameters in the analysis model affect the resulting measurement. The purpose of this study was therefore to investigate the effects of the factors associated with data analysis on T2* measurements and determine the analysis criterion that provides the most accurate measurements based on phantom and in vivo MRI experiments.
Material and Methods
Phantom and patient scans
Calibrated phantoms with pre-determined amounts of iron were created (Fig. 1) to compare the T2* values calculated by different analysis techniques to the ground truth known amount of iron concentration. Ten 50-mL vials were filled with agarose-based material doped with MnCl2 to create a material with T1 and T2 values similar to those in the liver, as previously described (8). Different amounts of iron sulphate were added to nine vials (the 10th vial was used as a reference with no iron), in the range of 0.5–4.5 g in equal increments, which resemble the range of iron content in the clinical setting. The phantoms were imaged on a 3.0 T Siemens Skyra MRI scanner (Siemens Healthcare, Erlangen, Germany) using a 12-element phased-array coil and 12-echo T2*W GRE sequence with TEs in the range of 1–16.5 ms in equal increments. The imaging parameters were: repetition time, 200 ms; matrix, 256 × 192; bandwidth, 1776 Hz/pixel; flip angle, 20°; slice thickness, 10 mm; and scan time, 15 s (for all 12 echoes using segmented, multi-echo data acquisition). Eleven human participants with different stages of sickle cell disease (7 men, 4 women; age, 35 ± 13 years) were imaged after obtaining informed consent in this IRB-approved study. The participants were scanned on the same scanner and using the same imaging protocol as in the phantom experiments, where a mid-liver axial slice was acquired in a single end-expiration breath-hold.
The phantom (a) and T2* map measured from the scanner (b).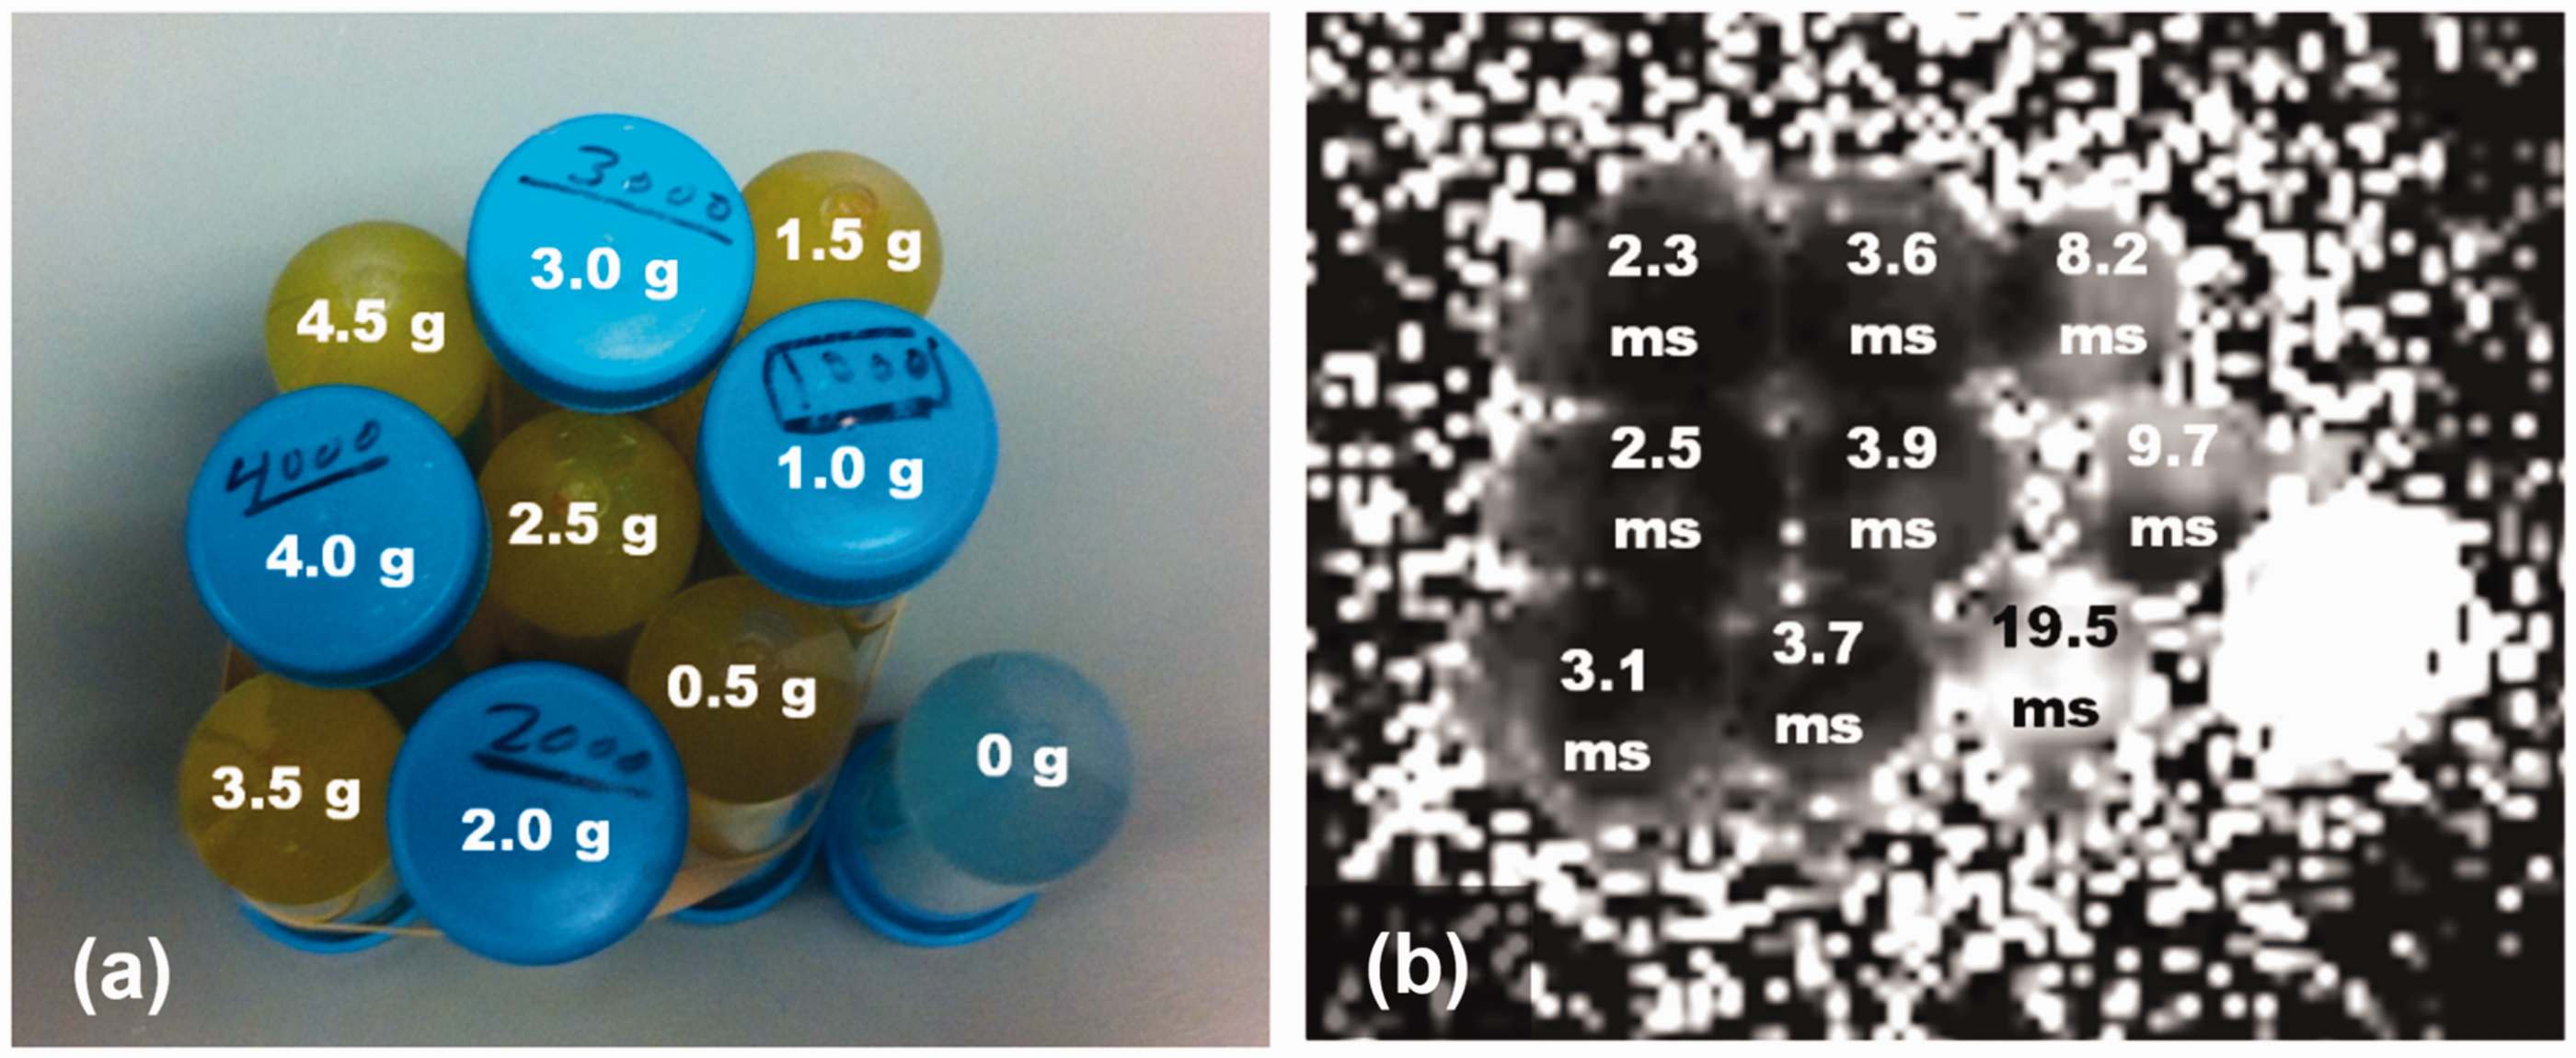
Data analysis
The images were analyzed using the T2* mapping software on the scanner (which uses the SNGL-EXP model and PIXEL method for T2* calculation), where a circular ROI of about 4 cm2 was selected at the center of the vials’ cross-sections and inside the liver’s right lobe away from vasculature. An in-house software was created in Matlab 2014 (MathWorks, Natick, MA, USA) to analyze the images while modifying the factors that could affect the resulting T2* measurement (Fig. 2), specifically the signal averaging method (PIXEL, AVG, and MED); exponential fitting model (SNGL-EXP, BI-EXP, and CNST-EXP) using the Levenberg–Marquadt algorithm; ROI size (4 cm2 and 2 cm2); ROI location (in the right or left lobe); vascular inclusion (by shifting the ROI to include hepatic vasculature); edge effect (by moving the ROI close to the liver boundary); data truncation (the effect of removing the datapoints at the longest TEs that deteriorate the exponential fitting based on visual assessment); and the effect of the degree of iron overload on the exponential fitting model and signal averaging method (based on grouping the phantom/liver images into two groups of normal and iron-overload, where a cutoff value of about 10 ms was used to differentiate between the two groups, in accordance with the literature values of T2* at 3.0 T) (8). Two cases in the in vivo scans resulted in erroneous T2* values (about an order of magnitude higher than the upper range of normal values) when examining the effects of edge and vascular analysis; therefore, these measurements were excluded from the analysis. Correlation analysis, regression analysis, and error measurement were conducted to examine the effects of different factors on T2* measurements compared to those obtained from the scanner mapping. The ROI method was fixed to PIXEL when comparing different exponential fitting models, and the exponential fitting model was fixed to SNGL-EXP when comparing different ROI selection methods. Finally, the analysis of the liver images was conducted by two users to examine the inter- and intra-observer variabilities and the effect of ROI selection on the measured T2* values using different analysis methods (PIXEL, AVG, and MED).
Locations of different ROIs used for calculating T2* in patients with light (a) and heavy (b) iron overload.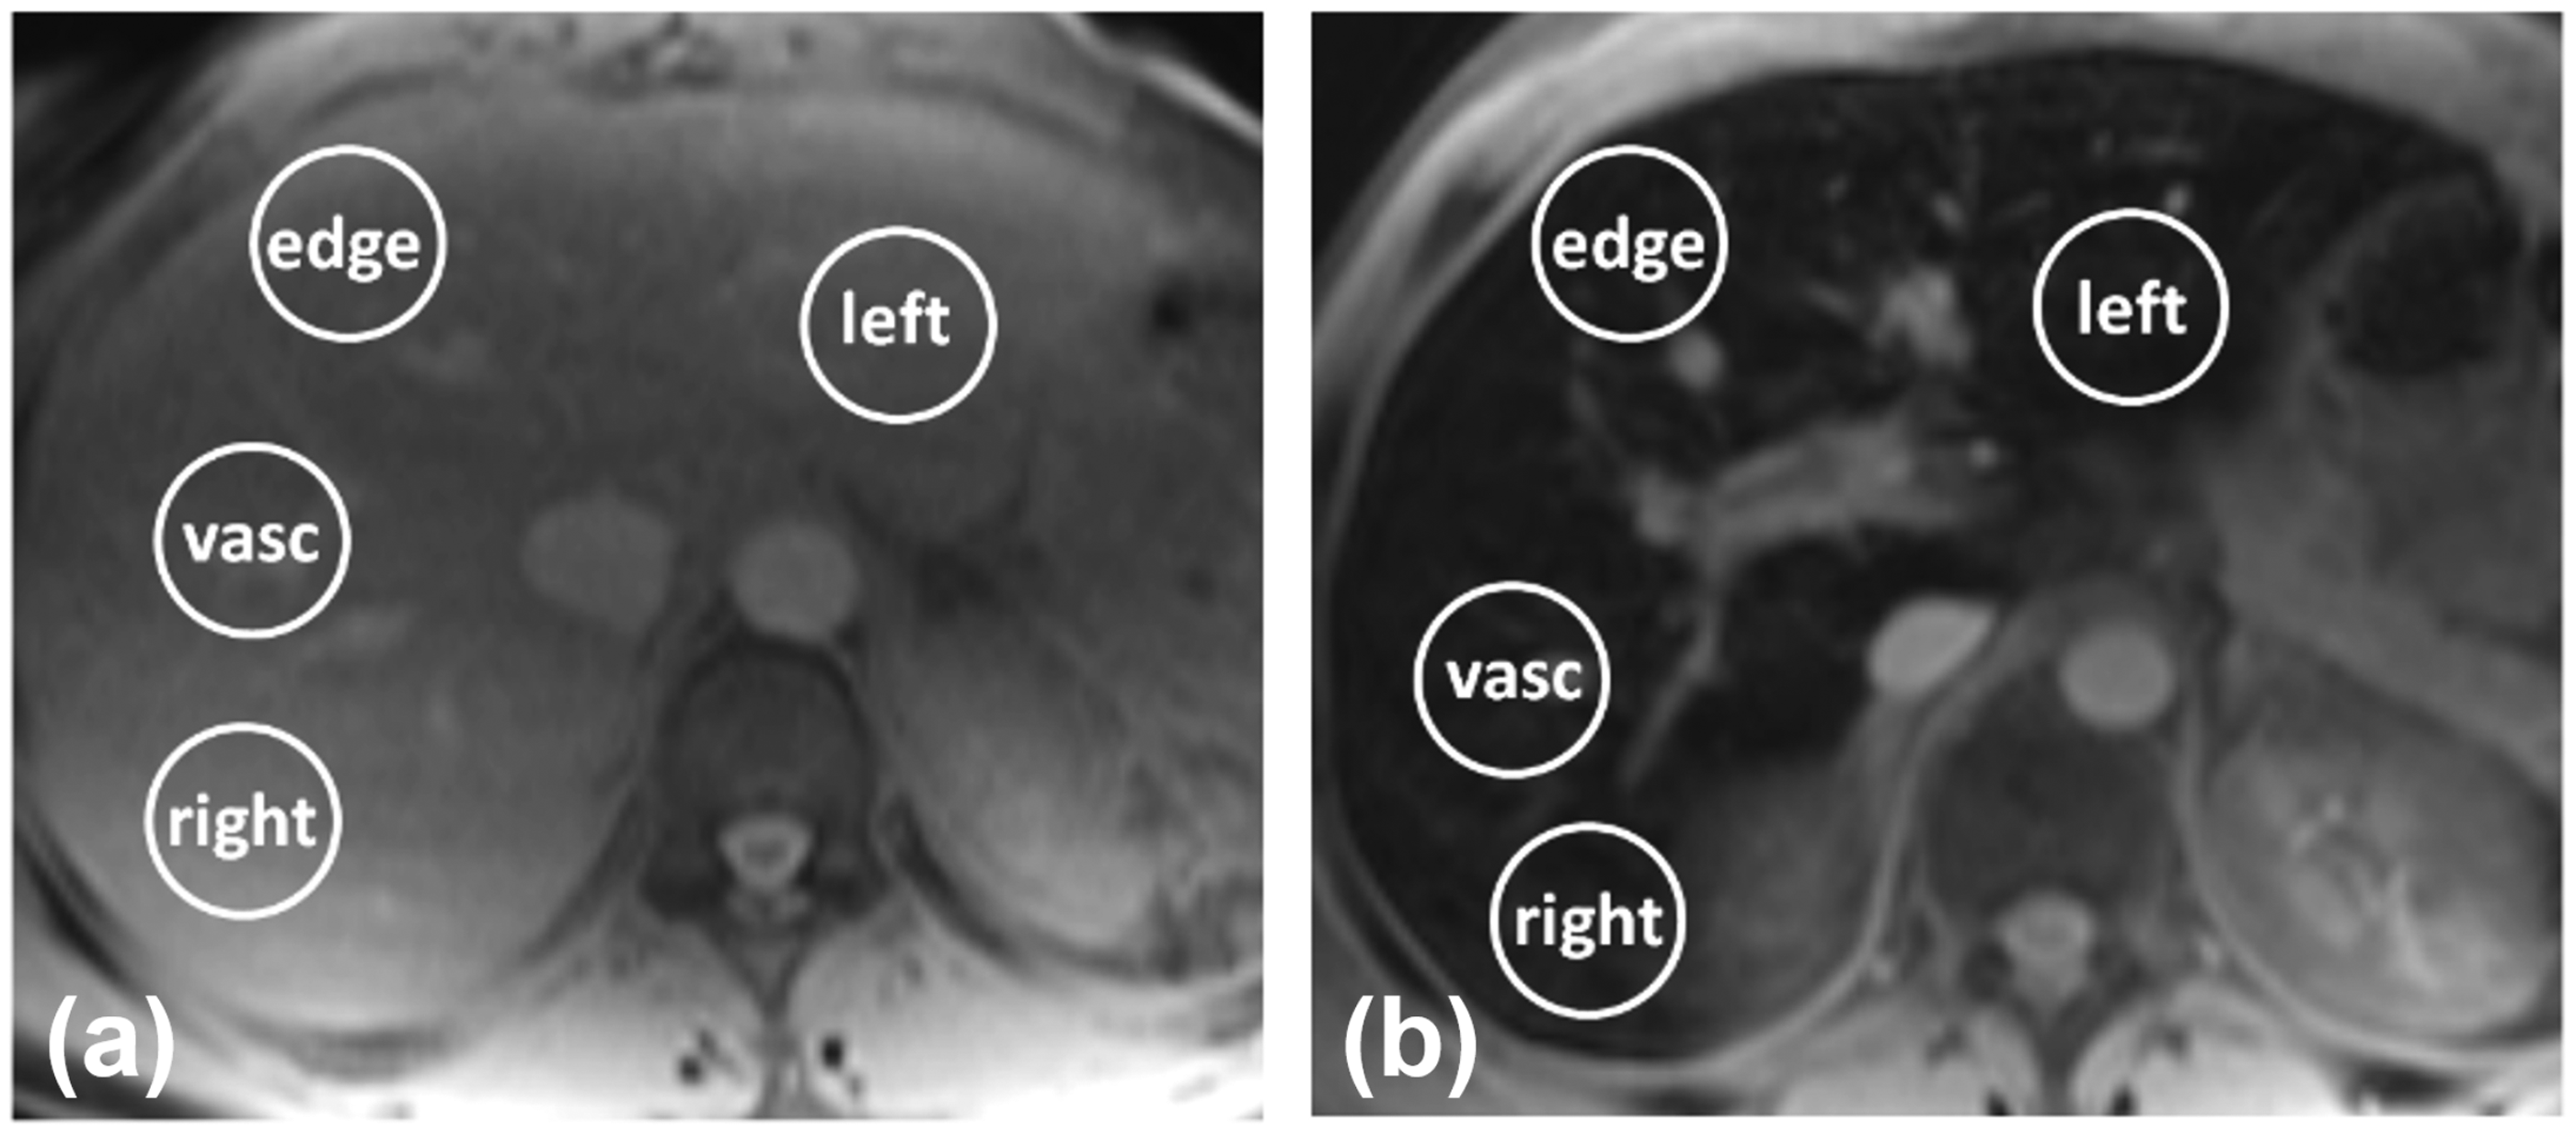
Results
Phantom results
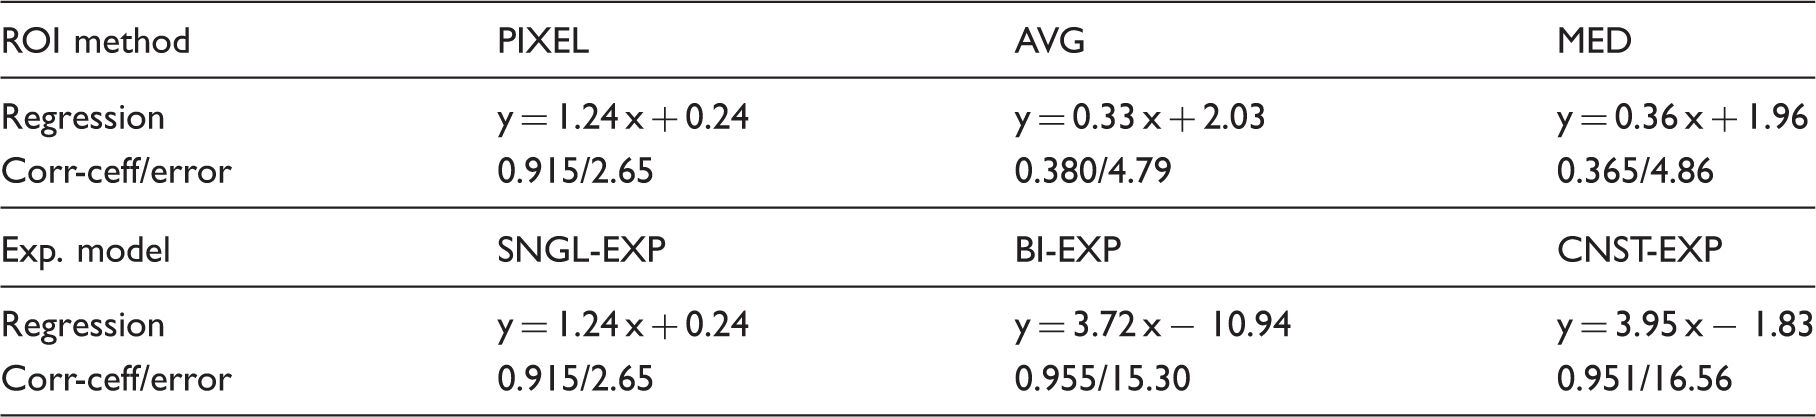
T2* was in the range of 2.3–19.5 ms for iron contents from 4.5 to 0.5 g, respectively. The R2* values measured using the scanner software showed good linear relationship with iron content: R2* = 1.90 × iron + 12.56; correlation coefficient = 0.98. When comparing the T2* values calculated by the different analysis techniques to the T2* values measured using the scanner software (Fig. 3, Table 1), the SNGL-EXP model combined with the PIXEL method (SNGL-EXP + PIXEL) and the BI-EXP model combined with the AVG method (BI-EXP + AVG) provided the best agreements, followed by the CNST-EXP + AVG; BI-EXP + MED; and CNST-EXP + MED analysis techniques. The remaining techniques resulted in obvious erroneous values, especially for small iron contents.
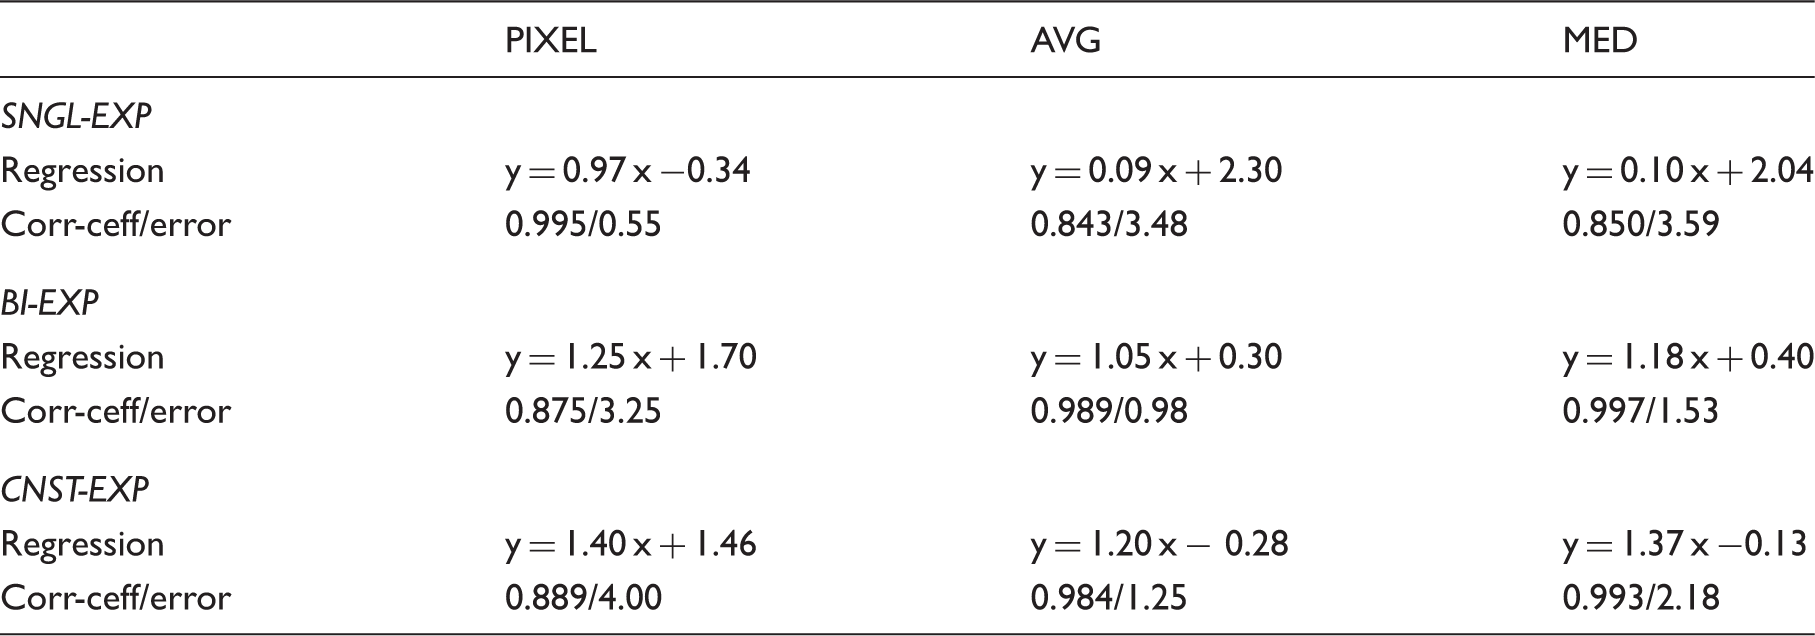
The effect of signal averaging on T2* calculation in the phantoms. The SNGL-EXP model is used and the measurements were compared to the results from the scanner. The PIXEL method (a) results in better agreement with the reference scanner measurements, compared to the AVG method (b). Correlation coefficient, average absolute error, and regression analysis between the T2* measurements in the phantoms using different exponential data fitting models and ROI selection methods, and those from the scanner.
Patient results
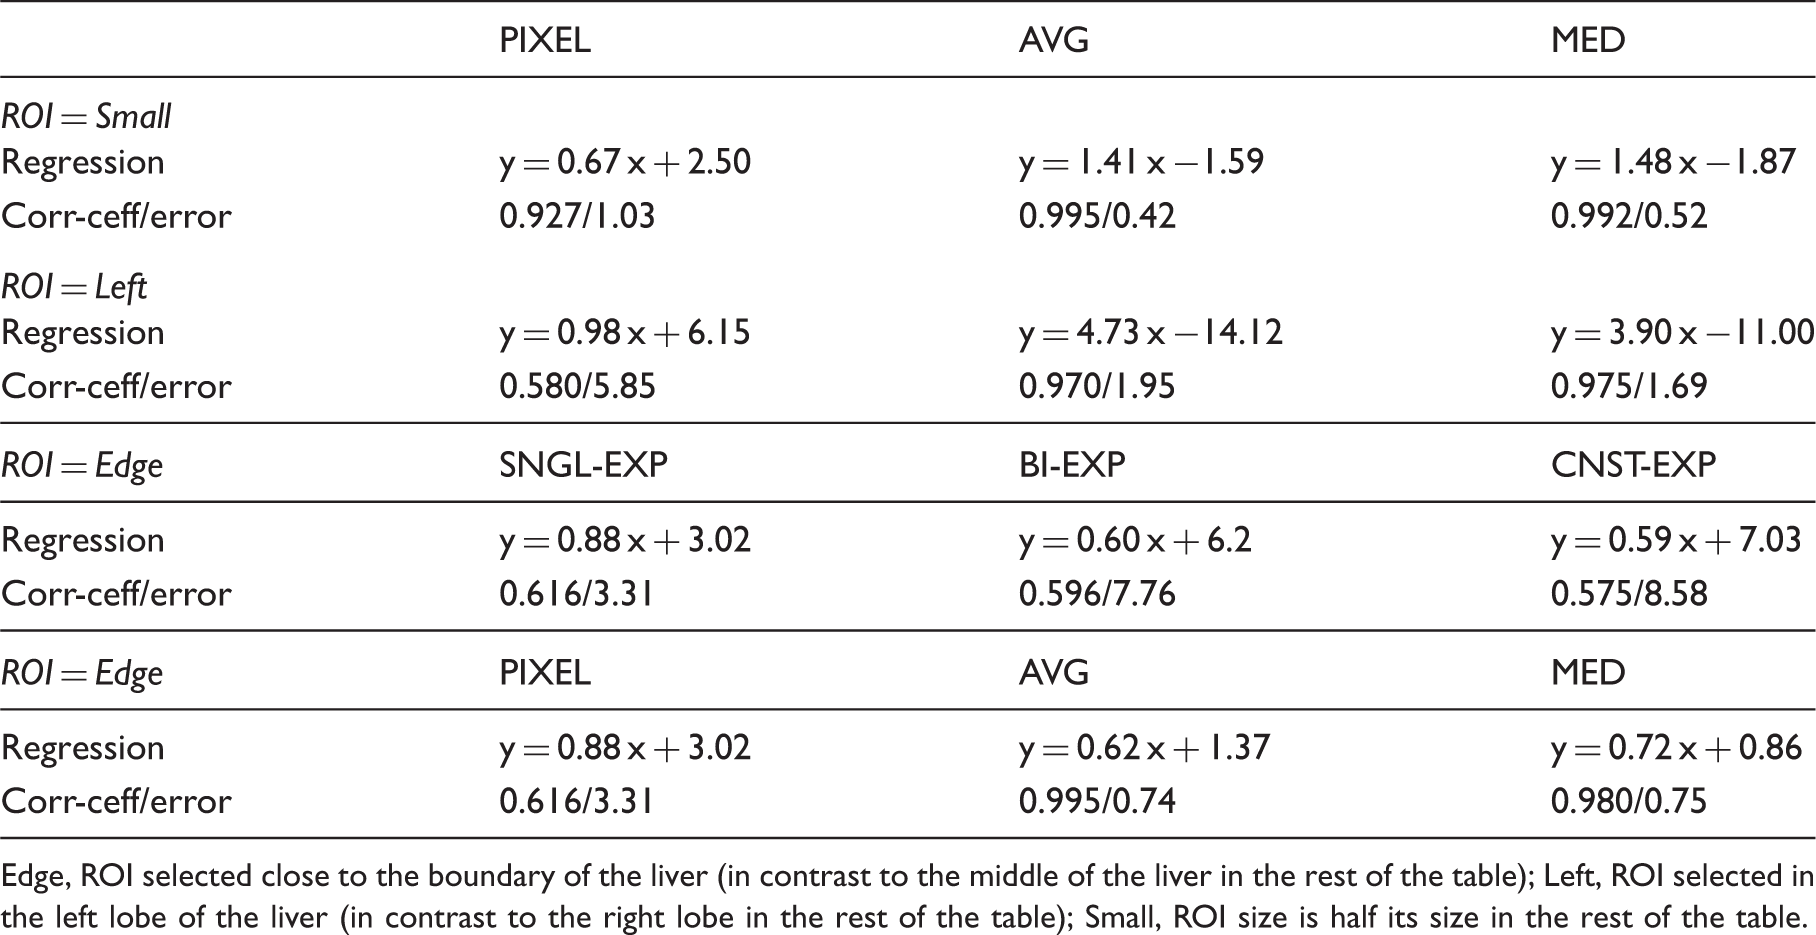
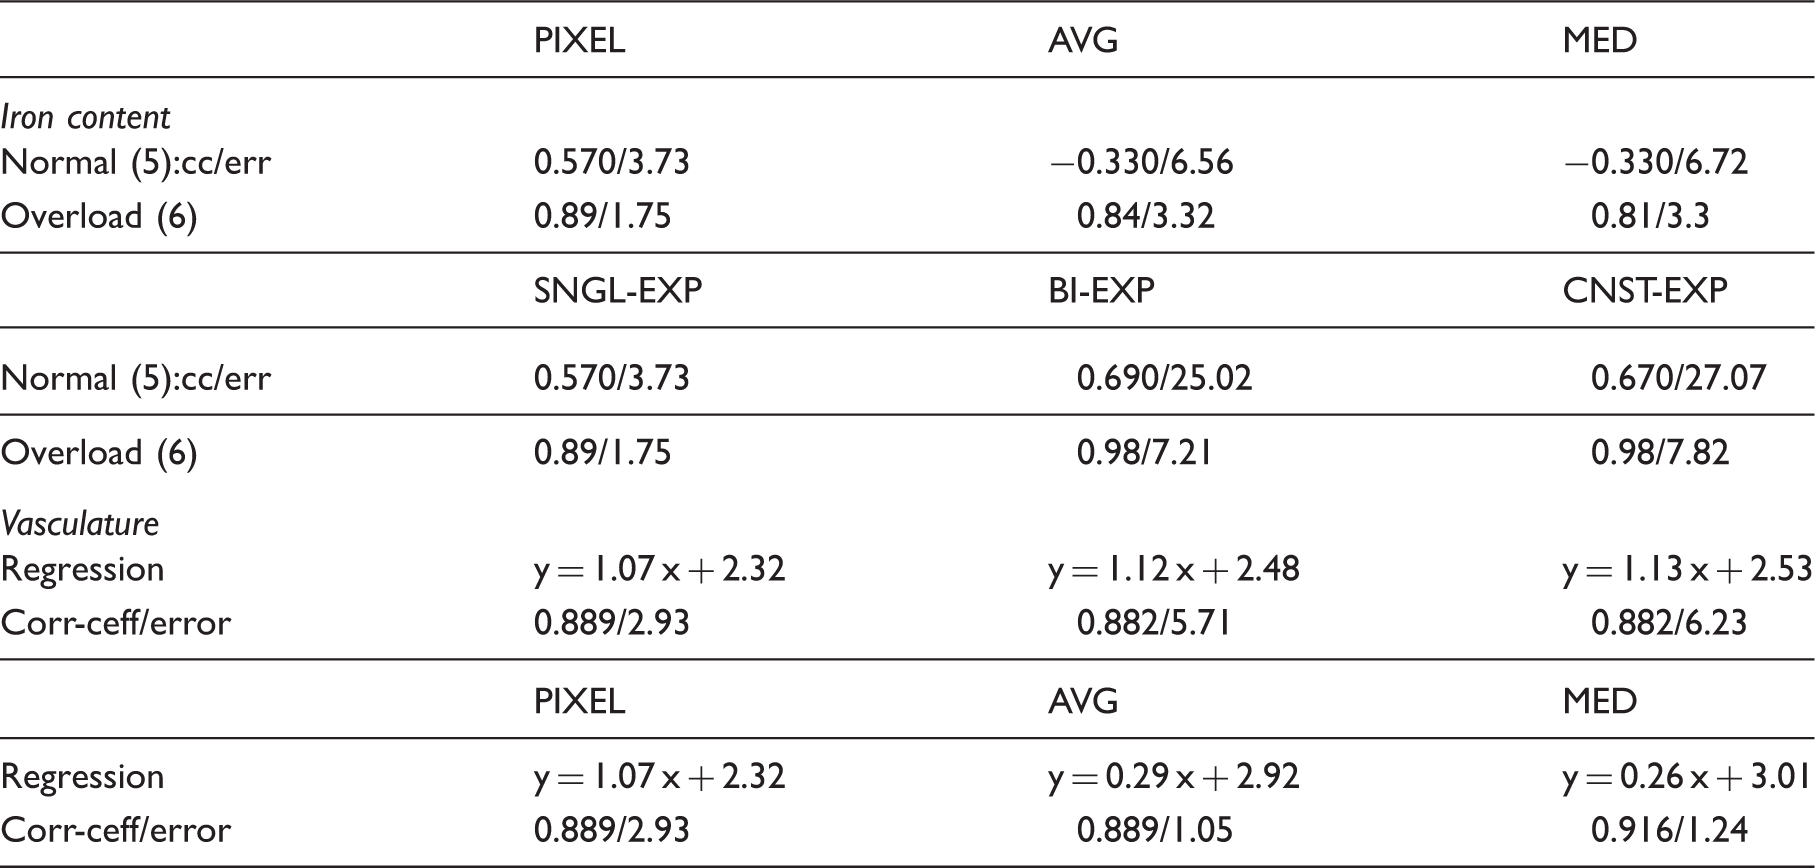
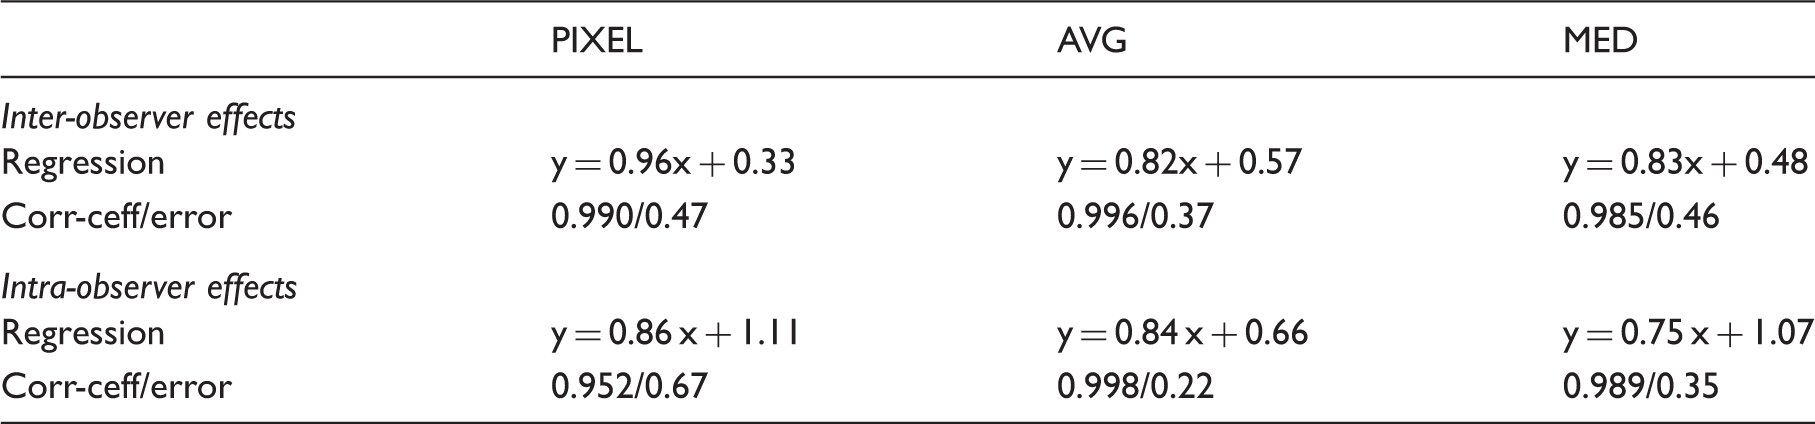
T2* was in the range of 4.2–16.2 ms. The average absolute errors, correlation coefficients, and regression equations between the measurements from different analysis techniques are shown in Tables 2–5. Overall, the SNGL-EXP model and PIXEL method resulted in close results with the reference values obtained using the scanner mapping software (Fig. 4). This superiority was maintained in both groups of normal and overloaded iron contents, with the latter group showing better agreement. The results showed differences in T2* measurements based on the size and location of the selected ROI. The AVG and MED methods showed similar performance in terms of measurement error and regression analysis. Both the AVG and MED methods showed less sensitivity to changes in the ROI size, location, inclusion of vasculature, and proximity to the liver boundary than did the PIXEL method (the PIXEL method resulted in error that is about double of that produced by the AVG and MED methods). Regarding exponential fitting, the SNGL-EXP model was less affected (measurement error was reduced by 50%) by changes in the selected ROI than was the CNST-EXP and BI-EXP models. The inter- and intra-observer analyses showed excellent agreements, with the largest agreement occurring with the AVG, followed by MED, and then PIXEL methods. Truncating the largest echoes in the data before fitting to the SNGL-EXP model did not result in significant differences in T2* measurements: correlation coefficient between the measurements before and after truncation = 0.932 (P = 0.473).
The effect of the exponential data fitting model and signal averaging method on T2* calculation in the patients with respect to measurements from the scanner. The SNGL-EXP model and PIXEL method (a) provide better agreement with the reference scanner measurements compared to the BI-EXP model (b) and AVG method (c). The effects of ROI selection method and exponential data fitting model on T2* measurements, represented by the correlation coefficient, average absolute error, and regression analysis between the results from different analysis criteria and those from the scanner. The effects of ROI size and location on T2* measurements based on the adopted exponential model and averaging method in the analysis, represented by the correlation coefficient, average absolute error, and regression analysis between the results from different analysis criteria and those from the scanner. Edge, ROI selected close to the boundary of the liver (in contrast to the middle of the liver in the rest of the table); Left, ROI selected in the left lobe of the liver (in contrast to the right lobe in the rest of the table); Small, ROI size is half its size in the rest of the table. The effects of iron content (normal/overload) and vasculature inclusion in the ROI on T2* measurements, represented by the correlation coefficient, average absolute error, and regression analysis between the results from different analysis criteria and those from the scanner. Inter- and intra-observer effects on T2* measurements, represented by the correlation coefficient, average absolute error, and regression analysis between the results from different analysis criteria and those from the scanner.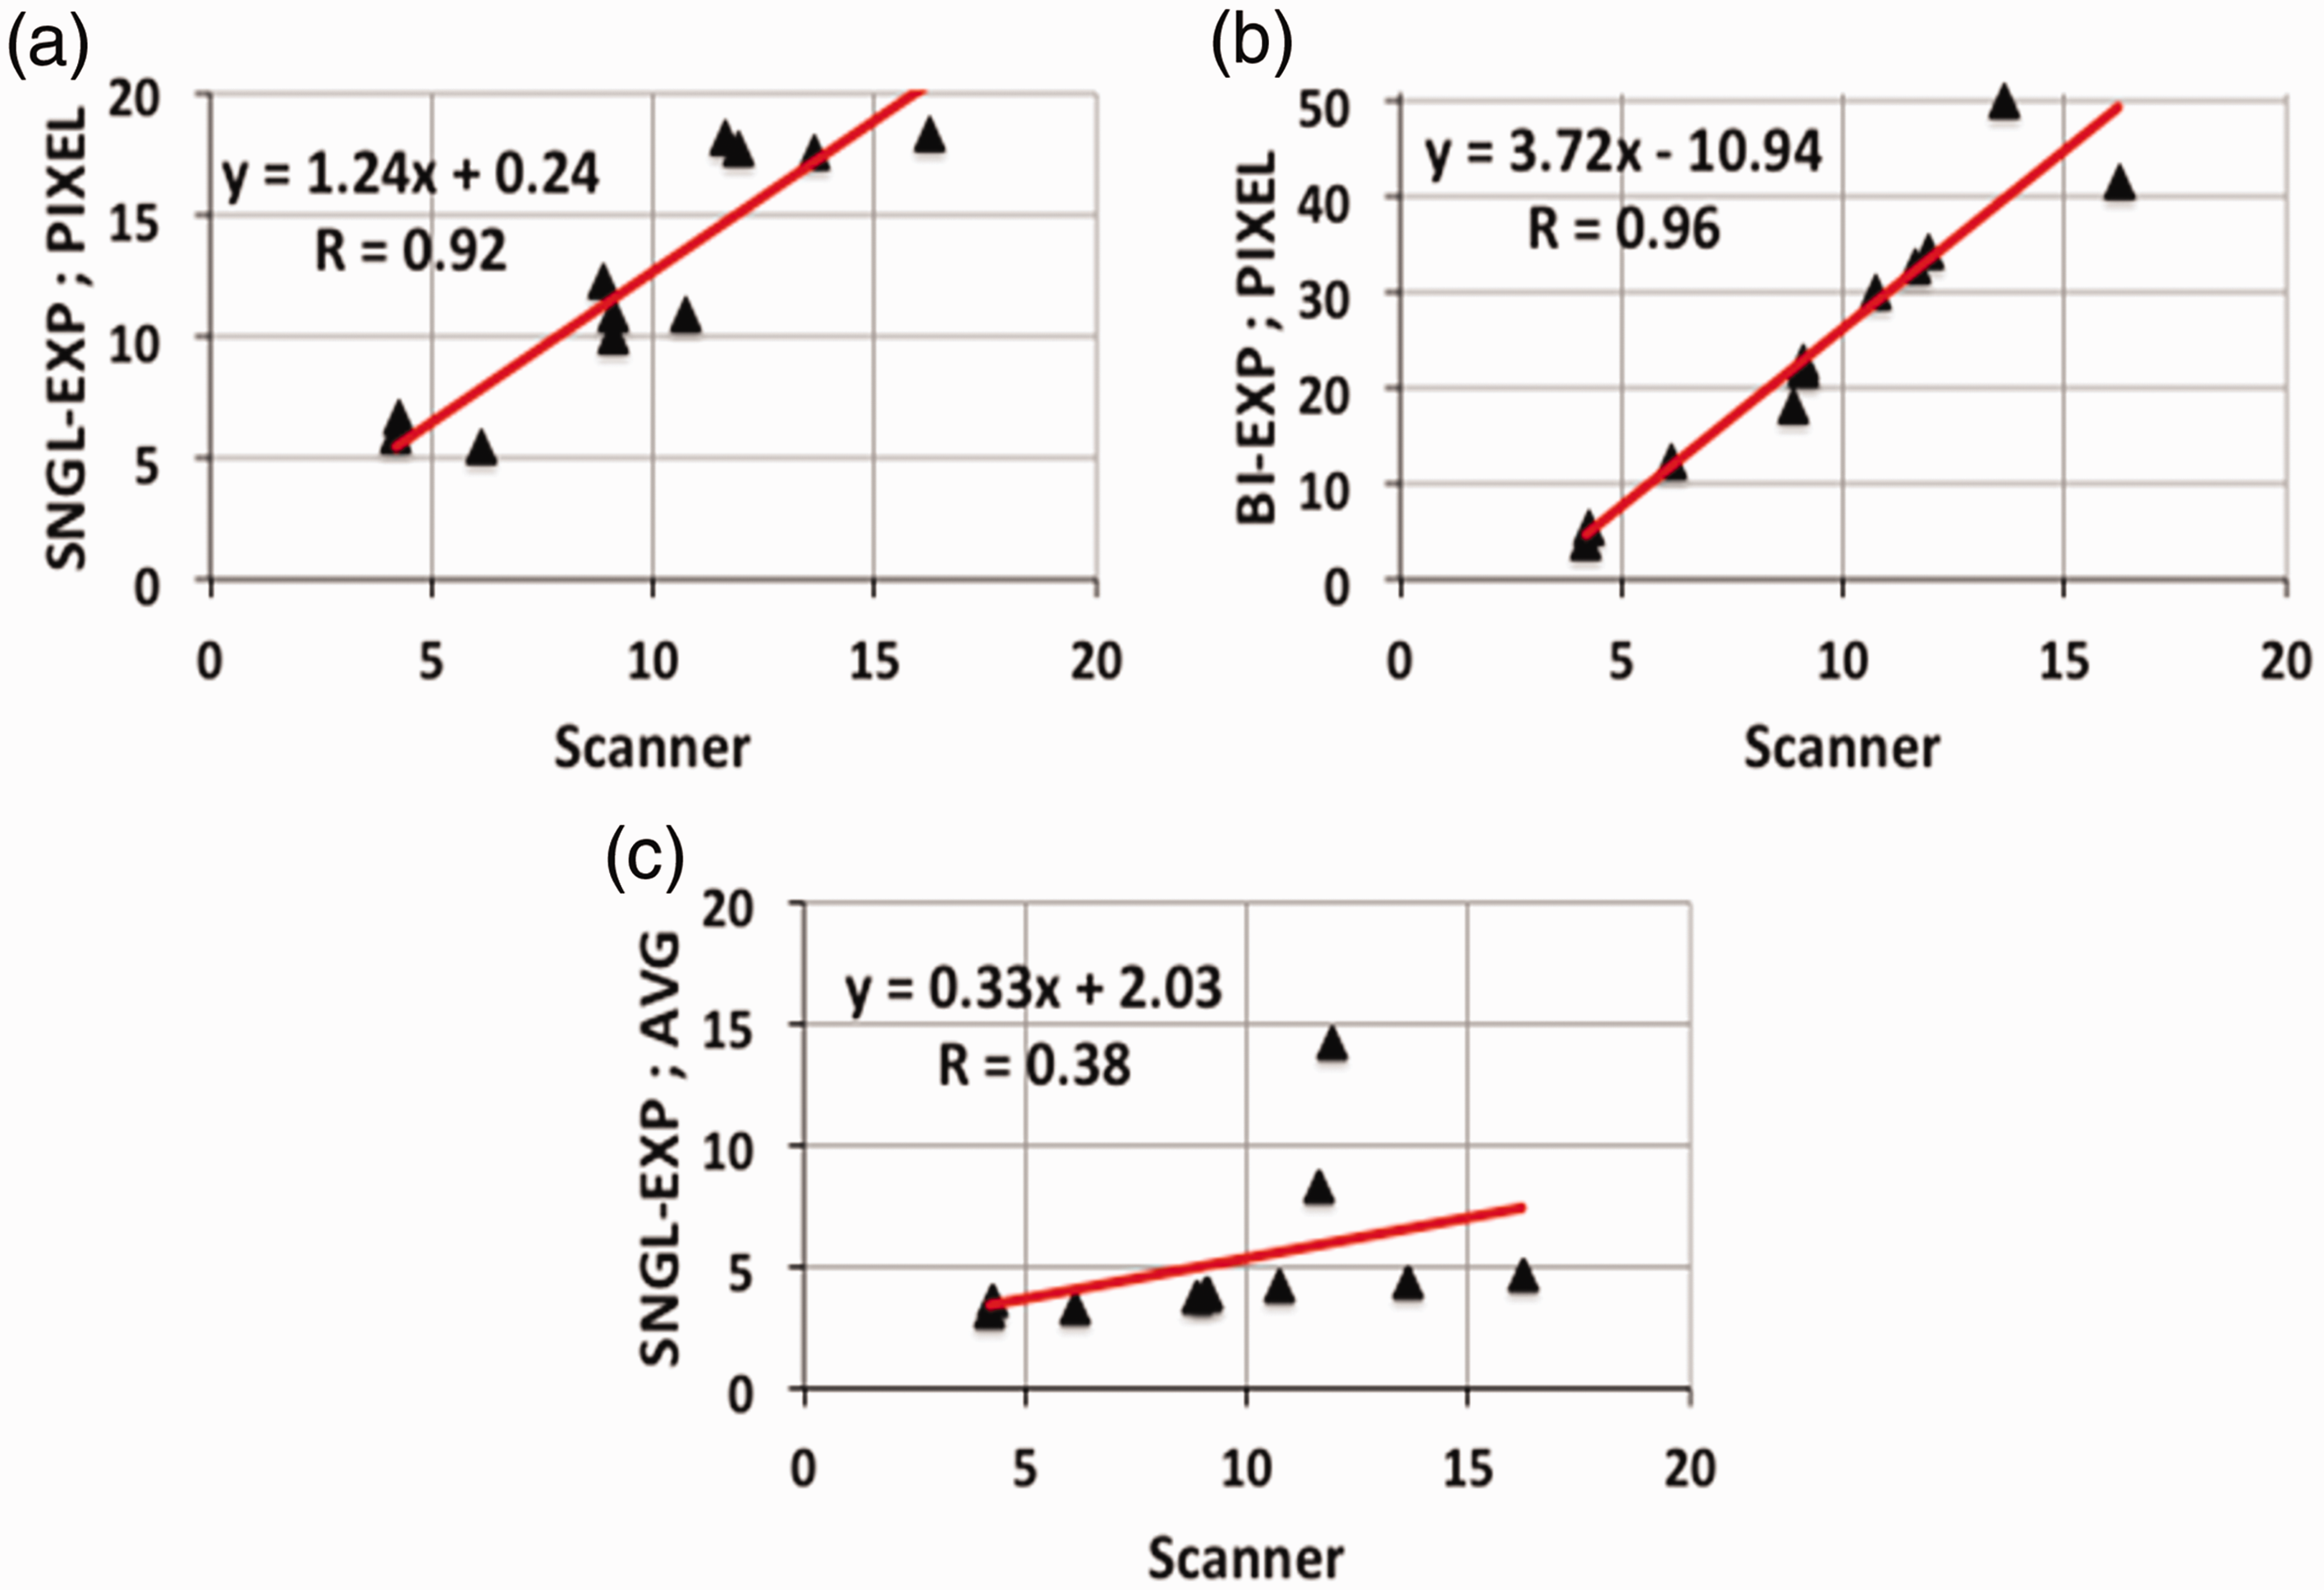
Discussion
T2* measurement with MRI has been established as an effective technique for non-invasive assessment of iron overload in the liver (9,13,14). However, the data analysis criterion adopted for T2* calculation plays a crucial role in determining the resulting measurement. Basically, T2* could be affected by the imaging sequence, imaging parameter settings, slice position, number and timing of the acquired signals, adopted exponential fitting model, ROI selection, and method of signal averaging. It has been shown that the amount of error in measuring T2* using MRI could be of a similar magnitude to the error in evaluating iron overload using liver biopsy (13). For example, the ROI-based analysis techniques generally tend to underestimate large T2* values due to low contrast between parenchyma and vessels (9). However, this bias has little effect on the results interpretation as large T2* values do not belong to the clinical range of interest.
Different exponential data fitting models have been used in the literature with different degrees of success. Typically, a large ROI of homogeneous signal intensity is selected inside the liver away from vascular structures, inside which the mean signal intensity is measured and plotted against TE. T2* is then calculated by fitting the results to a SING-EXP (5,11,15), BI-EXP (16), or CNST-EXP model (13,17). Other studies used more than one ROI for measuring T2* (9,14,18). For example, Maris et al. (18) used two ROIs extracted from two orthogonal slices in the liver, where the mean signal intensity inside each ROI was calculated at different TEs, and the CNST-EXP model was then implemented on each dataset to measure T2*. The final T2* was calculated as the average of the resulting two T2* values. Melony et al. (14) evaluated the effectiveness of using a single ROI for measuring hepatic T2* compared to measuring T2* inside the whole liver. The authors divided the liver into eight functionally independent segments and measured T2* in a ROI inside each segment, where the results showed that the single-ROI approach provided reliable values for evaluating hepatic iron overload in six out of the eight segments, provided that the ROI’s are selected away from susceptibility artifacts and vasculature.
The performance of the different exponential data fitting models has been evaluated in different studies. It has been shown that, except for very small T2* values, the SING-EXP model provides clinically accepted results for evaluating iron overload, despite a slight constant overestimation over the whole T2* range (9). Although the BI-EXP model showed a very good performance, erroneous results occur for large T2* values due to data overfitting, or when insufficient data points are available for the curve fitting. The CNST-EXP model is generally simpler and more precise than the BI-EXP model, especially for pixel-wise T2* measurements.
In the present study, the PIXEL method provided results in better agreement with the reference values from the MRI scanner than did the AVG or MED methods. Nevertheless, the AVG and MED methods were less sensitive to changes in the selected ROI. The choice of the exponential data fitting model affected the results based on several factors, including the image SNR, number of data samples (echoes), minimum and maximum TE values, and tissue composition inside the selected ROI (9,10,14). Generally, the SNGL-EXP model resulted in smaller error compared to the BI-EXP or CNST-EXP model, where the latter two models showed similar results in most cases. The close results between the BI-EXP and CNST-EXP models could be explained by noting that the CNST-EXP model can be considered as an approximation of the BI-EXP model, where the tissue with large T2* (usually representing vasculature) is replaced by a constant. Finally, the relative performance of the different models and methods for calculating T2* was not affected by the degree of iron overload.
The current study has some limitations. First, no liver biopsy was performed on the patients, which is the ground truth against which the iron content assessed by T2* measurement could be compared. Nevertheless, the calibrated phantom experiments served as the ground truth for validating the developed imaging protocol in our study. Another limitation of the current study is the limited number of studied patients. Therefore, the encouraging results in this study require conducting further research on a larger number of patients with wider ranges of iron overload and known pathology to confirm these results to determine the optimal method for evaluating iron overload in different diseases and patient groups. Finally, the capabilities of newly developed MRI sequences, e.g. the ultra-short echo time (UTE) sequence which allows for acquiring TE on the order of microseconds, should be investigated for quantifying iron content in patients with heavy iron overload, which is a challenging task to be conducted using standard imaging sequences due to the very rapid decay of the received MR signal.
In conclusion, T2* measurement with MRI is a promising technique for evaluating iron overload in the liver. Various factors associated with the adopted calculation method affect the resulting T2* measurement. In this study, the PIXEL method and SNGL-EXP model provided the most accurate results based on the conducted phantom and in vivo experiments.
Footnotes
Declaration of conflicting interests
The author(s) declared no potential conflicts of interest with respect to the research, authorship, and/or publication of this article.
Funding
The author(s) received no financial support for the research, authorship, and/or publication of this article.