
Abstract
Background
Length of capsular contact (LCC) is a promising biomarker for predicting extracapsular extension (ECE), but the most optimal magnetic resonance imaging (MRI) sequence for measuring LCC is yet to be determined.
Purpose
To evaluate LCC using different MRI sequences for determining ECE in prostate cancer.
Material and Methods
A total of 185 patients underwent prostate MRI followed by radical prostatectomy. LCC was measured separately on T2-weighted (T2W) images, apparent diffusion coefficient (ADC) maps, and dynamic contrast-enhanced (DCE) MRI. LCCs (LCCT2, LCCADC, LCCDCE, and LCCmax [greatest value of 3 LCCs]) were compared between sequences using Wilcoxon signed rank test and was tested for determining ECE using the Mann–Whitney U test, ROC curve analysis, and logistic regression analysis.
Results
There were no significant differences among LCCs (P = 0.333–0.837). All LCCs were significantly greater in patients with ECE (P < 0.001). The optimal threshold value for predicting ECE was >14, >13, >12, and >14 mm for LCCT2, LCCADC, LCCDCE, and LCCmax, respectively. LCCmax yielded the highest area under the curve (0.895) which was significantly greater than that by LCCADC (0.858, P = 0.030). Otherwise, there were no significant difference between LCCs (P = 0.052–0.985). At univariate analysis, age, clinical stage, PSA, Gleason score, and all LCCs were significantly associated with ECE (P < 0.001–0.040). At multivariate analysis, GS (P ≤ 0.008) and all LCCs (P < 0.001) were independently predictive factors.
Conclusion
LCC measured on any sequence was significantly different in patients with and without ECE and was independently associated with the presence of ECE. Although LCCmax showed the greatest ability to predict ECE, there was relatively equivalent performance among different MRI sequences.
Introduction
Patients with localized prostate cancer are commonly treated with radical prostatectomy (RP). As the primary objective is cancer control, this is justified by well-known evidence that RP results in significantly higher cancer-specific survival compared with conservative management (1). However, many patients who receive RP may experience critical complications that hamper the quality of life, such as erectile dysfunction. As a result, neurovascular bundle-sparing procedures are gaining popularity among patients and urologic oncology surgeons (2). When considering whether to spare or resect the neurovascular bundle, it is critical to assess the presence of extracapsular extension (ECE). ECE is not only found in a significant number of patients with clinically localized prostate cancer, but is associated with biochemical recurrence after RP (3,4). Therefore, the ability to preoperatively identify patients with ECE would have an enormous impact on selecting the proper management of patients with prostate cancer in terms of balancing between optimal cancer control and preservation of potency.
Magnetic resonance imaging (MRI) has been widely assessed as a modality in predicting ECE, however, with inconsistent results (5). This is largely attributed to the subjective nature of MRI interpretation due to qualitative criteria (i.e. bulging of the capsule and asymmetry of the neurovascular bundle) evaluating the capsule on T2-weighted (T2W) imaging (6). This has led to the search for more reliable and quantitative methods for determining ECE, one of which is the length of capsular contact (LCC) (7,8). LCC, originally proposed as an ultrasound (US)-based parameter by Ukimura et al. (9), has recently gained interest as a MRI-based parameter for determining ECE. Two initial studies report promising results with relatively high accuracy and inter-reader reproducibility. However, the measurement of LCC in these studies were based only on T2W imaging and ADC maps and there remains a need to identify the most optimal sequence for measuring LCC (7,8). The literature suggests that MRI-based measurements may vary according to the sequence in which they are done (10,11). Furthermore, other variables such as post-biopsy hemorrhage could have an effect on measurements (12).
Therefore, the purpose of our study was to evaluate which is the optimal sequence for measuring LCC for predicting ECE in patients with prostate cancer.
Material and Methods
Patient selection
We received approval from the institutional review board of Seoul National University Hospital for this retrospective study with waiver of requirement for informed consent. Inclusion criteria were: (i) patients who received radical prostatectomy for prostate cancer from January to December 2012; and (ii) underwent 3-T prostate MRI within 6 months before the operation. Among the initially identified 283 patients, we excluded those who met the following criteria: (i) neoadjuvant hormonal or radiation therapy (n = 15); (ii) transurethral resection or Holmium laser enucleation of the prostate prior to MRI (n = 5); (iii) inappropriate MRI examinations (performed at outside hospitals [n = 50], prostate MRI not consisting of DWI and dynamic contrast-enhanced (DCE) MRI sequences [n = 4], high b-values for DWI of <800 s/mm2 [n = 14], and significant artifacts precluding accurate measurement on ADC maps [n = 7]); and (iv) missing clinicopathological data (n = 3). Ultimately, 185 patients were included in the study population with a mean age of 66.7 ± 7.0 years (range, 45–79 years). The mean interval between biopsy and MRI and that between MRI and RP was 29.4 ± 28.7 (range, 2–255 days) and 27.2 ± 19.2 days (range, 1–174 days), respectively.
MRI acquisition
MRI examinations were performed with 3-T scanners (Magnetom Verio and Magnetom Trio; Siemens Healthcare, Erlangen, Germany or Ingenia, Philips Healthcare, Best, The Netherlands). Prior to MR, patients were given 20 mg of butyl scopolamine (Buscopan; Boehringer-Ingelheim, Ingelheim, Germany) for suppression of bowel peristalsis.T2W images in axial, coronal, and sagittal planes were acquired with the following parameters: repetition time (TR)/echo time (TE), 3100–4480/90–130 ms; slice thickness (ST), 3 mm; interslice gap, 0.3 mm; matrix, 448 × 358–512 × 317; field of view (FOV), 19–20 cm; voxel dimensions (VD), 0.4 × 0.5–0.6 × 3 mm3; number of excitations (NEX), 2; parallel imaging acceleration factor, 2. Axial T1-weighted (T1W) imaging was obtained with the following parameters: TR/TE, 500–839/9–12 ms; ST, 3 mm; interslice gap, 0.3 mm; matrix, 448 × 448–512 × 322 matrix; FOV, 19–20 cm; VD, 0.4 × 0.5–0.6 × 3 mm3; NEX, 1; parallel imaging acceleration factor, 2. Axial fat-suppressed single-shot echo-planar DWI was performed with the following parameters: TR/TE, 6000–7500/63–90 ms; ST, 3.5 mm; interslice gap, 0 mm; matrix, 128 × 128–192 × 192 matrix; FOV, 30 cm; VD, 1.6 × 1.6 × 3 mm3 or 2.3 × 2.3 × 3 mm3; NEX, 6; parallel imaging acceleration factor, 2; b values, 0 and 1000 s/mm2. ADC maps were automatically generated on a pixel-by-pixel basis assuming a monoexponential signal decay fitted to trace DWI images at b = 0 and 1000 s/mm2. In addition, axial fat-suppressed DCE-MRI after intravenous injection of 0.1 mmol/kg of gadoterate meglumine (Dotarem; Guerbet Group, Villepinte, France) at a rate of 2 mL/s was also undertaken using a power injector (Spectris Solaris; Medrad, Warrendale, PA, USA) with the following parameters: TR/TE, 3.5–4.4/1.5–1.7 ms; ST, 3.5 mm; interslice gap, 0 mm; matrix, 220–256 × 192; FOV, 22–24 cm; VD, .09–1.0 × 1.1–1.3 × 3.5 mm3; NEX, 1; parallel imaging acceleration factor, 2; temporal resolution, 10 s.
Image analysis
One faculty urogenital radiologist (JYC) with 22 years of experience, blinded to the clinical and pathological information reviewed the images at a PACS system (Infinitt Co, Ltd, Seoul, Republic of Korea). The T2W imaging, ADC map, and DCE-MRI sequences were comprehensively assessed to identify a dominant tumor defined as a mass-like lesion with low signal intensity on T2W imaging and ADC map with or without early contrast enhancement (7). Then, for this dominant tumor, the LCC was measured using a digitalized curvilinear ruler tool within our PACS system which generated spline curves based on De Boor’s algorithm (13). LCC was measured separately on each sequence (T2W imaging, ADC map, and DCE-MRI). When there was no dominant tumor or when it did not come in contact with the capsule, LCC was recorded as 0 (7). For analysis, the greatest length determined from LCC measured from any sequence (LCCT2, LCCADC, and LCCDCE for T2W imaging, ADC map, and DCE-MRI) was defined as LCCmax.
Pathological analysis
All RP specimens were reviewed by a single faculty genitourinary pathologist. Pathological slides were obtained with step-sections of 4-mm intervals and stained with hematoxylin and eosin (H&E). All cancer foci were drawn on a pathologic map and a structured report was written according to a standardized processing and reporting protocol (14). The report included information on location, volume (%), Gleason score, pathological stage, and extraprostatic disease (ECE, seminal vesical invasion, or lymph node metastasis).
For the purpose of radiologic-pathologic correlation, the MRI findings were matched with the pathologic maps referencing the pathological report using landmarks as follows: border of peripheral and transition zone, anatomical levels from base, midgland to apex, verumontanum, urethra, and (if present) other ancillary findings including cysts, calcifications, and benign hyperplastic nodules (15).
Statistical analysis
Continuous variables were summarized as mean ± standard deviation and ranges while categorical variables were summarized as frequencies and percentages. The normality of LCC was tested using the Kolmogorov–Sminorv test and determined that all LCCs were not normally distributed (P < 0.001). Therefore, non-parametric tests were used for analysis of LCC. The LCC measured on different sequences were compared using the Mann–Whitney U test. The Wilcoxon signed rank test was used to compare the LCC in patients with and without ECE. Furthermore, receiver operating characteristic (ROC) curve analysis was performed to compare the ability of each sequence used to determine LCC for predicting ECE, in terms of area under the curves (AUCs) and to determine the most optimal cutoff value of LCC for each sequence. Then, univariate and multivariate logistic regression analysis using different types of LCCs and preoperative clinicopathological factors were performed to assess the association with ECE. Statistical analyses were performed using two statistical softwares (SPSS version 21, IBM Corp., Armonk, NY, USA and MedCalc version 12.3.0, Mariakierke, Belgium). Two-sided P values less than 0.05 were considered to be statistically significant.
Results
Baseline characteristics
Preoperative findings of 185 patients.
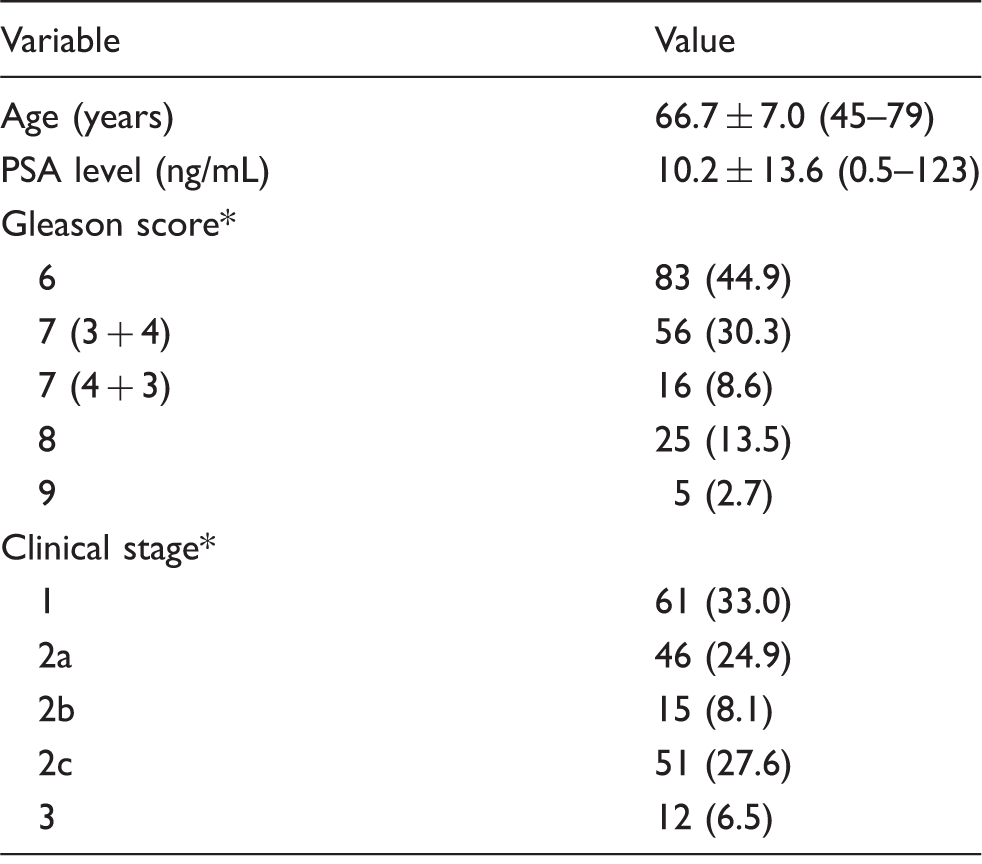
Data are mean ± standard deviation, with range in parentheses.
Data are presented as number of patients, with percentages in parentheses.
Surgical findings of 185 patients.
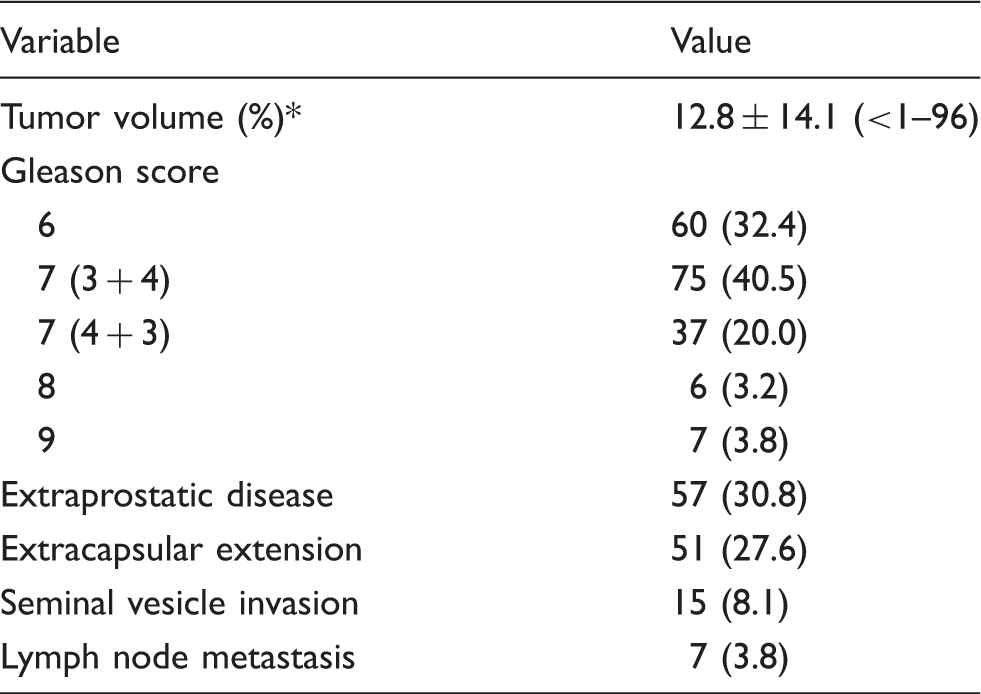
Data are presented as number of patients, with percentages in parentheses.
Data are mean ± standard deviation, with range in parentheses.
MRI findings
The mean value of LCCs were as follows: 11.5 ± 12.6 mm, 12.0 ± 12.4 mm, 11.9 ± 13.4 mm, and 14.1 ± 13.7 mm for LCCT2, LCCADC, LCCDCE, and LCCmax, respectively. There were no significant difference between the LCC measured on different sequences: P = 0.333, 0.429, and 0.837 for T2W imaging versus ADC map, T2W imaging versus DCE-MRI, and ADC map versus DCE-MRI, respectively. LCC of 0 were given due to absence of a dominant tumor and non-contact with the capsule in 52 (28.1%) and eight (4.3%) patients on T2W imaging, in 45 (24.3%) and eight (4.3%) patients on ADC maps, and in 61 (33.0%) and four (2.2%) patients on DCE-MRI, respectively. LCCmax was derived from T2W imaging, ADC maps, and DCE-MRI in 45 (24.3%), 36 (19.5%), and 53 (28.6%) patients, respectively LCC was 0 on all sequences in 51 (27.6%) patients.
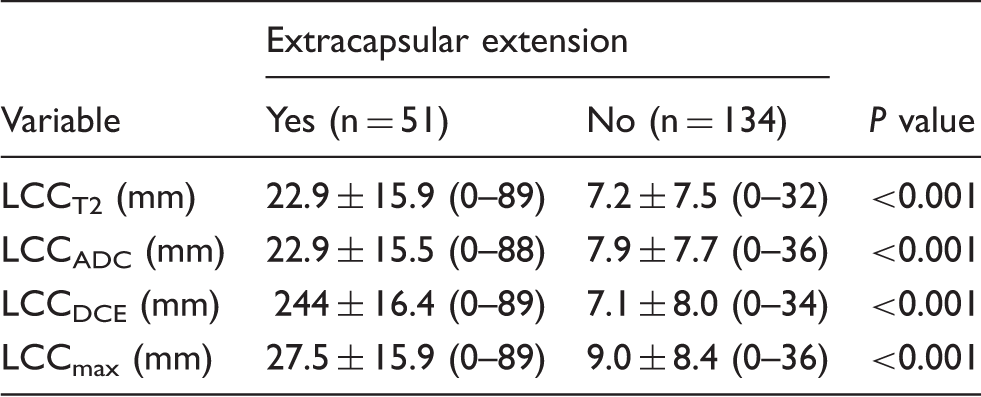
Assessment of extracapsular extension using length of capsular contact
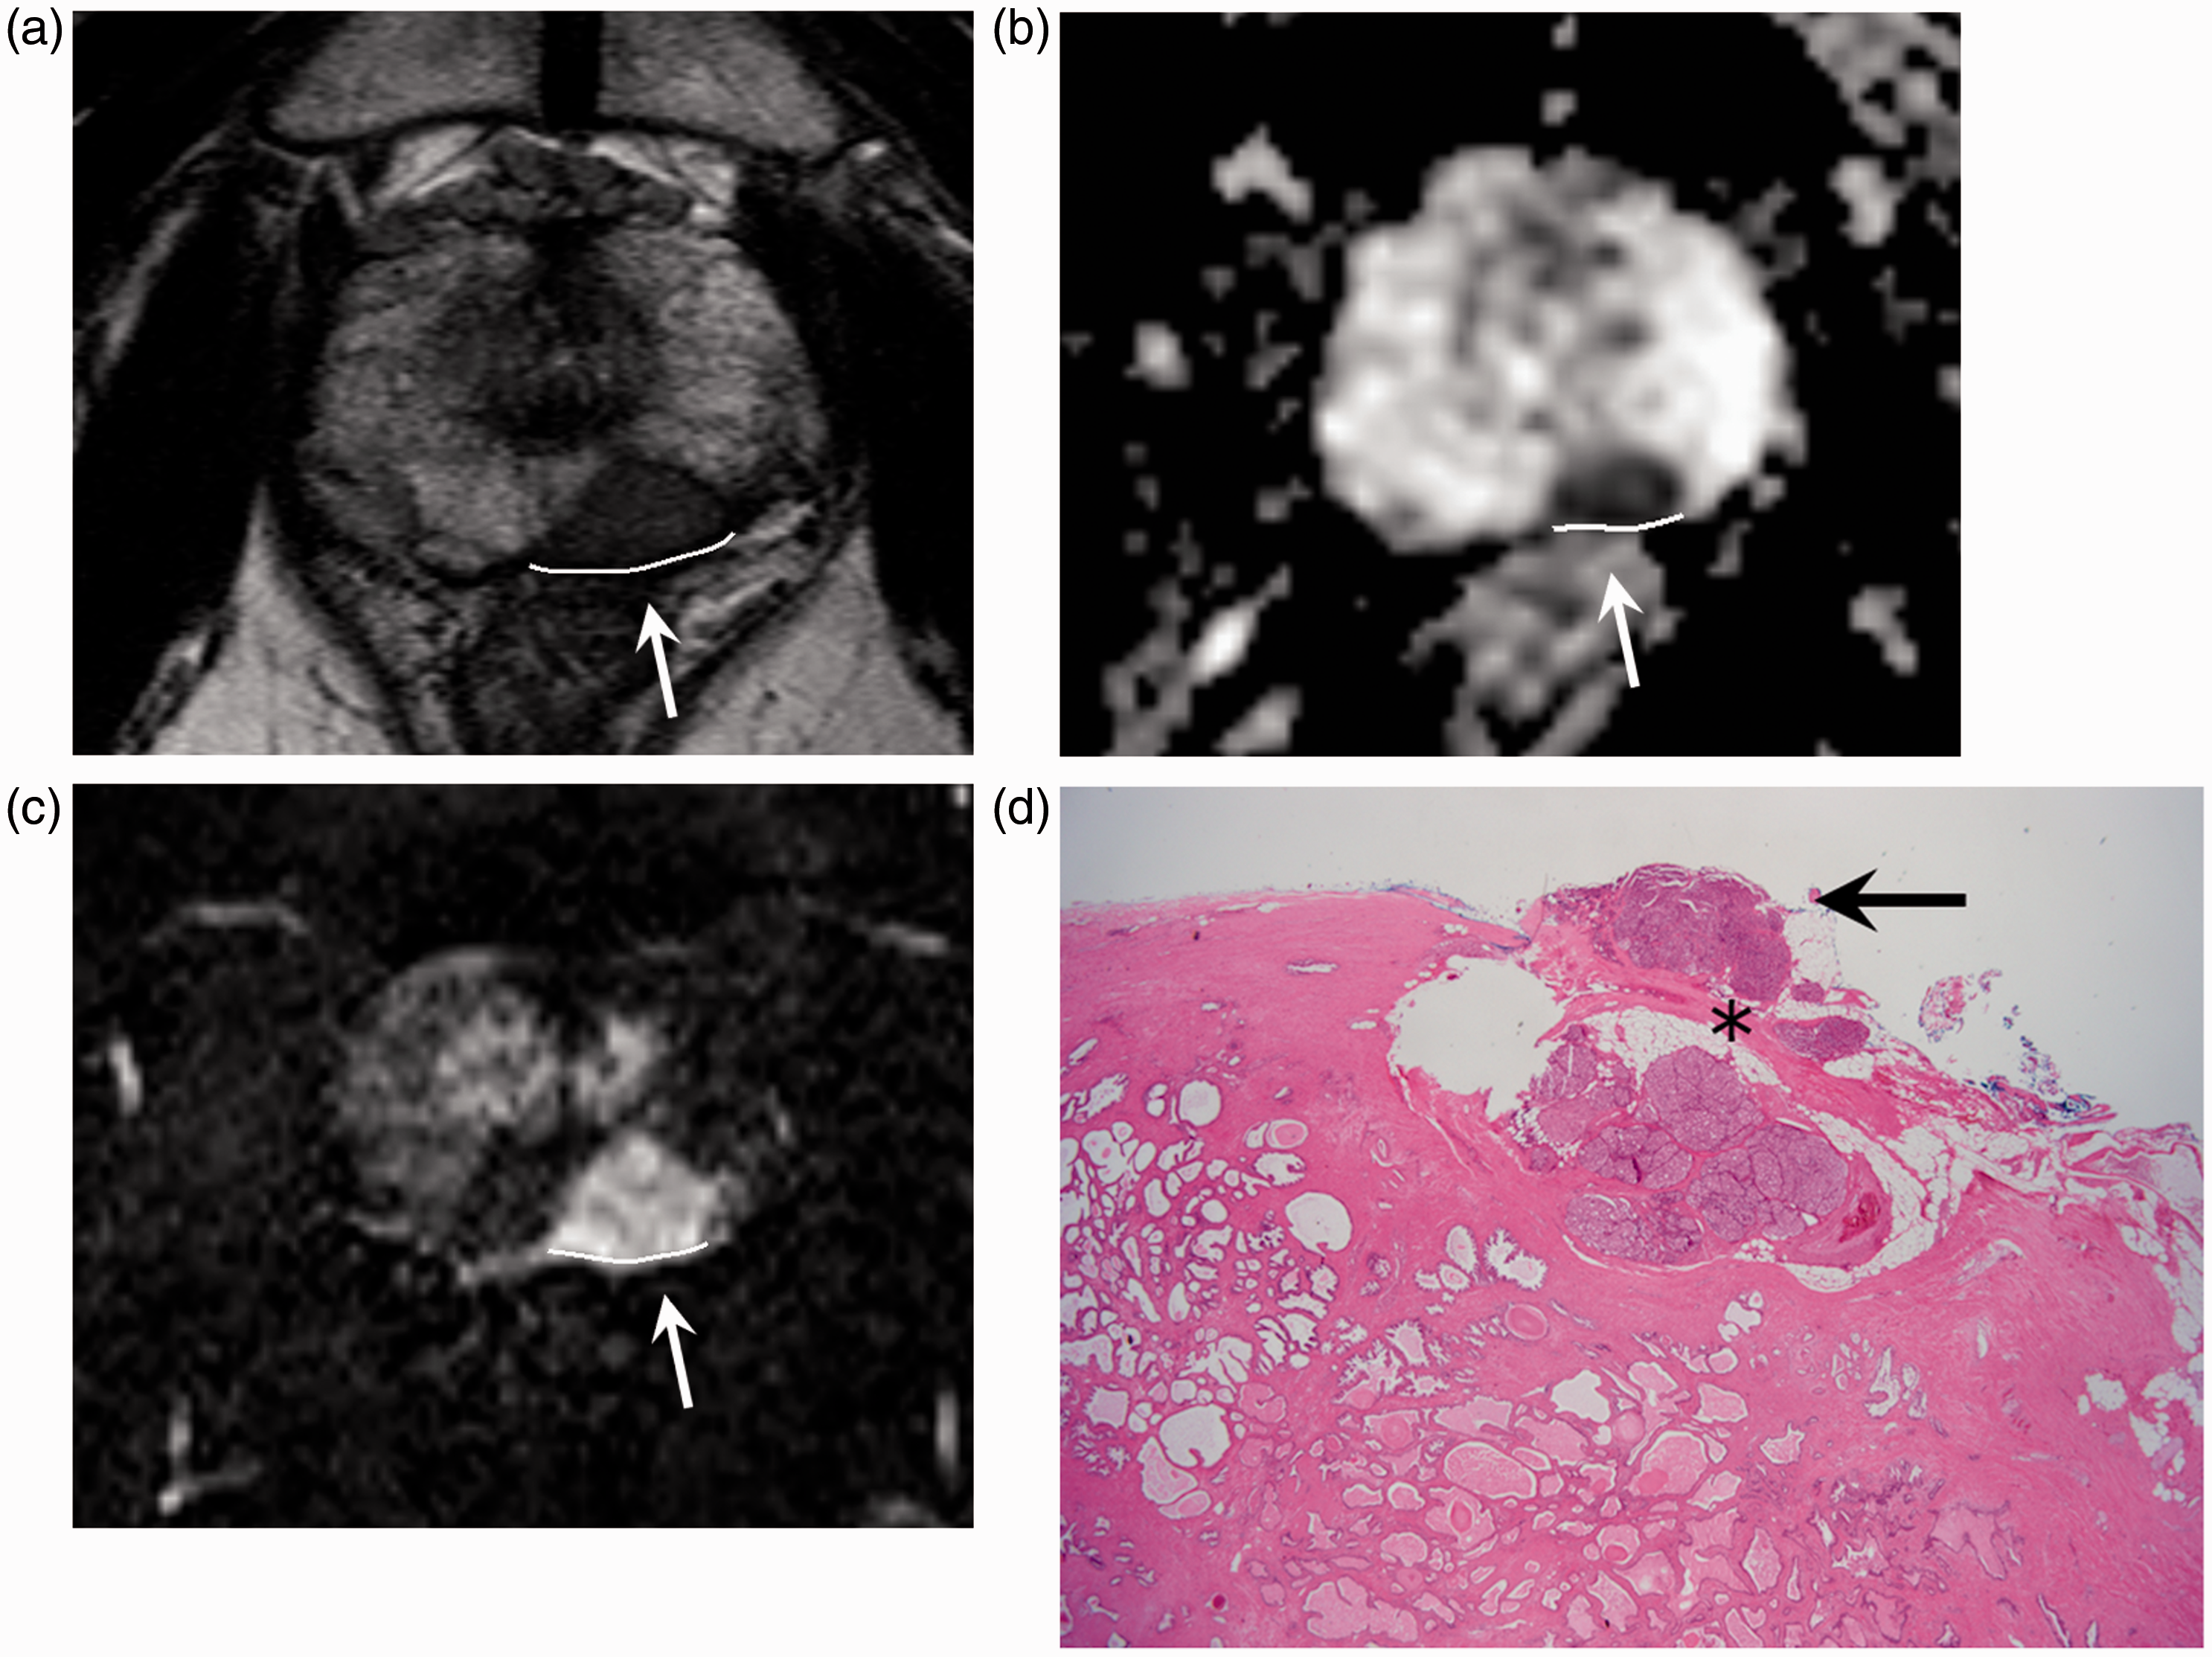
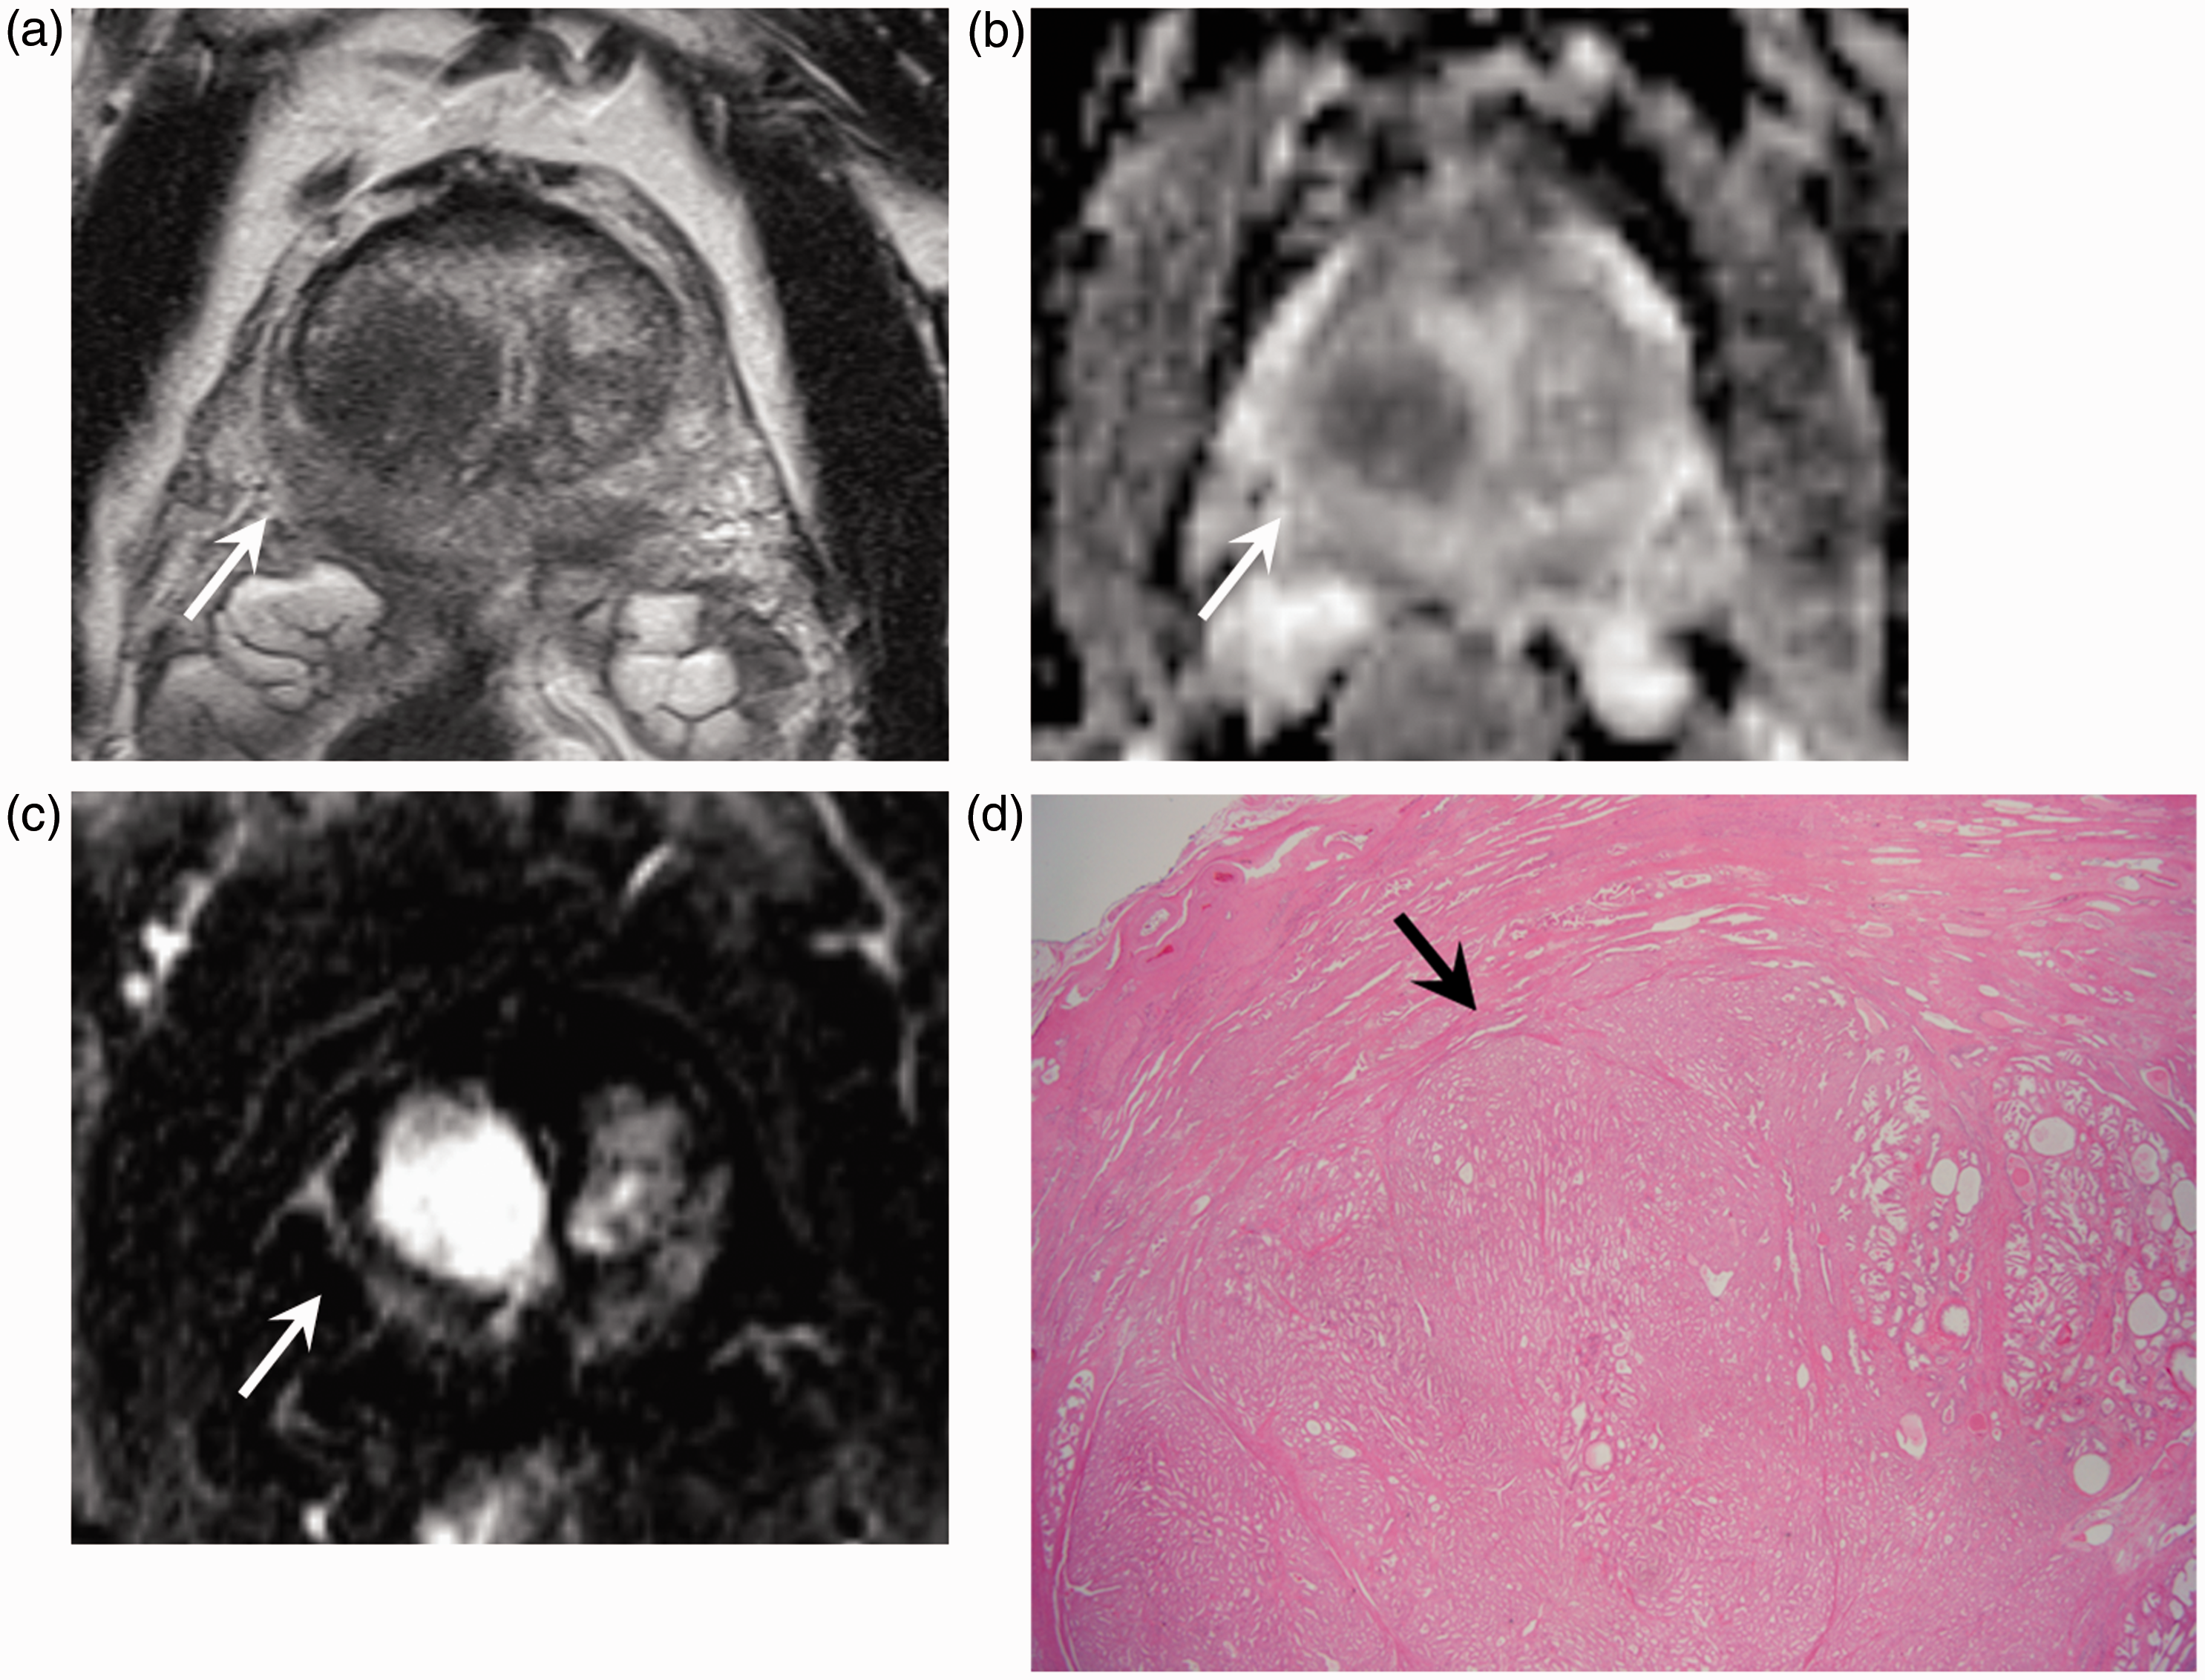
Table 3 shows the LCC stratified to the presence of ECE on RP. LCCs measured on all sequences as significantly greater in patients with ECE than those without (P < 0.001 for all comparisons). Representative cases are shown in Figs 1 and 2. No ECE was found in all patients with LCCmax was 0 or when any LCC was 0 because there was no contact with the capsule (Fig. 3).
Representative figure showing measurement of length of capsular contact (LCC) in a 79-year-old man with prostate cancer. He had a preoperative prostate-specific antigen level of 5.5 ng/mL, clinical stage of 1c, and biopsy Gleason score of 7 (3 + 4). (a–c) Using a digitalized curvilinear ruler tool, LCC of the prostate cancer (arrows) in the right peripheral zone was measured on (a) T2W imaging, (b) ADC map, and (c) DCE-MRI (LCCT2 = 6 mm, LCCADC = 6 mm, LCCDCE = 9 mm, and LCCmax = 9 mm). (d) At final pathology, Gleason score of prostate cancer was 7 (4 + 3). Tumor (arrow) was in near vicinity of capsule (asterisk) but without contact or extracapsular extension. Representative figure showing measurement of length of capsular contact (LCC) in a 71-year-old man with prostate cancer. He had a preoperative prostate-specific antigen level of 19.8 ng/mL, clinical stage of 1c, and biopsy Gleason score of 8. (a–c) Using a digitalized curvilinear ruler tool, LCC of the prostate cancer (arrows) in the left peripheral zone was measured on (a) T2W imaging, (b) ADC map, and (c) DCE-MRI (LCCT2 = 19 mm, LCCADC = 14 mm, LCCDCE = 16 mm, and LCCmax = 19 mm). (d) At final pathology, Gleason score was 9 with extracapsular extension. Arrow and asterisk indicate tumor component showing extracapsular extension and capsule, respectively. A 61-year-old man with prostate cancer showing completely intraprostatic tumor. He had a preoperative prostate-specific antigen level of 8.2 ng/mL, clinical stage of 2c, and biopsy Gleason score of 7. (a–c) Dominant tumor (arrows) in the right transition zone does not contact the capsule on (a) T2W imaging, (b) ADC map, and (c) DCE-MRI, and therefore all LCCs were considered 0. (d) After surgery, Gleason score of tumor (arrow) was confirmed as 7 (3 + 4) with no extracapsular extension. Length of capsular contact stratified by presence of extracapsular extension. Data are mean ± standard deviation, with range in parentheses. LCC, length of capsular contact.
Receiver operating characteristic curve analysis for LCC in determining extracapsular extension.
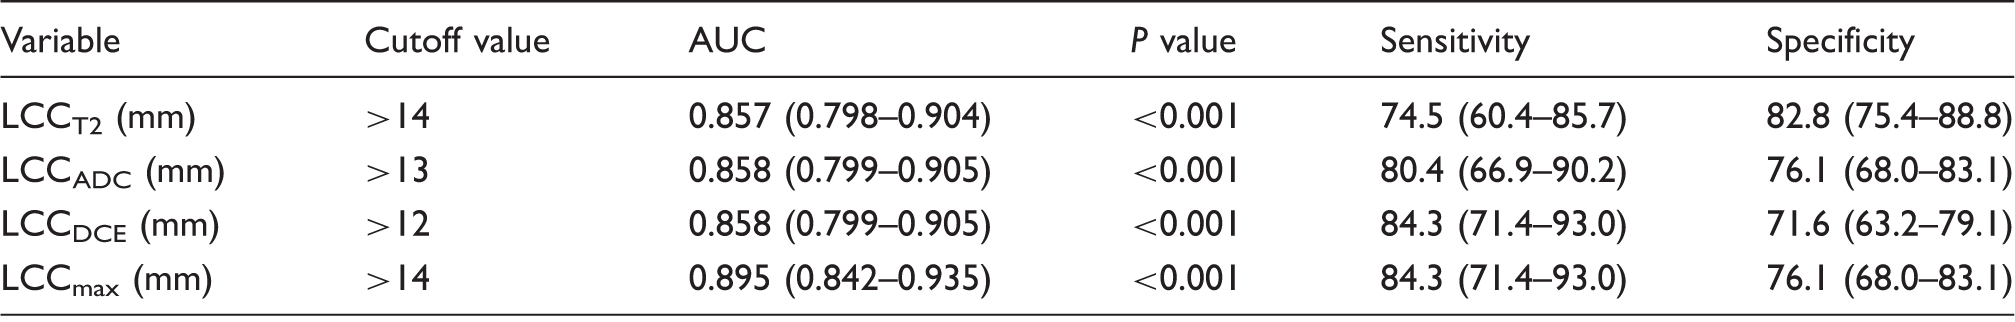
Data in parentheses are 95% confidence intervals.
Logistic regression analysis for clinicopathological factors and length of capsular contact for prediction of extracapsular extension.

Data in parentheses are 95% confidence intervals.
LCC, length of capsular contact; PSA, prostate-specific antigen.
Discussion
In the present study, we assessed LCC measured on various sequences on multiparametric prostate MRI and determined its association with ECE of prostate cancer. We found that not only were LCCs measured on all sequences significantly different in patients with and without ECE, but were also independently predictive of ECE in a multivariate model including preoperative clinicopathological factors. The results of our study are in agreement with two previous studies that assessed LCC based on T2W imaging or ADC maps on multiparametric prostate MRI (7,8). With these promising early results and validation in future studies, multiparametric prostate MRI will be able to play a more crucial role in preoperative assessment of patients with prostate cancer.
MRI has been widely assessed for its value in determining ECE of prostate cancer. Traditionally, qualitative morphological criteria such as irregular capsular bulging on T2W imaging had been used (16). However, these criteria have been subject to criticism due to their low accuracy and subjectivity. This has led to an increased interest in more reliable and quantitative methods such as the already well-known ADC and more novel LCC (17–21). LCC was first tested by Ukimura et al. (9) using ultrasonography. In their study, US-based LCC was the best predictor of ECE among several clinicopathological factors. Furthermore, in the only two contemporary studies on MRI-based LCC, LCC was also superior to the traditional morphological criteria (7,8). The rationale for LCC to be used for prediction of ECE is that: (i) radiological LCC is highly correlated with pathological LCC (r = 0.691–0.839); and (ii) the likelihood of prostate cancer cells extending beyond the prostatic capsule is associated with LCC (8,9). In fact, regardless of the sequence used to measure LCC, no tumor with LCC of 0 due to non-contact with the capsule was shown to have ECE in our study. Furthermore, LCC has shown to be more reproducible than subjective criteria for assessing ECE in previous studies: kappa values of 0.7 and 0.49–0.613, respectively (7,18). On the basis of the provided evidence in our study and others, measuring LCC has potential to become a quantitative, objective, and reliable biomarker in the assessment of ECE in prostate cancer.
One obstacle for the immediate application of LCC to clinical practice is the setting the appropriate cutoff value for determining ECE. In our study, the optimal threshold values were in the range of 12–14 mm depending on the MRI sequence, whereas they were 6, 7, 10, or 20 mm in previous studies (7,8). Several factors may have attributed to these differences: (i) characteristics of the study population (i.e. ethnicity, prevalence of ECE, indications for MRI); (ii) MRI-related factors such as magnet strength (1.5-T in Baco et al. (8) versus 3-T in the present study and Rosenkrantz et al. (7)) and specific MRI parameters; and (iii) methodology of the studies regarding measurement of LCC (straight line in Rosenkrantz et al. (7) versus curvilinear length in ours and Baco et al. (8)), side-specific analysis (Rosenkrantz et al. (7)), and separate analysis for focal and non-focal ECE (Rosenkrantz et al. (7)).
While two initial studies reported on the usefulness of LCC in determining ECE of prostate cancer, which sequence should be used to measure LCC was a question yet to be answered. LCC was measured only on T2W images in the study by Baco et al. (8) and on T2W images and ADC maps in that by Rosenkrantz et al. (7). No prior study has assessed DCE-MRI or LCCmax derived from various sequences, and has compared the predictive value of ECE using these LCCs. In our study, all sequences showed relatively equivalent diagnostic ability with similar cutoff values. Although LCCmax yielded the highest AUC value, only LCCmax showed statistically significant superiority over LCCADC with no significant differences between others. Using LCCmax has the potential to be better than any single sequence to measure LCC for a few reasons. First, it has been reported that there is a tendency of underestimating pathological tumor volume when using MRI and that pathological tumor volume was most optimally predicted when using the maximum value measured from any sequence (11). Therefore, although not analyzed as part of the current study, the correlation between radiologically and pathologically measured LCC may be greatest when using LCCmax compared with other LCCs. Furthermore, using LCCmax can overcome several disadvantages of individual MRI sequences. For example, the ADC map is known for its poor spatial resolution compared with that of T2W imaging or DCE-MRI. Therefore, a previous study even suggested that rather than comparing the efficacy of T2W imaging and DWI, radiologists should comprehensively integrate morphological information from T2W imaging (i.e. PI-RADS scoring system for ECE) and functional information using DWI (i.e. ADC value) (18). In addition, DWI is prone to artifacts from metal objects and air. Although we excluded any patient with obvious artifacts, the possibility of subtle distortions cannot be excluded. In the future, more advanced DWI techniques (i.e. reduced FOV or readout-segmented DWI) which are less prone to artifacts and have higher spatial resolution may be implemented and overcome such disadvantages (22,23). In addition, post-biopsy hemorrhage can obscure the tumor on T2W imaging and ADC maps and therefore hinder accurate measurement of LCC. Although DCE-MRI also shows SI alteration from hemorrhage, the subtraction technique partially neutralizes this effect. Still, DCE-MRI showed the highest prevalence of LCC = 0 due to the absence of a dominant tumor. In fact, recent studies suggest that DCE-MRI may have a lesser role than previously suggested in the preoperative setting of prostate cancer. Not only is DCE-MRI not a dominant sequence in the recent guidelines of PI-RADS version 2, the contribution of DCE-MRI to T2W imaging and DWI was minimal for identifying prostate cancer (24,25).
A few limitations of our study warrant mention. First, the retrospective nature may have introduced selection bias. Second, we did not compare the accuracy of conventional criteria with LCC. However, the superiority of LCC has already been demonstrated in prior studies, and the main goal of our study was comparison of LCC derived from various MRI sequences (7,8). Third, all patients in our study population underwent MRI after biopsy. Targeted biopsies after a pre-biopsy MRI is gaining interest as an attractive potential strategy to the traditional systematic biopsies (26); however, a significant proportion of patients still undergo MRI after being diagnosed with prostate cancer at biopsy. The problem is that SI alteration from post-biopsy hemorrhage can last up to 8 weeks hindering proper evaluation on prostate MRI (12). Although there are reports that the ability to predict ECE is not affected by the presence of hemorrhage (27), Rosenkrantz et al. (7) reported that the accuracy of determining ECE using MRI-based LCC was significantly lower in patients with a prior biopsy that in those without. Fourth, we could not separately evaluate microscopic and gross ECE as our pathological report during this study period did not specify such details. Recent studies suggest that the degree of ECE is clinical relevant and associated with the risk of biochemical recurrence after RP (28). Further studies are needed to determine optimal cutoff values for each type of ECE. Fifth, the slice thickness and interslice gap was different among the sequences in our multiparametric MRI protocol. Therefore, whether unification of such parameters will bring about meaningful differences in the accuracy of LCC in determining ECE using different MRI sequences is yet to be answered.
In conclusion, LCC measured on any sequence on multiparametric MRI was significantly different in patients with and without ECE. Furthermore, all types of LCC were independently associated with the presence of ECE. Although LCCmax showed the greatest ability to predict ECE, there was relatively equivalent performance among different MRI sequences. With verification in future studies LCC may be used as a quantitative biomarker for prediction of ECE and help in deciding the management of patients with prostate cancer.
Footnotes
Declaration of conflicting interests
The author(s) declared no potential conflicts of interest with respect to the research, authorship, and/or publication of this article.
Funding
The author(s) received no financial support for the research, authorship, and/or publication of this article.