




Abstract
Background
The white matter in the Heschl’s gyrus (HG-WM) may appear differently to the other gyri on phase difference enhanced imaging (PADRE), which can enhance the myelin density.
Purpose
To evaluate the signal intensity (SI) of HG-WM using the PADRE technique and to compare the images with susceptibility-weighted imaging (SWI)-like images.
Material and Methods
The participants included 19 normal controls (38 HGs; mean age, 60.1 years; age range, 28–80 years). Coronal PADRE and SWI-like images were acquired using a 3T magnetic resonance (MR) system. The SI of the HG-WM was classified into three grades based on a comparison with the SI of the superior temporal gyrus: Grade 1, isointense; Grade 2, slightly hypointense, and Grade 3, markedly hypointense.
Results
In the assessment of the SI of the HG-WM, the HG-WM appeared hypointense in all 38 sites of the 19 participants; the hypointensity corresponded to Grade 2 in 13 (34%) images and Grade 3 in 25 (66%) images. On the other hand, the HG-WM was classified as Grade 1 (isointense) in all of the SWI-like images.
Conclusion
The HG-WM appears hypointense on PADRE, which probably reflects the higher myelin content. PADRE may be useful for identifying the HG through the assessment of the SI of the HG-WM.
Keywords
Introduction
The anatomy of the deep white matter regions, which consist of large axonal bundles, has been well-characterized in anatomical and histological studies (1). In contrast, the superficial white matter (SWM), which fills the space between the deep white matter and the cortex, has not (2). For example, the SWM is known to contain short cortical association fibers, but the regional differences among the gyri in the volume of these fibers have not been sufficiently defined.
A new phase-weighted magnetic resonance imaging (MRI) technique, phase difference enhanced imaging (PADRE), has been developed. In this technique, the phase difference between the target and the surrounding tissue is selected in order to enhance the contrast of the target tissue (3). By choosing appropriate phase differences, the tissue contrast can be varied from a single MR image. Some of the PADRE settings offer a new level of contrast that could not be realized with earlier phase techniques (4). The high spatial resolution PADRE delineates various fiber tracts, such as the optic radiation fiber tracts, the central tegmental tract, and the medial and dorsal longitudinal fasciculus tracts (3,5). It has been suggested that the myelination of the nerve fibers was a factor that determined the signal intensity (SI) on PADRE and that the contrast on these images reflects not only the iron content but also the myelin density. Thus, we hypothesized that the use of the PADRE technique might allow for the identification of the anatomical features of the myelin density in the SWM regions.
The identification of the main cortices, such as sensorimotor, visual, and auditory cortices, is important in the planning of surgical intervention. The human primary auditory cortex is located in the posterior part of the supratemporal plane. Anatomically, it largely corresponds to the transverse temporal gyri, or the Heschl’s gyri (HG) (6). Previous MR studies have reported the characteristic shape of the HG on sagittal or coronal images (7,8); the HG was anatomically identified as an Ω-shaped or heart-shaped protrusion in the supratemporal plane in all participants. However, the morphology of the auditory cortex has been described as highly variable, and there may be two or more HGs in one hemisphere (7). Another previous MR study showed that the HG can be identified by the characteristic low SI of its gray matter (GM) on T2-weighted (T2W) imaging (9). To our knowledge, however, there have been no studies comparing the SI of the SWM in the HG (HG-WM) with that in other gyri. To further characterize the HG on MR images, we evaluated the relative SI of the HG-WM on high-spatial-resolution 3T MR images obtained using PADRE in comparison to the SI on susceptibility-weighted imaging (SWI-)like images.
Material and Methods
The institutional review board approved this retrospective study, and informed consent was not required. At our institution, the three-dimensional (3D) GRASS (Gradient Recalled Acquisition in Steady State) sequence is a part of routine brain MRI.
The study population included 19 consecutive normal controls without a history of neurological or psychiatric disease (8 men, 11 women; mean age, 60.1 years ± 17.8; age range, 28–80 years) who underwent brain MR examinations, including the 3D GRASS sequence, between May 2012 and March 2014. Coronal images were acquired covering the entire temporal lobe using a 3T MR system.
All studies were performed with a 3T MR system (Signa EXCITE 3T; GE Healthcare, Milwaukee, WI, USA) using a dedicated eight-channel phased-array coil (USA Instruments, Aurora, OH, USA). The PADRE parameters consisted of 3D GRASS sequence, which was acquired with: TR, 45 ms; TE, 28 ms; imaging time, 12 min; field of view (FOV), 22 cm; matrix, 512 × 512; and section thickness, 1.4 mm. The resulting voxel size was 0.4 × 0.4 × 1.4 mm3.
PADRE technique
The method of the PADRE technique has been described in a previous report (3). One of the major concepts that is responsible for the power of the PADRE technique is “phase difference selection,” which enhances the magnetic properties of the target tissue. SWI, for example, selects only a phase difference related to vessels, especially the veins. In PADRE, however, various phase differences (

The reconstitution parameters of PADRE were optimized based on previous results (3). In addition, SWI-like images were also reconstructed from the MR data.
Image interpretation
The MR images were reviewed in consensus by two neuroradiologists (NO with 29 years of experience and JM with 14 years of experience). In the present study, the 38 HGs of 19 healthy participants were evaluated. First, the neuroradiologists independently assessed the image quality of PADRE and SWI-like images. The following scores were used to evaluate the diagnostic value of the depiction of the HG-WM and GM in the HG (HG-GM): 1, excellent; 2, adequate; and 3, non-diagnostic due to artifacts. The neuroradiologists were blinded to the MRI sequence; all disagreements were solved by the consensus reading of images. Their consensus grading scores were used in the analyses.
The SI of the HG was then independently interpreted by the two neuroradiologists on both PADRE and SWI-like images. The participants who were scored as non-diagnostic were excluded based on an image quality assessment. The superior temporal gyrus (STG) was used as a reference. For both PADRE and SWI-like imaging, each image was analyzed separately and only one sequence was shown at a time. For the SI of the HG-GM and the HG-WM, the participants were divided into three grades (in comparison to the STG): Grade 1, isointense; Grade 2, slightly hypointense; and Grade 3, markedly hypointense. The radiologists solved all disagreements by the consensus reading of images and their consensus grading scores were used in the analyses. We also evaluated the SI of the HG separately for the right and left hemispheres. Moreover, we calculated the average grading scores in each group (HG-GM and HG-WM on both PADRE and SWI-like imaging); PADRE and SWI-like images were compared. We also analyzed the age-related changes in the average grading scores for both HG-GM and HG-WM on PADRE.
The average grading scores were expressed as the mean ± standard deviation. A paired t-test was used to calculate the statistical significance of the differences between the image sequences.An analysis of variance (ANOVA) was performed to compare the differences in the average grading scores among each age group (20–49 years [n = 8], 50–69 years [n = 18], and 70–89 years [n = 12]). P values <0.05 were considered to indicate a statistically significant difference. Inter-observer variability was calculated as a weighted κ value. The strength of the agreement was considered fair for κ values of 0.21–0.40, moderate for κ values of 0.41–0.60, good for κ values of 0.61–0.80, and excellent for κ values of ≥0.81.
Results
Image quality assessment
The results of image quality assessment.
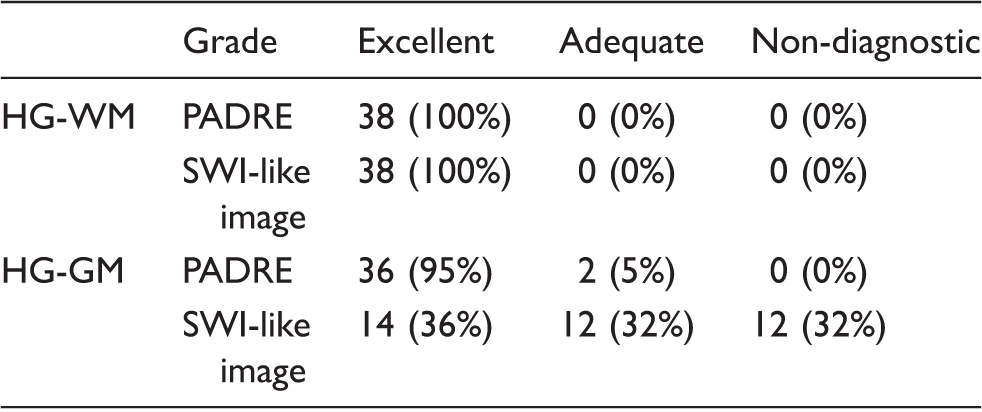
HG-GM, gray matter in the Heschl’s gyrus; HG-WM, white matter in the Heschl’s gyrus; PADRE, phase difference enhanced imaging.

Examples of the grading of image quality and the SI in images from a 30-year-old man. Representative PADRE (a) and SWI-like (b) images sampled from the same slice location are shown. In the image quality assessment, both HG-WM and HG-GM are depicted nicely on PADRE (excellent). On the SWI-like image, the HG-WM is clearly depicted (excellent); however, the HG-GM is not depicted adequately because of the presence of artifacts (non-diagnostic). In the SI assessment, the HG-WM is markedly hypointense on PADRE in comparison to the WM of the STG (Grade 3) and isointense on the SWI-like image (Grade 1). The HG-GM is isointense on PADRE (Grade 1). HG-GM, gray matter in the Heschl’s gyrus; HG-WM, white matter in the Heschl’s gyrus; PADRE, phase difference enhanced imaging; SI, signal intensity; STG, superior temporal gyrus.
The inter-observer agreement in the evaluation of the HG-WM and HG-GM was excellent on both PADRE (κ value, 0.92 and 0.88, respectively) and the SWI-like images (κ value, 0.90 and 0.88, respectively).
SI assessment
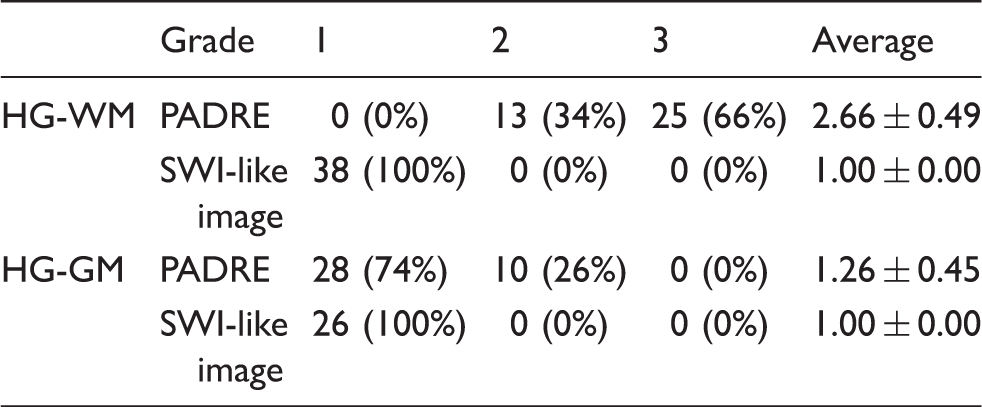
On all of the images captured using the PADRE technique, the HG-WM appeared either slightly (Grade 2; 34%, 13/38) or markedly hypointense (Grade 3; 66%, 25/38) (Figs. 1a and 2; Table 2); the HG-WM appeared isointense on all of the SWI-like images (Grade 1; 100%, 38/38) (Fig. 1b). The average grading scores on PADRE and SWI-like imaging were 2.66 ± 0.49 and 1.00 ± 0.00, respectively. PADRE was significantly superior to SWI-like imaging (P < 0.05). In comparison with the HG-WM, the HG-GM tended to appear as isointense with both imaging techniques. Grade 1 and Grade 2 appearances were found in 28 of 38 (74%) and 10 of 38 (26%) HGs on PADRE, respectively (Figs. 1a and 2). All of the SWI-like images corresponded to Grade 1 (Fig. 3). The average grading scores were 1.26 ± 0.45 on PADRE and 1.00 ± 0.00 on the SWI-like images. PADRE was significantly superior to SWI-like imaging (P < 0.05).
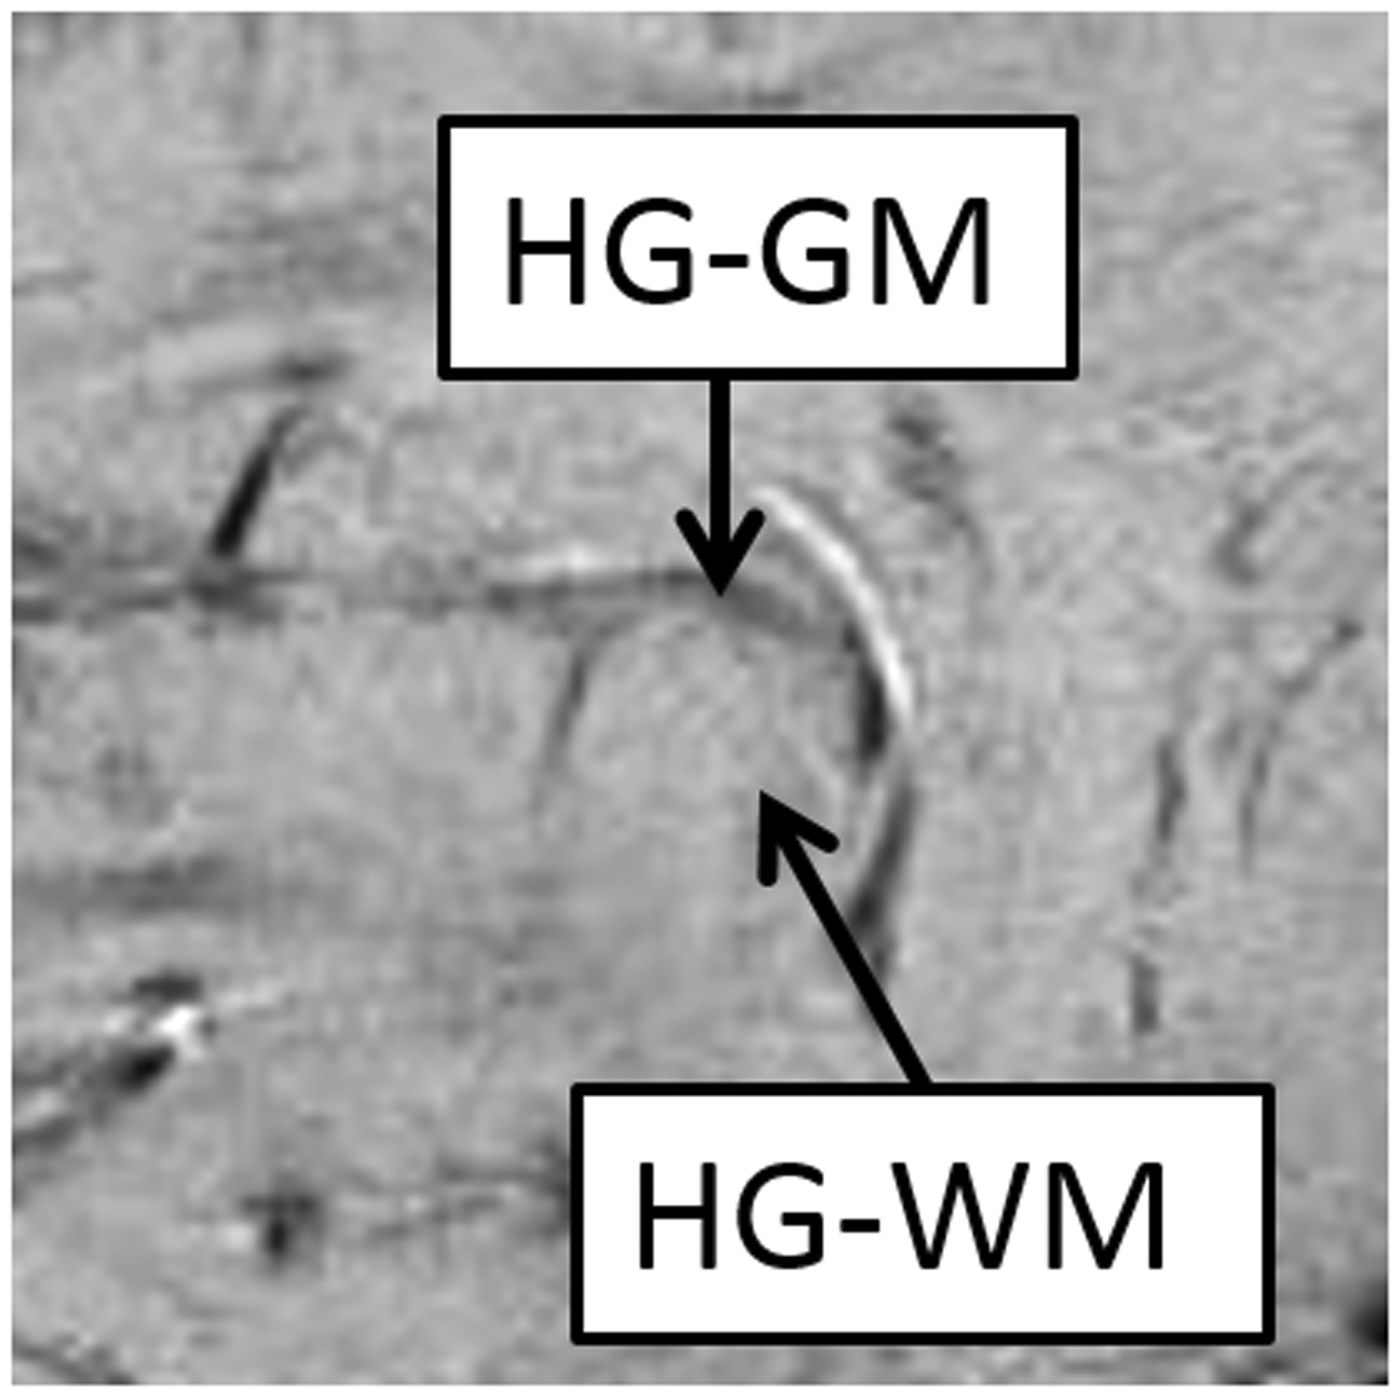
An example of the grading of the SI assessment from a 30-year-old woman. Both HG-WM and HG-GM are slightly hypointense on PADRE (Grade 2). HG-GM, gray matter in the Heschl’s gyrus; HG-WM, white matter in the Heschl’s gyrus; PADRE, phase difference enhanced imaging; SI, signal intensity. The results of signal intensity assessment. HG-GM, gray matter in the Heschl’s gyrus; HG-WM, white matter in the Heschl’s gyrus; PADRE, phase difference enhanced imaging. A representative SWI-like image from a 33-year-old man that was used for the assessment of the SI. Both HG-WM and HG-GM are isointense on the SWI-like image (Grade 1). HG-GM, gray matter in the Heschl’s gyrus; HG-WM, white matter in the Heschl’s gyrus; SI, signal intensity.
With regard to the average SI grading scores on PADRE, there were no significant differences between the right and left hemispheres for either the HG-WM (2.58 versus 2.74, P = 0.16) or the HG-GM (1.21 versus 1.32, P = 0.24).
The average grading scores in each age group (20–49 years [n = 8], 50–69 years [n = 18], and 70–89 years [n = 12]) on PADRE were 2.63, 2.72, and 2.58, respectively, for the HG-WM; and 1.38, 1.33, and 1.08, respectively, for the HG-GM. In both sites, the ANOVA showed no significant differences in the average grading scores of the age groups (P = 0.73 for the HG-WM and P = 0.24 for the HG-GM).
The inter-observer agreement in the evaluation of PADRE was good for the HG-WM (κ value, 0.70) and moderate for the HG-GM (κ value, 0.54). The inter-observer agreement in the evaluation of the SWI-like images was excellent for both the HG-WM and HG-GM (κ value, 1.00 for both).
Discussion
We investigated the SI of the HG-GM and HG-WM using the PADRE technique. In previous investigations, many small or common fiber tracts were identified in the brain stem using the PADRE technique (3). Our study extended these efforts to depict the myelination of the nerve fibers in the HG-WM, which had rarely been described in previous anatomical or histological studies. In all participants, the HG-WM was observed as the lower SI area in comparison to the WM of the STG on PADRE, but not on SWI-like images. Our results indicate that the PADRE technique may be useful for identifying the HG via the assessment of the SI of the HG-WM.
Kakeda et al. reported that the nerve fibers are delineated as low SI bands on PADRE (3); they hypothesized that the myelin concentration was the main factor determining the low SI on PADRE. In this study, we also attempted to optimize the reconstitution parameters of the PADRE technique to enhance the myelin density based on the findings of a previous study (5). The HG-WM, which fills the space between the deep white matter and the cortex, contains a larger amount of nerve fibers that consist of not only the large axonal bundles but also the short association fiber (U-fiber). In the present study, the PADRE technique could delineate the HG-WM as a low SI area, likely reflecting the higher myelin content. Moreover, the HG-WM was not seen as a low SI area on the SWI-like images, which are more sensitive to iron (10,11). These results also suggest that the hypointense HG-WM on PADRE may reflect the myelin density rather than the iron deposition.
Although the regional differences in the myelin content of the HG-WM have not been described previously, the HG-WM, in which the important afferent or efferent fibers project to or from, might be expected to be heavily myelinated. Moreover, in a previous neuroimaging study, the main cortex (the primary motor cortex, primary somatosensory cortex, primary visual cortex, auditory association cortex, and Broca’s area) were shown to be heavily myelinated (12). This may also indicate that the subcortical WM contains a larger number of nerve fibers that connect with the nerve fibers within the cortices.
It is known that the HG-WM is involved in various diseases. A previous study using resting-state functional MR (13) demonstrated that schizophrenia patients who are vulnerable to auditory hallucinations vulnerability show increased left HG functional connectivity in the left frontoparietal regions in comparison to patients without a history of auditory hallucinations. A previous diffusion tensor imaging study (14) demonstrated that prelingually deaf adolescents had significantly lower fractional anisotropy and increased radial diffusivity in the bilateral superior temporal gyri, which includes the HG. The authors hypothesized that these changes were signs of developmental impairment in the prelingually deaf adolescents, possibly reflecting axonal loss or a lack of myelination. These studies may highlight the clinical importance of the HG-WM. Thus, the relationship between the HG-WM findings on PADRE and the auditory pathology might be an interesting topic for further studies.
To our knowledge, two previous studies have demonstrated the value of the SI of the HG-GM for the identification of the HG. Yoshiura et al. (9) reported that the SI of the HG-GM on T2W imaging was often lower than that of the STG (55 HG/60 HG). Although the precise origin of the low SI of the HG-GM is unknown, iron deposition and/or myelin density may be contributing factors (9). Although the results differed from the previous study, the SI was only hypointense in 26% of images of the HG-GM captured using the PADRE technique. A possible reason is that the amount of myelin contained in the HG-GM may not be sufficient to allow its depiction using the PADRE technique. Moreover, our result may suggest that iron deposition may have had a greater influence on the SI in T2W imaging of the HG-GM in the previous study than the myelin density, because PADRE is not sensitive to iron deposition. Recently Wasserthal et al. (15) identified the HG-GM using the T1W/T2W ratio in all of 39 participants. They hypothesized that the T1W/T2W ratio may enhance the myelin density in the HG-GM. Since their approach seems to require some complicated calculations, it might not be practical to adopt it in routine clinical practice. In comparison to the previous methods, our quantitative method using PADRE is a simple, easy, and accurate method for detecting the HG.
Our assessment of the HG-WM with PADRE demonstrated no significant difference between the right and left hemispheres. However, it should be noted that our study population was of limited size. Penhune et al. (8) evaluated 20 young healthy participants (mean age, 23.5 years; age range, 18–32 years) and demonstrated that the total volume of the HG was larger in the left hemisphere than in the right, and that the automatic segmentation of the volumes into gray and white matter revealed larger volumes of white matter. They hypothesized that the larger volume of cortical connecting fibers within the HG-WM may be related to the known left-hemispheric dominance for speech. Thus, we assume that the PADRE technique, which enhances myelination of nerve fibers, could demonstrate the significant laterality of the SI in HG-WM due to the difference in the volume of the nerve fibers between the right and left HG-WM. This hypothesis should be confirmed in a larger study population.
We found no significant differences in the average grading scores for the HG-WM among the age groups. In a previous PADRE study, the perirolandic SWM appeared hypointense in comparison to other cerebral cortices, which probably reflects the higher myelin content, and this hypointensity would disappear with age due to the loss of myelin (16). On the other hand, we could not find a difference in the depiction of the HG-WM in young and elderly participants. However, our sample size was quite small, and further studies with a larger sample size will be needed to clarify the relationship between the appearance of the HG-WM and age.
The present study was associated with some limitations. First, on the image quality assessment, most the SWI-like images of the HG-GM were rated as non-diagnostic due to aliasing artifacts, which may have been caused by the fast flow from the middle cerebral artery and/or CSF pulsatile flow. Moreover, our 3D GRASS sequence was limited by its long acquisition time (12 min), which increases its susceptibility to motion artifacts; however, there were no variations in the image quality caused by patient movement in the present study. Parallel imaging, which substantially reduces the number of phase-encoding pulses that are required, could be useful for reducing the acquisition time, thereby minimizing motion artifacts (17). Although we were careful in the application of our imaging techniques, the further optimization of these techniques might lead to different results.
In conclusion, on PADRE, the SI of the HG-WM was always lower than that of the STG, which probably reflects the higher myelin content. Although the HG can usually be localized based on its shape, the conspicuous low-SI region that can be observed using the PADRE technique can be used as an additional landmark for the identification of the HG.
Footnotes
Declaration of Conflicting Interests
The author(s) declared no potential conflicts of interest with respect to the research, authorship, and/or publication of this article.
Funding
The author(s) received no financial support for the research, authorship, and/or publication of this article.