
Abstract
Background
In non-contrast-enhanced magnetic resonance (MR) arteriography, the flow-out method using a selective tagging pulse with a long inversion time (TI) and a non-selective inversion recovery pulse with a short TI (the modified flow-out method) might further contribute to the suppression of background signal and facilitate improved visualization of the hepatic artery. However, no report has focused on the image quality of non-contrast-enhanced MR arteriography using the modified flow-out method.
Purpose
To compare the flow-in method with the modified flow-out method and to determine which method better visualizes the hepatic artery.
Material and Methods
Twenty-seven healthy volunteers were examined using respiratory-triggered three-dimensional true steady-state free-precession MR with two selective inversion recovery pulses (the flow-in method) or with one tagging pulse and one non-selective inversion recovery pulse (the modified flow-out method).
Results
Artery-to-liver contrast was significantly increased in the modified flow-out method relative to the flow-in method (P < 0.05). In all analyses of vessel visibility, non-contrast-enhanced MR arteriography using the modified flow-out method exhibited higher scores than with the flow-in method. With respect to overall image quality, the modified flow-out method was significantly better than the flow-in method (P < 0.01).
Conclusion
The modified flow-out method for non-contrast-enhanced MR angiography is a promising technique for visualizing the hepatic artery.
Keywords
Introduction
Non-contrast-enhanced magnetic resonance (MR) angiography has marked clinical significance in patients with decreased renal function or allergies to contrast agents. The ability of non-contrast-enhanced MR angiography has been demonstrated by the combined use of a respiratory-triggered three-dimensional (3D) balanced steady-state free-precession (bSSFP) sequence with a time spatial labeling inversion pulse (Time-SLIP) (1,2). It was reported that bSSFP scanning with a tagging pulse using the flow-in method enabled selective visualization of the hepatic artery. In non-contrast-enhanced MR angiography with the flow-in method, a selective inversion recovery tagging pulse is used for selective suppression of the background, and the untagged fresh blood appears as a bright-blood signal. Inversion time (TI) is an important factor in image contrast (2,3). A short TI facilitates background signal suppression, as the liver parenchyma has a relatively short TI value compared with arterial blood; however, the inflow signal of the hepatic arteries remains weak due to insufficient time for arterial blood filling, making the technique unsuitable for peripheral vessel visualization. In contrast, a long TI is suitable for peripheral vessel delineation, but extended TI values deteriorate vessel-to-liver contrast because of signal recovery in the surrounding tissue. Therefore, in non-contrast-enhanced MR arteriography with the flow-in method, TI selection aims to strike a balance between vessel-to-liver contrast and peripheral hepatic artery visualization. In a previous study, a moderate TI, neither too short nor too long, was optimal for hepatic artery visualization on non-contrast-enhanced MR arteriography with the flow-in method (2,3); however, poor contrast and hepatic artery visualization was observed in some cases.
Recently, the flow-out method has been applied in non-contrast-enhanced MR angiography (4). The flow-out method uses both a non-selective inversion recovery pulse and a tagging pulse. The non-selective inversion recovery pulse inverts all magnetization in the region and is immediately followed by a spatially selective tagging pulse to selectively restore magnetization in the tagged region, thereby depicting tagged blood as a bright-blood signal (5). In non-contrast-enhanced MR arteriography with the flow-out method, when a selective tagging pulse with a long TI is applied, it is suitable for blood to fill in and for peripheral vessel visualization. A non-selective inversion recovery pulse using a short TI, which is near the null point in the background, effectively suppresses the background signal. Hence, we hypothesized that a flow-out method using a selective tagging pulse with a long TI and a non-selective inversion recovery pulse with a short TI (termed the modified flow-out method) might further suppress the background signal and facilitate improved visualization of the hepatic artery in non-contrast-enhanced MR arteriography. However, in previous studies, very similar TI values for a non-selective inversion recovery pulse and a tagging pulse have been selected for non-contrast-enhanced MR angiography with the flow-out method (4). The aim of this study was to compare the flow-in and modified flow-out methods using a selective tagging pulse with a long TI and a non-selective inversion recovery pulse with a short TI and to determine which method better visualizes the hepatic artery, especially its peripheral branch.
Material and Methods
Participants
This study was conducted in accordance with the ethical standards of the World Medical Association (Declaration of Helsinki). From September 2013 to May 2014, 27 healthy adults (17 men, 10 women; age range, 25–48 years; average age, 32.5 years) were included in this prospective study. The institutional review board approval and informed consent were obtained from all participants before their magnetic resonance imaging (MRI) examinations. All participants were instructed not to eat during the 6 h preceding the scan.
MRI equipment
All examinations were performed with the participant in the standard supine position using a 3-T MR unit (Toshiba Medical Systems Co, Otawara, Japan) equipped with a pair of phased array coil units placed at both the front and back, resulting in 16 channel outputs.
Non-contrast-enhanced MR arteriography
A respiratory-triggered 3D bSSFP imaging sequence was performed in the coronal plane with the following parameters: TR/TE/flip angle (FA), 4.8 ms/2.4 ms/120°; slice thickness, 1.5 mm; slice number, 60; no gap; field of view (FOV), 330 × 200 mm; matrix size, 256 × 128; number of acquisitions, 1; and acceleration factor, 2. The final images were reconstructed with an apparent spatial resolution of 0.6 × 0.6 × 0.75 mm. The short tau inversion-recovery method (TI = 220 ms) was used for fat suppression.
Application of the tagging pulse
Detailed sequence diagrams are shown and described in Fig. 1, while the tagged and untagged regions are presented in Fig. 2. The flow-in method was as follows: a selective inversion-recovery (IR) pulse with a 200-mm width was placed on the abdomen (Fig. 2a), the IR pulse can invert the spines of blood and background tissues prior to the data sampling sequence to minimize the undesirable inflow blood effects (including the splenic vein, superior mesenteric vein, and inferior vena cava). The superior border of the selective IR pulse was set approximately 8 cm cranial to the celiac trunk. Next, scout images were reviewed to prevent the hepatic artery that diverges directly from the aorta from being overlooked. A TI of 1600 ms was used to strike a balance between vessel-to-liver contrast and arterial inflow reaching the periphery. The modified flow-out method was performed as follows. A non-selective inversion recovery pulse was used to invert all magnetization in the region using a TI of 1400 ms. A tagging pulse was placed on the thorax in order to cover the heart and thoracic descending aorta, from which blood flows down into the abdominal aorta and hepatic artery, and to avoid the hepatic parenchyma (Fig. 2b). The width of this tagging pulse was 150 mm, and a TI of 1700 ms was used to allow the arterial inflow to reach the periphery.
(a) Sequence diagram of the flow-in technique, and the magnetization states of tagged and untagged signals. One selective IR pulse inverts all of the magnetization in the tagged region to –Mz and is followed by an exponential recovery, whereas untagged arterial blood flows in +Mz into the liver. When using a single TI that is neither very short nor very long, the artery-to-liver contrast (*) is insufficient. (b) Sequence diagram of the modified flow-out technique, and the magnetization states of tagged and untagged signals. An initial selective pulse (A) inverts all magnetizations in the tagged region to –Mz, followed by a non-selective pulse (B) that restores the magnetization at +Mz. One selective IR pulse inverts all magnetization in the untagged background to –Mz. Using the non-selective IR pulse with shorter TI, the artery-to-liver contrast (**) is sufficient. In both methods (a, b), prior to data acquisition, a prepulse; short-tau inversion pulse. The balanced SSFP sequence consists of a preparation pulse, dummy pulses, and fully balanced gradients in all three directions. Placement of the tagged regions and a non-selective pulse for selective visualization of the hepatic artery on the scout image. (a) In the flow-in method, one tagged region is placed to minimize the undesirable blood inflow effect (the rectangle indicates the imaging area). (b) In the modified flow-out method, a non-selective pulse inverts all magnetization in the region (the bold rectangle indicates the imaging area), while one tagged region is placed on the thorax (the rectangle indicates the imaging area).

Imaging analysis
In addition to the source images, maximum intensity projection (MIP) reconstructions were produced. The quantitative evaluation was conducted by a radiologist with 27 years of experience, and qualitative evaluations were performed by two experienced radiologists (with 15 years and 12 years of experience) who were blinded to the scan conditions. All of the quantitative and qualitative assessments of image quality were performed on a commercially available workstation (Ziostation, Ziosoft, Tokyo, Japan).
Quantitative evaluation
To compare the methods with respect to the contrast of the hepatic artery against the background, the signal intensity (SI) values for the right hepatic artery (RHA) and left hepatic artery (LHA) were compared with the SI of the surrounding liver parenchyma as a reference tissue. In the coronal source images, the region of interest (ROI) was placed manually in the RHA and LHA (5–10 mm2). The ROIs in the liver parenchyma were at least 20 mm2 and were chosen in homogenous, artifact-free areas adjacent to the RHA and LHA. Three ROIs were drawn at each position, and the mean SI values were then used for comparison. These values were used to calculate the relative SI, namely, the artery-to-liver contrast (Ca-l), according to the following equation: Ca-l = (SIa–SIro) / SIa (where ro = reference organ, i.e. liver, and a = RHA or LHA).
Qualitative evaluation
Visualization of the hepatic artery was scored on a 4-point scale (1, non-diagnostic; 2, fair; 3, good; 4, excellent) with respect to the main trunks of the RHA and LHA. Visualization at the periphery was evaluated at the branches of segments 4 and 8 (A4 and A8, respectively) using the same scale. The evaluators were also asked to score overall image quality based on the degree of whole-artery visualization, motion artifacts, and signal suppression of the background using a four-point scale (1, poor artery visualization with severe motion artifacts, insufficient background signal suppression, or both; 2, insufficient artery visualization with motion artifacts, residual background signal, or both; 3, sufficient artery visualization despite motion artifacts or residual background signal; and 4, good artery visualization with few or no motion artifacts and good background signal suppression). Disagreements between reviewers were resolved by discussion.
Statistical analysis
Statistical analysis was performed using MedCalc Statistical Software (version 12.4.0.0, MedCalc Software, Ostend, Belgium). The Ca-l values were compared using a paired t-test. The qualitative results of the two different protocol groups were compared using the Wilcoxon signed-rank test. A P value of < 0.05 was considered to indicate a significant difference.
Results
The means and standard deviations of quantitative and qualitative results.
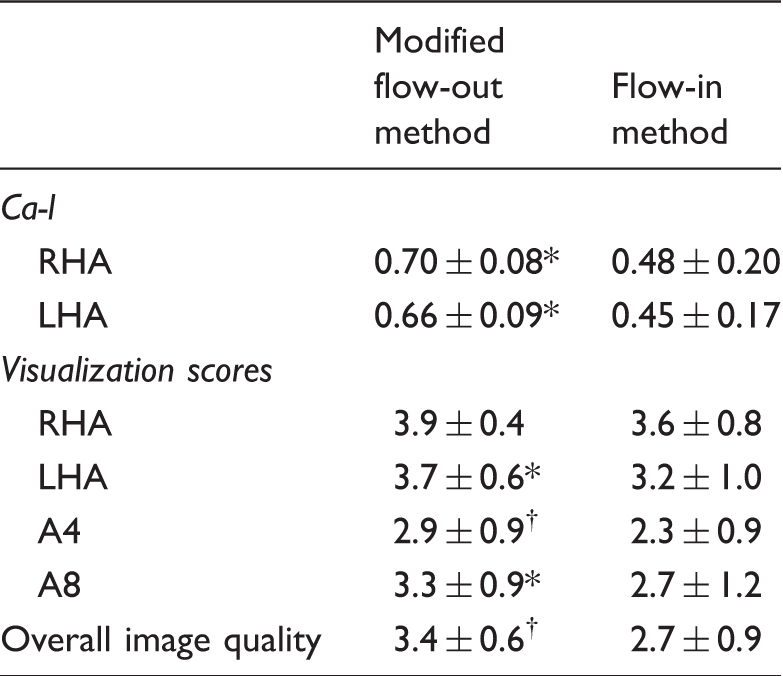
Significantly better than flow-in method (P < 0.05).
Significantly better than flow-in method (P < 0.01).
A4, arterial branch of segment 4; A8, arterial branch of segment 8; Ca-l, artery-to-liver contrast; LHA, left hepatic artery; RHA, right hepatic artery.
The image quality scores of the RHA, LHA, A4, and A8 were all better with the modified flow-out method than with the flow-in method. The differences between the two methods with respect to LHA, A4, and A8 visualization were statistically significant (P < 0.05 or P < 0.01). In terms of overall image quality, the modified flow-out method was significantly better than the flow-in method (P < 0.01) (Fig. 3).
Differences in image quality between the two methods. Non-contrast-enhanced MR arteriography in a 32-year-old woman, as acquired with (a) the flow-in and (b) the modified flow-out methods. The visualization of arterial branches is better with the modified flow-out method than with the flow-in method.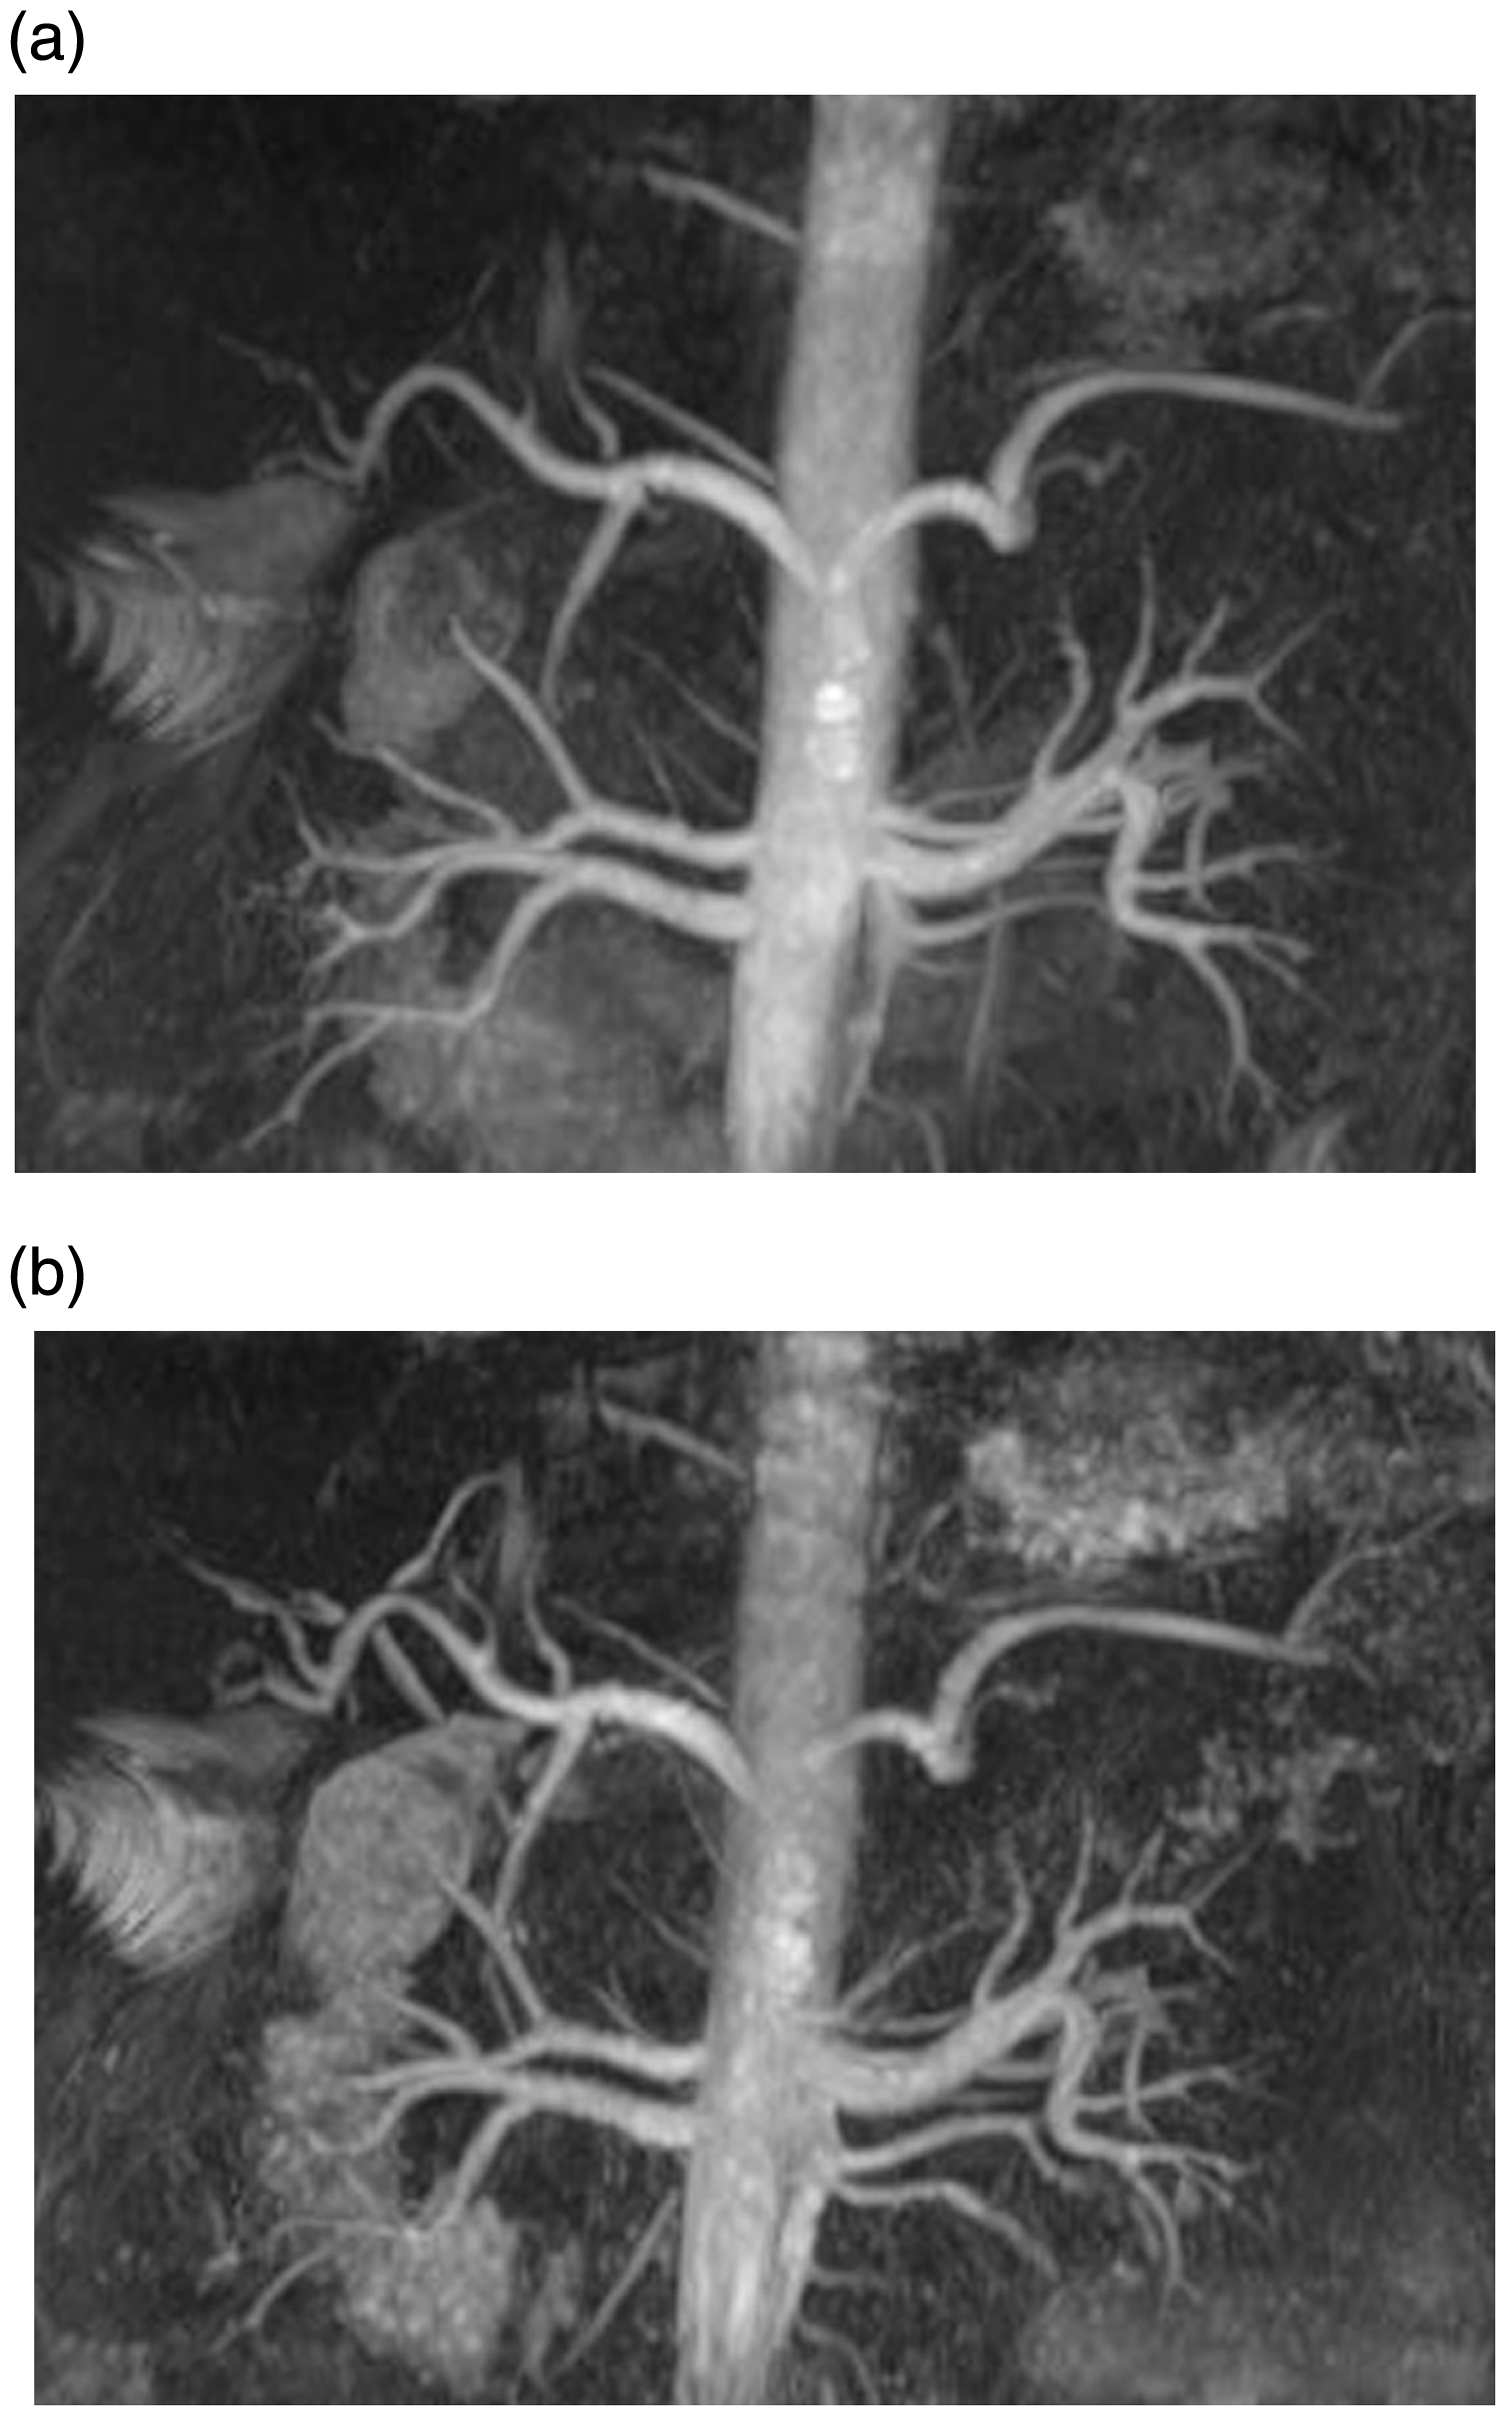
Discussion
In the present study, we introduced a new method, namely, non-contrast-enhanced MR arteriography with the modified flow-out method, to visualize the hepatic artery. Our quantitative analysis results showed that the Ca-l values were significantly increased with the modified flow-out method when compared with the flow-in method. Using visual analysis, we observed superior visualization of all arterial branches with the modified flow-out method. Finally, the overall image quality obtained with the modified flow-out method was significantly better than with the flow-in method.
We believe that the flow-out method has certain advantages over the flow-in method for visualizing the hepatic artery. First, an increase in the bright signal flow can be obtained using the flow-out method (4). On non-contrast-enhanced MR angiography using a Time-SLIP, a wider tagged region corresponds to a wider range of inverted spins outside the set tagged region. In the flow-in method, one tagging pulse is set widely, causing a decrease in blood flow signals into the liver. In the flow-out method, the tagging pulse need not be set widely to accurately restore the magnetization in the tagged region, which results in an increase in the bright signal. Second, two inversion pulses, namely, one non-selective inversion recovery pulse and one selective tagging pulse, can be applied with the flow-out method (4). These inversion pulses can be set independently. It is difficult to obtain both background signal suppression and sufficient peripheral vessel visualization using a single TI, yet only one selective inversion recovery tagging pulse can be applied in the flow-in method. An inversion pulse with a relatively short TI is desirable for the suppression of background signal, while an inversion pulse with a long TI is more suitable for peripheral vessel visualization. However, the non-selective inversion recovery pulse with a shorter TI and the selective tagging pulse with a longer TI in the flow-out method are ideal for increasing artery-to-background contrast. Thus, the modified flow-out method for non-contrast-enhanced MR angiography is a promising technique for visualizing the hepatic artery; to our knowledge, there has been no study demonstrating the applicability of this technique.
The liver parenchyma has a relatively short TI value compared with arterial blood (6), indicating that a shorter TI may contribute to the suppression of background signal. We suggest that the improvement in Ca-l and in the visualization scores when using the modified flow-out method may be ascribed to the decrease in background signal resulting from a non-selective inversion recovery pulse with a shorter TI. We consider that the improvement of visualization scores with the modified flow-out method for non-contrast-enhanced MR arteriography is also due to the increase in the bright signal flow from a selective tagging pulse with a longer TI, which allows the arterial flow to reach more peripheral areas.
Our study has multiple limitations. The first, main limitation is the absence of a reference standard with which to compare the results of our qualitative analysis. Ideally, a hepatic arteriogram or surgical exploration would have provided a more definitive determination of hepatic arterial anatomy in each participant. However, this study was performed on healthy volunteers, and further invasive testing or surgery was not justifiable or feasible. Second, only healthy adults were examined in this study. However, this study aimed to compare two imaging methods, and so the use of healthy participants may not constitute a significant issue.
In conclusion, use of the modified flow-out method in non-contrast-enhanced MR arteriography improved artery-to-liver contrast and offered better image quality relative to the flow-in method. This improved technical approach may be considered applicable for clinical use, especially for the preoperative assessment of donors for liver transplantation or for liver resection patients with allergies to contrast agents.
Footnotes
Acknowledgements
The authors thank all volunteers who were willing to participate in our study. The authors also thank Mr Hiroshi Kusahara (Toshiba Medical Systems Corporation), Ms Ayako Ninomiya (Toshiba Medical Systems Corporation), and Kyoko Takakura (Kyoto University Graduate School of Medicine) for their excellent technical assistance. Kaori Togashi, the Head of Department, takes overall responsibility for all aspects of the study.
Declaration of Conflicting Interests
The author(s) declared no potential conflicts of interest with respect to the research, authorship, and/or publication of this article.
Funding
The author(s) received the following financial support for the research, authorship, and/or publication of this article: this study was supported by a sponsored research program, “Researches for improvement of MR visualization (no. 150100700014)” provided to one of the authors, Professor Kaori Togashi, by Toshiba Medical Systems Incorporated, Japan.