



Abstract
Background
Due to improved ultrasound scanners, new three-dimensional (3D) modalities, and novel Anti-Müllerian hormone (AMH)-assays, the ultrasound criteria for polycystic ovarian morphology are under debate and the appropriate thresholds are often requested.
Purpose
To quantify the differences in estimates of ovarian volume and antral follicle count (AFC) from two-dimensional (2D) and 3D transvaginal ultrasound (TVUS) and magnetic resonance imaging (MRI).
Material and Methods
A cross-sectional study on 66 overweight women with polycystic ovary syndrome (PCOS) according to Rotterdam criteria. Ovarian volume and AFC were estimated from MRI, 2D TVUS, and 3D TVUS, and serum AMH levels were assessed. Bland–Altman statistics were used for comparison.
Results
Participants had a median age of 29 years (age range, 19–44 years) with a mean BMI of 32.7 kg/m2 (SD 4.5). Ovarian volume from 2D TVUS was 1.48 mL (95% confidence interval [CI], 0.94–2.03; P < 0.001) and 1.25 mL (95% CI, 0.62–1.87; P < 0.001) smaller than from 3D TVUS and MRI, respectively. AFC from 2D TVUS was 18% (95% CI, 13–23; P < 0.005) and 16% (95% CI, 6–25; P < 0.005) smaller than estimates from 3D TVUS and MRI, respectively. Correlations between AMH and AFC from 2D TVUS, 3D TVUS, and MRI were 0.67, 0.78, and 0.70, respectively (P < 0.001 for all).
Conclusion
In an overweight PCOS population, 2D TVUS underestimated ovarian volume and AFC as compared with 3D TVUS and MRI. Serum AMH correlated best with AFC from 3D TVUS, followed by MRI and 2D TVUS. The advantage of 3D TVUS might be of minor clinical importance when diagnosing PCOS, but useful when the actual AFC are of interest, e.g. in fertility counseling and research.
Keywords
Introduction
Polycystic ovary syndrome (PCOS) is a common disorder among women of reproductive age, with prevalence of 5–10% (1,2). The syndrome is an exclusion diagnosis defined by minimum of two out of the three Rotterdam criteria: oligo-/anovulation, hyperandrogenism, and polycystic ovaries (PCO) on transvaginal ultrasound (TVUS) (1). Since the criteria were established in 2003 there has been a significant development of ultrasound scanners, and the diagnostic PCO criteria are under discussion. This is an ongoing debate with several proposals of higher thresholds for the antral follicle count (AFC) (2–4) as well as suggestions of using Anti-Müllerian hormone (AMH) as a biochemical marker of PCO (2). AMH is secreted by the granulosa cells of early developing follicles and serum levels correlate highly with AFC (2).
As PCOS is associated with infertility, psychiatric disorders, and metabolic co-morbidities (5), an accurate and certain diagnosis is important. Due to this, and since ovarian morphology remains pivotal for the PCOS diagnosis, we are in need of a reliable, precise imaging method as well as new thresholds for ovarian volume and AFC when using up-to-date two-dimensional (2D) scanners and newer three-dimensional (3D) modalities. Moreover, validation of 2D and 3D TVUS with a gold standard seems appropriate. Previously two studies have evaluated TVUS ovarian volume estimates with the gold standard of Archimedes’ principle after oophorectomy (6,7). Oophorectomy is uncommon in young women and studies comparing TVUS with ex-vivo specimens are rare. Magnetic resonance imaging (MRI) has an advantage when examining adolescents and obese women, has high resolution and no radiation risk and might serve as a gold standard. Several studies on ovarian morphology in 3D TVUS (4,8,9) and MRI (10,11) are published, only one comparing the modalities in adults (12). 2D and 3D TVUS are readily compared with respect to ovarian morphology, predominantly in non-PCOS populations (13–16).
The question of which thresholds to be used with improved imaging modalities is often raised. Therefore, we aimed to compare estimates for ovarian volume and AFC from 2D and 3D TVUS with MRI as a gold standard and to quantify differences between the modalities. Furthermore, we investigated the correlation between serum AMH and AFC from the three modalities.
Material and Methods
Design
This is a cross-sectional study using baseline data from a randomized clinical trial (clinicaltrials.gov: ncto2073929) at Herlev Gentofte Hospital, University of Copenhagen, Denmark (17). Data were collected from March 2014 to December 2015. The trial was approved by the Danish Data Protection Agency and the regional Ethics Committee of the Capital Region of Denmark (ID: H2-2013-142, EudraCT: 2013-003862-15) and performed in accordance with General Clinical Practice guidelines and the declaration of Helsinki. All subjects gave oral and written consent prior to inclusion.
Population
Sixty-six women with PCOS according to the Rotterdam criteria (1) were recruited from social media, outpatient clinics and private practicing gynecologists. Inclusion criteria are published elsewhere (17). In brief they were age ≥18 years, premenopausal, body mass index (BMI) ≥25 kg/m2, and/or insulin resistance (fasting proinsulin c-peptide >600 pmol/mL). Exclusion criteria were pregnancy or breastfeeding, smoking >10 cigarettes/day, diabetes, hypertension, cancer, and inflammatory disease. The use of hormonal contraceptives within six weeks prior to assessment and/or antidiabetic or antiandrogenic medications within three months prior to assessment led to exclusion. Prior to inclusion, participants had a medical interview, a physical exam, including 2D TVUS, and blood tests to confirm the PCOS diagnosis and to rule out other etiologies to irregular bleeding and hyperandrogenism. PCOS was defined as ≥12 follicles (2–9 mm) and/or volume >10 mL, in at least one ovary assessed by 2D TVUS (1). TVUS and MRI were performed on the same day, within 4 h, after an overnight fast. Follicles of 2–9 mm were included in the AFC. One woman had a 3.2 mL ovarian cyst, which was subtracted from the total volume in TVUS and MRI estimates.
2D and 3D transvaginal ultrasound
TVUS were performed by the same observer (MN) using a Voluson E6 scanner, with a 5–9 MHz vaginal transducer (GE Healthcare, Chicago, IL, USA). The investigator was blinded to the MRI results. For 2D volume estimates, measurements of the maximal longitudinal, transverse, and anteroposterior diameter were obtained from two images, perpendicular to each other. Volume was calculated using the formula for an ellipsoid: v = length × width × height × 0.523. AFC was estimated in two sweeping motions from margin to margin in two planes perpendicular to each other. The mean of the two AFC was recorded.
3D data were obtained with the 3D facility, where an automatic swipe (angle 90°) through the ovary collects multiple 2D images for construction of a 3D set. The 3D data were post-processed offline using the software program 4D View (GE Healthcare). For ovarian volume the “Virtual Organ Computer-aided Analysis” tool (VOCAL) was used, where outlining the contour of the ovary in 12 image sections rotating in 15° steps around the y-axis creates a 3D model. The software calculates the volume inside the marked contour (Fig. 1). The AFC from 3D data was obtained with the “Sonography-based Automated Volume Count” tool (SonoAVC). SonoAVC detects and color-codes hypo-echogenic areas (follicles) in the dataset and provides estimates of dimensions and volume for each of them (Fig. 1). Images can be post-processed manually, e.g. if follicles are missed out or if multiple follicles are perceived as one by the SonoAVC tool. Hence, AFC estimation with SonoAVC was “semi-automatic.” 3D data were analyzed blinded to the 2D TVUS results, at least two weeks after the TVUS.
3D transvaginal ultrasound. (a) The VOCAL tool, used for estimation of ovarian volume; (b) the SonoAVC tool, used for estimation of antral follicle count.
MRI
MRI scans were performed using an Achieva 3.0 T MR Imaging System (Philips Medical systems, Best, The Netherlands) and a sense cardiac coil. T2-weighted axial slices (2 mm) in the transverse plane of the lower abdomen and pelvis obtained images for estimation of ovarian volume and AFC. Images were analyzed on a Philips ViewForum workstation (Philips Medical systems) using “Segmentation tool” in “Volume analysis.” A single observer (AB), who was blinded to the TVUS results, analyzed all images. The ovarian contour was outlined in 2 mm thick sections and volume was automatically calculated from the areas of the sections. For AFC estimates follicles were counted, scrolling through the 2 mm sections.
Anti-Müllerian hormone
Blood samples were drawn between 08:00 and 10:00 on the day of scanning. After overnight fasting and 15 min in a seated position, blood was drawn from an antecubital vein, centrifuged, and stored at −80℃ until analysis. Serum AMH was quantified using an ultra-sensitive AMH/MIS ELISA, AL-105-i (Ansh Labs, Webster, TX, USA), with intra-assay CV <2.0% and inter-assay CV 2–4%.
Statistical analysis
Statistical analysis was performed using SAS Enterprise Guide 7.1 (SAS Institute Inc., Cary, NC, USA). A power calculation declared 60 ovaries needed for 80% power to find a 1.7 mL difference in ovarian volume between modalities. A difference of 1.7 mL was chosen since the only study comparing ovarian volumes from TVUS and 3D MRI found a mean difference of 1.7 mL (12). Distribution of data was checked using histograms and probability plots. Normally distributed data are presented as mean (SD) and non-normally distributed data as median (range). Paired t-tests were performed to assess mean differences in ovarian volume and AFC, between modalities. Mean difference and 95% limits of agreement (±1.96 SD) between MRI and 2D TVUS are presented in Bland–Altman plots (18). Similar plots were constructed with 3D TVUS data as well as with logarithmic transformed AFC data. Percentage differences were calculated from logarithmic numbers. Correlations were determined with Spearman’s correlation coefficient and a multiple regression analysis with AFC from the different modalities as dependent variable and serum AMH, BMI, and age as covariates was performed.
For estimation of intra-observer reliability, ten randomly selected 3D datasets and ten MRI datasets were re-evaluated at least two months from first analysis. Intra-observer reliability was determined using intraclass correlation coefficients (ICC 2,1) from a two-way random effects ANOVA (absolute agreement) performed with IBM SPSS Statistics 22 (IBM, Armonk, NY, USA). Due to dependency of the volume and AFC of the ovaries within one subject, analyzing both ovaries of each woman would result in an incorrect doubling of the sample size. This would lead to underestimation of variances of the outcomes and thereby affect statistical tests and confidence intervals, therefore every second woman included contributed with her left ovary and every other with her right ovary. If the ovary was missing or contained a corpus luteum or larger follicle the contralateral ovary was chosen for analysis.
Results
Sixty-six women were included (Fig. 2); 95% were Caucasian with a median age of 29 years (range, 19–44 years), mean BMI 32.7 (4.5) kg/m2, and median AMH 69.8 pmol/L (range, 9.3–260.5 pmol/L). Of the women, 41% fulfilled all three Rotterdam criteria, 1% had oligo/anovulation + hyperandrogenism, 35% had oligo/anovulation + PCO, and 23% had hyperandrogenism + PCO. In total, 129 ovaries were identified with TVUS, 132 with MRI, and 66 paired observations (i.e. ovaries) were used for analysis. Due to technical problems, AFC data from 3D TVUS were missing in four cases.
Participant flow with regard to collection of TVUS and MRI data.
Ovarian volume
Differences in estimates of ovarian volume and AFC.
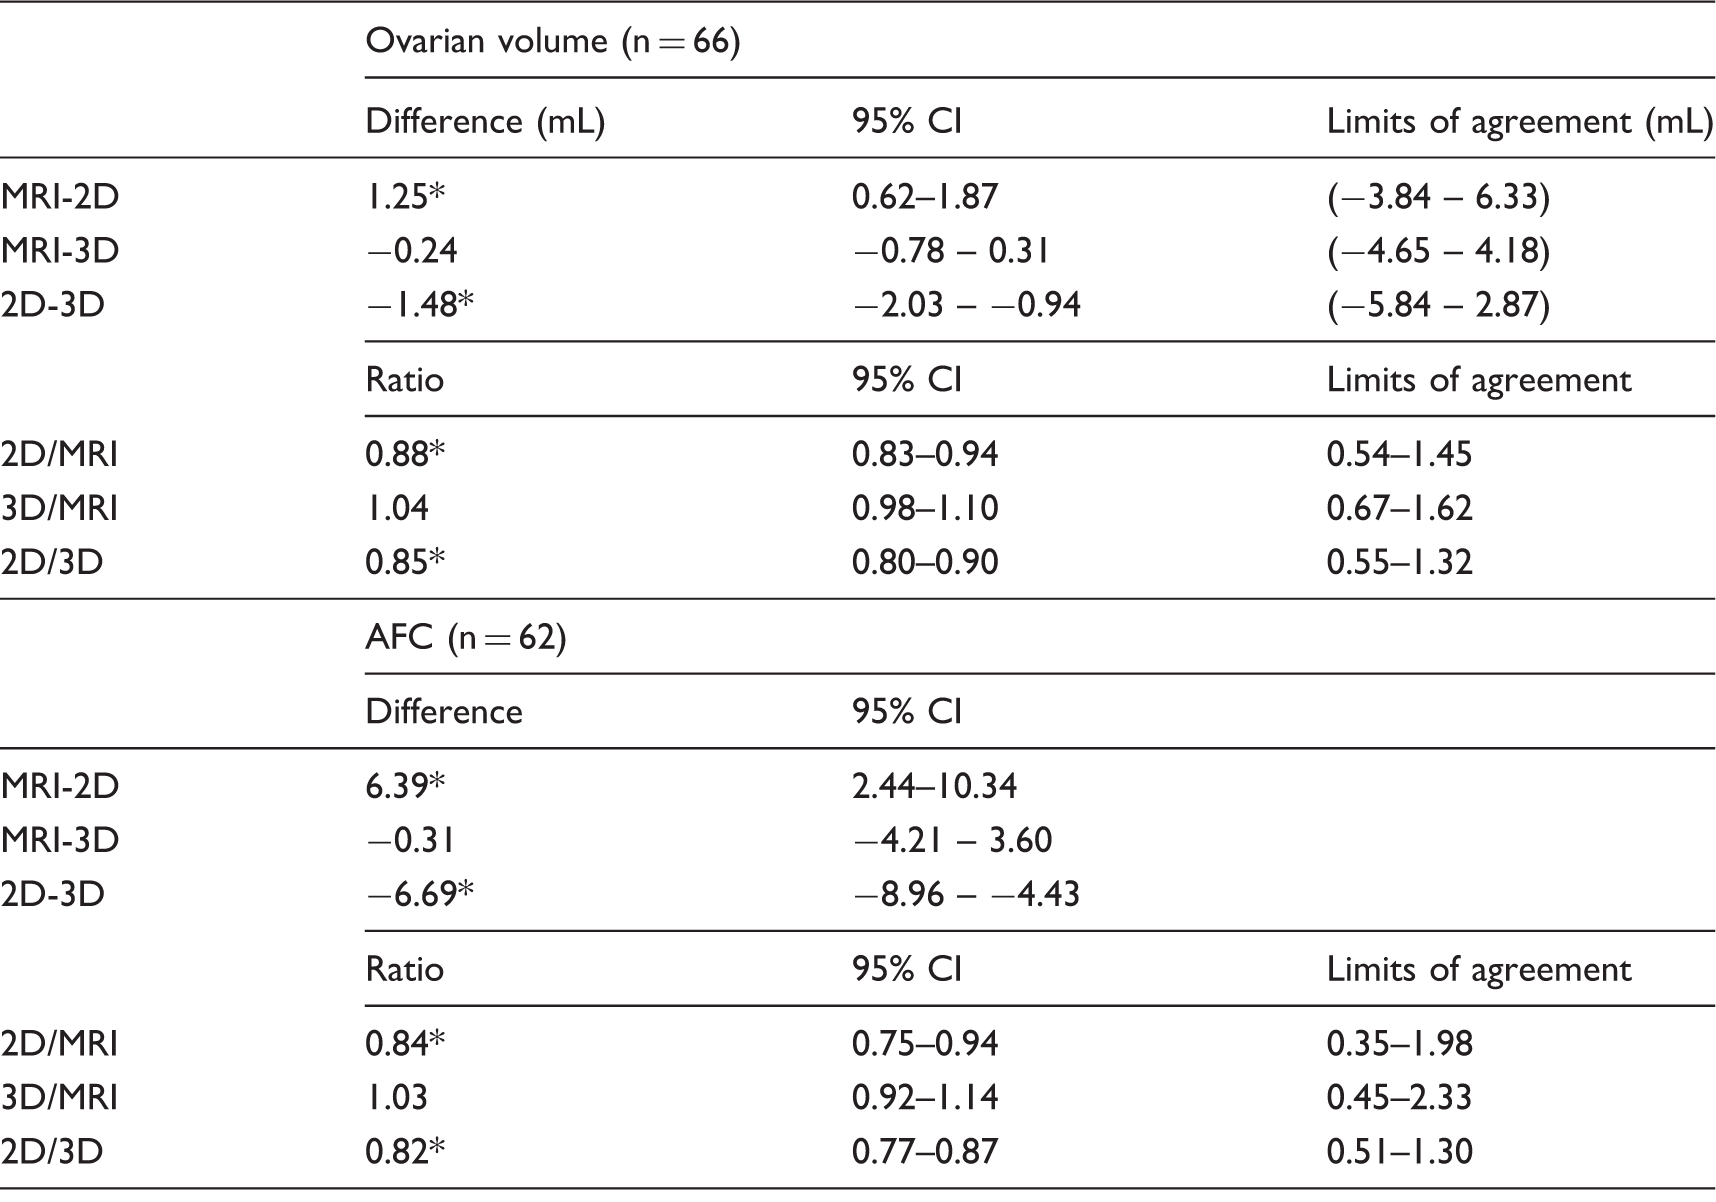
Mean differences are determined using a paired t-test and ratios are assessed from logarithmic transformed data. Data are presented as mean with 95% CI (±1.96 SEM) and limits of agreement (±1.96 SD).
P < 0.005.
2D, two-dimensional transvaginal ultrasound; 3D, three-dimensional transvaginal ultrasound; AFC, antral follicle count; CI, confidence interval; MRI, magnetic resonance imaging; SD, standard deviation; SEM, standard error of the mean.

Difference in ovarian volume. Bland–Altman plots showing mean (x-axis) and difference (y-axis) in ovarian volume between modalities. Full line marks mean difference and dashed lines mark 95% limits of agreement (±1.96 SD).
Antral follicle count
Median (range) AFC was 26.5 (4–64) by 2D TVUS, 29 (7–97) by 3D TVUS, and 29 (4–98) by MRI. Bland–Altman plots showed increasing differences with increasing AFC for all comparisons (Fig. 4). Bland–Altman statistics performed on logarithmic transformed data showed that 2D TVUS estimates were 18% (95% CI, 13–23; P < 0.005) smaller than 3D TVUS estimates and 16% (95% CI, 6–25; P < 0.005) smaller than MRI estimates (Table 1). Analyses, excluding ovaries not fulfilling the PCO criteria (n = 58) gave analogous results. For AFC, intra-observer ICCs for 3D TVUS and MRI were 0.987 (0.966–0.0995) and 0.691 (0.026–0.897), respectively. Serum AMH correlated with AFC from 2D TVUS, 3D TVUS, and MRI, r = 0.67, 0.78, and 0.70 (P < 0.001 for all), respectively. The β-coefficients from multiple linear regression analyses with AMH, BMI, and age as covariates were 0.13 (95% CI, 0.09–0.17; P < 0.001), 0.22 (95% CI, 0.17–0.28; P < 0.001), and 0.18 (95% CI, 0.11–0.25; P < 0.001) for AFC from 2D TVUS, 3D TVUS, and MRI, respectively. BMI did not have a statistically significant effect on the results, but was kept in the model.
Difference in antral follicle count. Bland–Altman plots showing mean (x-axis) and difference (y-axis) in antral follicle count between modalities. Full line marks mean difference and dashed lines mark 95% limits of agreement (±1.96 SD).
Rotterdam criteria
With 2D TVUS, 60 of the 66 women (91%) had polycystic ovaries according to the Rotterdam ultrasound criteria (≥12 follicles [size range, 2–9 mm and/or volume > 10 mL]). Corresponding numbers for 3D TVUS were 63 out of 66 (95%).
Discussion
In this cross-sectional study on 66 women with PCOS, we found 2D TVUS to underestimate ovarian volume and AFC compared with 3D TVUS and MRI, whereas estimates from 3D TVUS and MRI were similar.
The 3D approach seems to give more accurate and consistent volume estimates than 2D TVUS, illustrated by narrower limits of agreement when compared to MRI. To our knowledge, two studies have previously compared TVUS and MRI with respect to ovarian morphology (12,19) with conflicting results. In a mixed population (n = 99) volume estimates from 2D TVUS were 1.7 mL larger than from MRI and in 33 adolescents with PCOS, estimates from 2D US were smaller than from MRI (11.9 versus 8.8 mL) (19). Since the second study used either transvaginal or transabdominal US, results are difficult to interpret. One study found 0.33 mL smaller ovarian volume from 2D than 3D TVUS in 89 non-PCOS women (8), while others found no difference in a lean PCOS population (n = 112) (13) or in women undergoing in vitro fertilization treatment (n = 20) (20). 2D TVUS also seems to underestimate ovarian volume as compared with the true gold standard. In a study on 46 oophorectomy specimens volume estimates were 4.0 ml and 5.1 ml from 2D- and 3D TVUS, respectively, compared with 5.5 ml from Archimedes' principle (6). Accordant with this, another study found 27% smaller volumes from 2D TVUS than from Archimedes’ principle (7). However, the results might be influenced by the mean time between TVUS and oophorectomy (27 days; range, 1–141 days) and the fact that volumes were calculated based on the weight of the specimens and an ovarian tissue density calculated from Archimedes’ principle from 11 cases. True volume estimates were higher than estimates from TVUS, despite the fact that post-operative specimens were non-circulated (6,7).
While 2D TVUS assumes an ovoid shape of the ovary, the 3D modalities (TVUS and MRI) outline the contours of the ovary allowing a more precise estimation in irregularly shaped ovaries, as does the Archimedes’ principle.
AFC from 2D TVUS was 18% and 16% smaller than estimates from 3D TVUS and MRI, respectively. There was no difference between 3D TVUS and MRI, suggesting that 3D TVUS gives more accurate estimates of AFC than 2D TVUS. Narrower limits of agreement between 2D and 3D TVUS, than between 2D TVUS and MRI and between 3D TVUS and MRI suggest 2D and 3D TVUS are more consistent than 3D TVUS and MRI; probably because the TVUS modalities are more alike than the TVUS and the MRI. Diverging from our results, higher mean AFC was found with MRI (37.9 ± 20.3) than with 3D TVUS (SonoAVC) (23.6 ± 14.9) in 99 women with and without PCOS (12). This is probably because all 1–22 mm follicles were counted and follicles <2 mm can be difficult to distinguish in TVUS. In contrast to us, Deb et al. found higher AFC with 2D than with 3D TVUS (SonoAVC) in two studies with non-PCOS women (14,21). The second study used 3D TVUS images for 2D estimates, which may have resulted in overestimation of AFC compared with real-time 2D TVUS. The lower AFC in 3D TVUS (SonoAVC) may be due to color-coding of follicles, which prevents double counting thereby giving more accurate estimates. Post-processing of 3D data is important; Ignoring it leads to underestimation of AFC (21), which might be the reason why no difference in AFC was found between 2D and 3D TVUS in one of the largest studies comparing the modalities (n = 164) (13). Since different software is used for 3D AFC estimates and some authors scroll through offline 3D data for 2D AFC estimates, studies are not easily comparable. Moreover, many studies use estimates from both ovaries and as these observations are dependent the variance decreases, possibly causing inaccurate statistic conclusions.
Most studies examined normal populations or women undergoing assisted reproduction therapy. The risk of underestimating AFC is higher in ovaries with many follicles, which might explain why we, in a PCOS population, find wider limits of agreement than others. Studies evaluating AFC from 3D TVUS in non-PCOS populations present high inter-observer ICC, but decreasing ICC and wider limits of agreement with higher AFC (15,16,22). Our intra-observer ICCs for 3D TVUS was comparable with others’ and the inter-observer variation was eliminated as one observer performed all TVUS.
Serum AMH was highly correlated with AFC from all three modalities and results are comparable with previously reported correlations between AMH and AFC by 3D TVUS r = 0.75 (follicle size, 2–9 mm) (23), 2D TVUS r = 0.627 (2–9 mm) (24), and MRI r = 0.84 (1–9 mm) (25).
This study has several strengths: a fairly large population, proper 3D software, and independent observations. However, there are some limitations. Adipose tissue is associated with poor image quality and the high BMI (mean 32.7 kg/m2) might have reduced overall image quality. Ideally examinations are performed in early follicular phase, which is difficult in an oligo/amenoreic population. It could be argued that this is without consequence as we are comparing modalities rather than describing a population.
In conclusion, 2D TVUS underestimated ovarian volume and AFC compared with 3D TVUS and MRI, in an overweight PCOS population. Moreover, serum AMH had higher correlation with AFC from 3D than from 2D TVUS. The advantage of 3D TVUS might be of minor clinical importance when diagnosing PCOS, but useful when the actual AFC is of interest, e.g. in fertility counseling and research.
Footnotes
Acknowledgments
The authors thank Tobias Wirenfeldt for statistical guidance, Helle Vibeke Hansen, Anne-Mette Hansen, and Annette Krogh for ultrasonographical training and expertise, and the personnel at the Fertility Clinic, Herlev Gentofte Hospital for their great support. We also thank the participants for their contribution to the study.
Declaration of Conflicting Interests
The author(s) declared no potential conflicts of interest with respect to the research, authorship, and/or publication of this article.
Funding
The author(s) disclosed receipt of the following financial support for the research, authorship, and/or publication of this article: MN was supported by a Faculty PhD scholarship from Faculty of Health and Medical Sciences, University of Copenhagen, throughout the study period. The study received a grant from the Danish Toyota Foundation to the 3D ultrasound equipment. The study uses baseline data from a randomized clinical trial, the LIPT-study (clinicaltrials.gov: ncto2073929), which received funding from Novo Nordisk A/S.