



Abstract
Background
Extracellular volume (ECV) has been histologically validated as a non-invasive quantitative index of myocardial fibrosis that does not require the use of contrast, which is contraindicated in patients with renal insufficiency.
Purpose
To evaluate the correlation between the contrast-free apparent diffusion coefficient (ADC) and ECV, an index of fibrosis.
Material and Methods
Twenty-four patients with systemic lupus erythematosus (SLE), who were predominantly women (mean age = 36 ± 12 years) and 12 normal participants (mean age = 38 ± 10 years) underwent cardiac magnetic resonance (CMR) via 3.0 T MR with T1 mapping. Diffusion-weighted imaging (DWI) and late gadolinium-enhanced (LGE) imaging served as the reference standards with which CMR was compared. The mean ADC, native T1, and ECV were calculated for each patient, and the correlations among these parameters were analyzed.
Results
Both SLE LGE-positive (LGE+) and SLE LGE-negative (LGE–) participants had higher native T1 values, ECV, and ADC than normal controls (P < 0.05). SLE LGE+ participants exhibited a higher ECV (0.31 ± 0.02) and ADC (2.44 ± 0.32 × 10⁻³ mm2/s) than SLE LGE– participants (p < 0.05); however, SLE LGE+ and SLE LGE– participants had similar native T1 values (1227 ± 48.81 ms versus 1174.70 ± 95.80 ms, respectively; P > 0.05). ADC values were positively correlated with increased ECV (R2 = 0.62) and native T1 values (R2 = 0.28) in all participants.
Conclusion
ADC measurements are a suitable alternative to ECV that may be used to assess and quantify myocardial fibrosis in patients with SLE.
Keywords
Introduction
A complicated inflammatory autoimmune illness, systemic lupus erythematosus (SLE) affects multiple organ systems, especially in young women (1). The incidence of cardiovascular illness in patients with SLE is significantly higher than that in the general population, and patients with SLE with cardiovascular disease have higher mortality than patients with SLE without cardiovascular disease (2). Active lupus accelerates cardiac disease-induced damage, which is usually a subclinical indolent process (1,3,4). Patients with SLE exhibit obvious clinical cardiovascular disease signs and are more likely to have symptoms of and die prematurely from cardiovascular disease-related illnesses than patients without SLE. Preventing cardiovascular disease-related death may be possible in patients with SLE in whom early myocardial variations have been accurately identified during the subclinical period of the disease.
Diffuse myocardial fibrosis, which is the main form of cardiovascular disease-related damage observed in patients with SLE, may present with chronic myocardial inflammation, microvascular dysfunction, recurrent ischemia-reperfusion injury episodes, and contraction band necrosis. However, it is difficult to identify diffuse fibrosis and myocardial inflammation clinically. Moreover, invasive tests, such as endo-myocardial biopsy, have a low sensitivity for the diagnosis of myocardial fibrosis, and suboptimal tissue sampling may limit the utility of endo-myocardial biopsy. Using cardiac magnetic resonance (CMR) to detect cardiomyopathy and its underlying causes has become increasingly popular among clinicians (5). Gadolinium contrast enhancement is delayed in CMR. Upon its injection, gadolinium can be used to image the extracellular space, which is enlarged in patients with myocardial fibrosis (6), using a new T1 mapping technique (7); thus, this sequence is useful in patients with SLE. Patients with SLE display histological signs of myocardial fibrosis, and extracellular volume (ECV) has been histologically validated as a non-invasive quantitative index of myocardial fibrosis (8–11); however, all of the above methods require contrast agents, and patients with SLE with lupus nephritis and renal insufficiency cannot be evaluated with the sequences. As shown in our previous studies (12), as well as three other previous studies (13–15), the sensitivity of diffuse myocardial fibrosis for the diagnosis of SLE is higher than that of other findings, and fibrosis severity in patients with SLE can be displayed with contrast-free diffusion-weighted CMR (DW-CMR). Asymptomatic patients with SLE are thought to display signs of subclinical cardiovascular damage, which is not detectable with the apparent diffusion coefficient (ADC). Therefore, in this study, we attempted to identify the relationships among the ADC, ECV and native T1 values to determine how these parameters are related to cardiac fibrosis.
Material and Methods
Patients
After obtaining approval from the appropriate institutional research ethics board, we obtained written consent from all the participants enrolled herein. Twelve normal controls (average age = 38 ± 10 years) and 24 patients with SLE (primarily women, average age = 36 ± 12 years) were selected from November 2014 to December 2015. In accordance with the modified categorization scheme of the American College of Rheumatology (16), all the participants enrolled in the study lacked signs of cardiac disease before and after they were diagnosed with SLE. Moreover, all the patients remained in remission during the study (17). The patients’ blood parameters remained stable; thus, they did not require medication changes within the first eight weeks of the study period. Of the 33 patients with SLE who were eligible for the study, 24 were included in the study. The other nine patients were excluded from the preliminary analysis (Fig. 1). Twelve healthy participants with a normal blood pressure and a low probability of left ventricular cardiomyopathy were included in the study as controls. Individuals with impaired liver function (alanine aminotransferase levels greater than twice the upper limit of normal), renal impairment (an estimated glomerular filtration rate <30 mL/min), and cardiac conditions, such as coronary artery disease, a previous history of cardiac events, CMR intolerance, heart failure, a previous history of myocarditis, contraindications to CMR, and arrhythmia on a 12-lead ECG, were excluded from the study. Patient data pertaining to the following parameters were recorded: renal function, body mass index, gender, age, and cardiovascular risk factors (smoking history, dyslipidemia, diabetes mellitus, and hypertension), as well as current immunosuppressive, antimalarial, and corticosteroid use. Sixty percent of patients with SLE were treated with oral steroids. Eleven patients (45.83%), including nine patients with a history of thromboembolic disease requiring long-term anticoagulation, had antiphospholipid syndrome. Additionally, eight patients (33.33%) were found to have proteinuria and were treated for the condition.
Flowchart summarizing the patient selection process.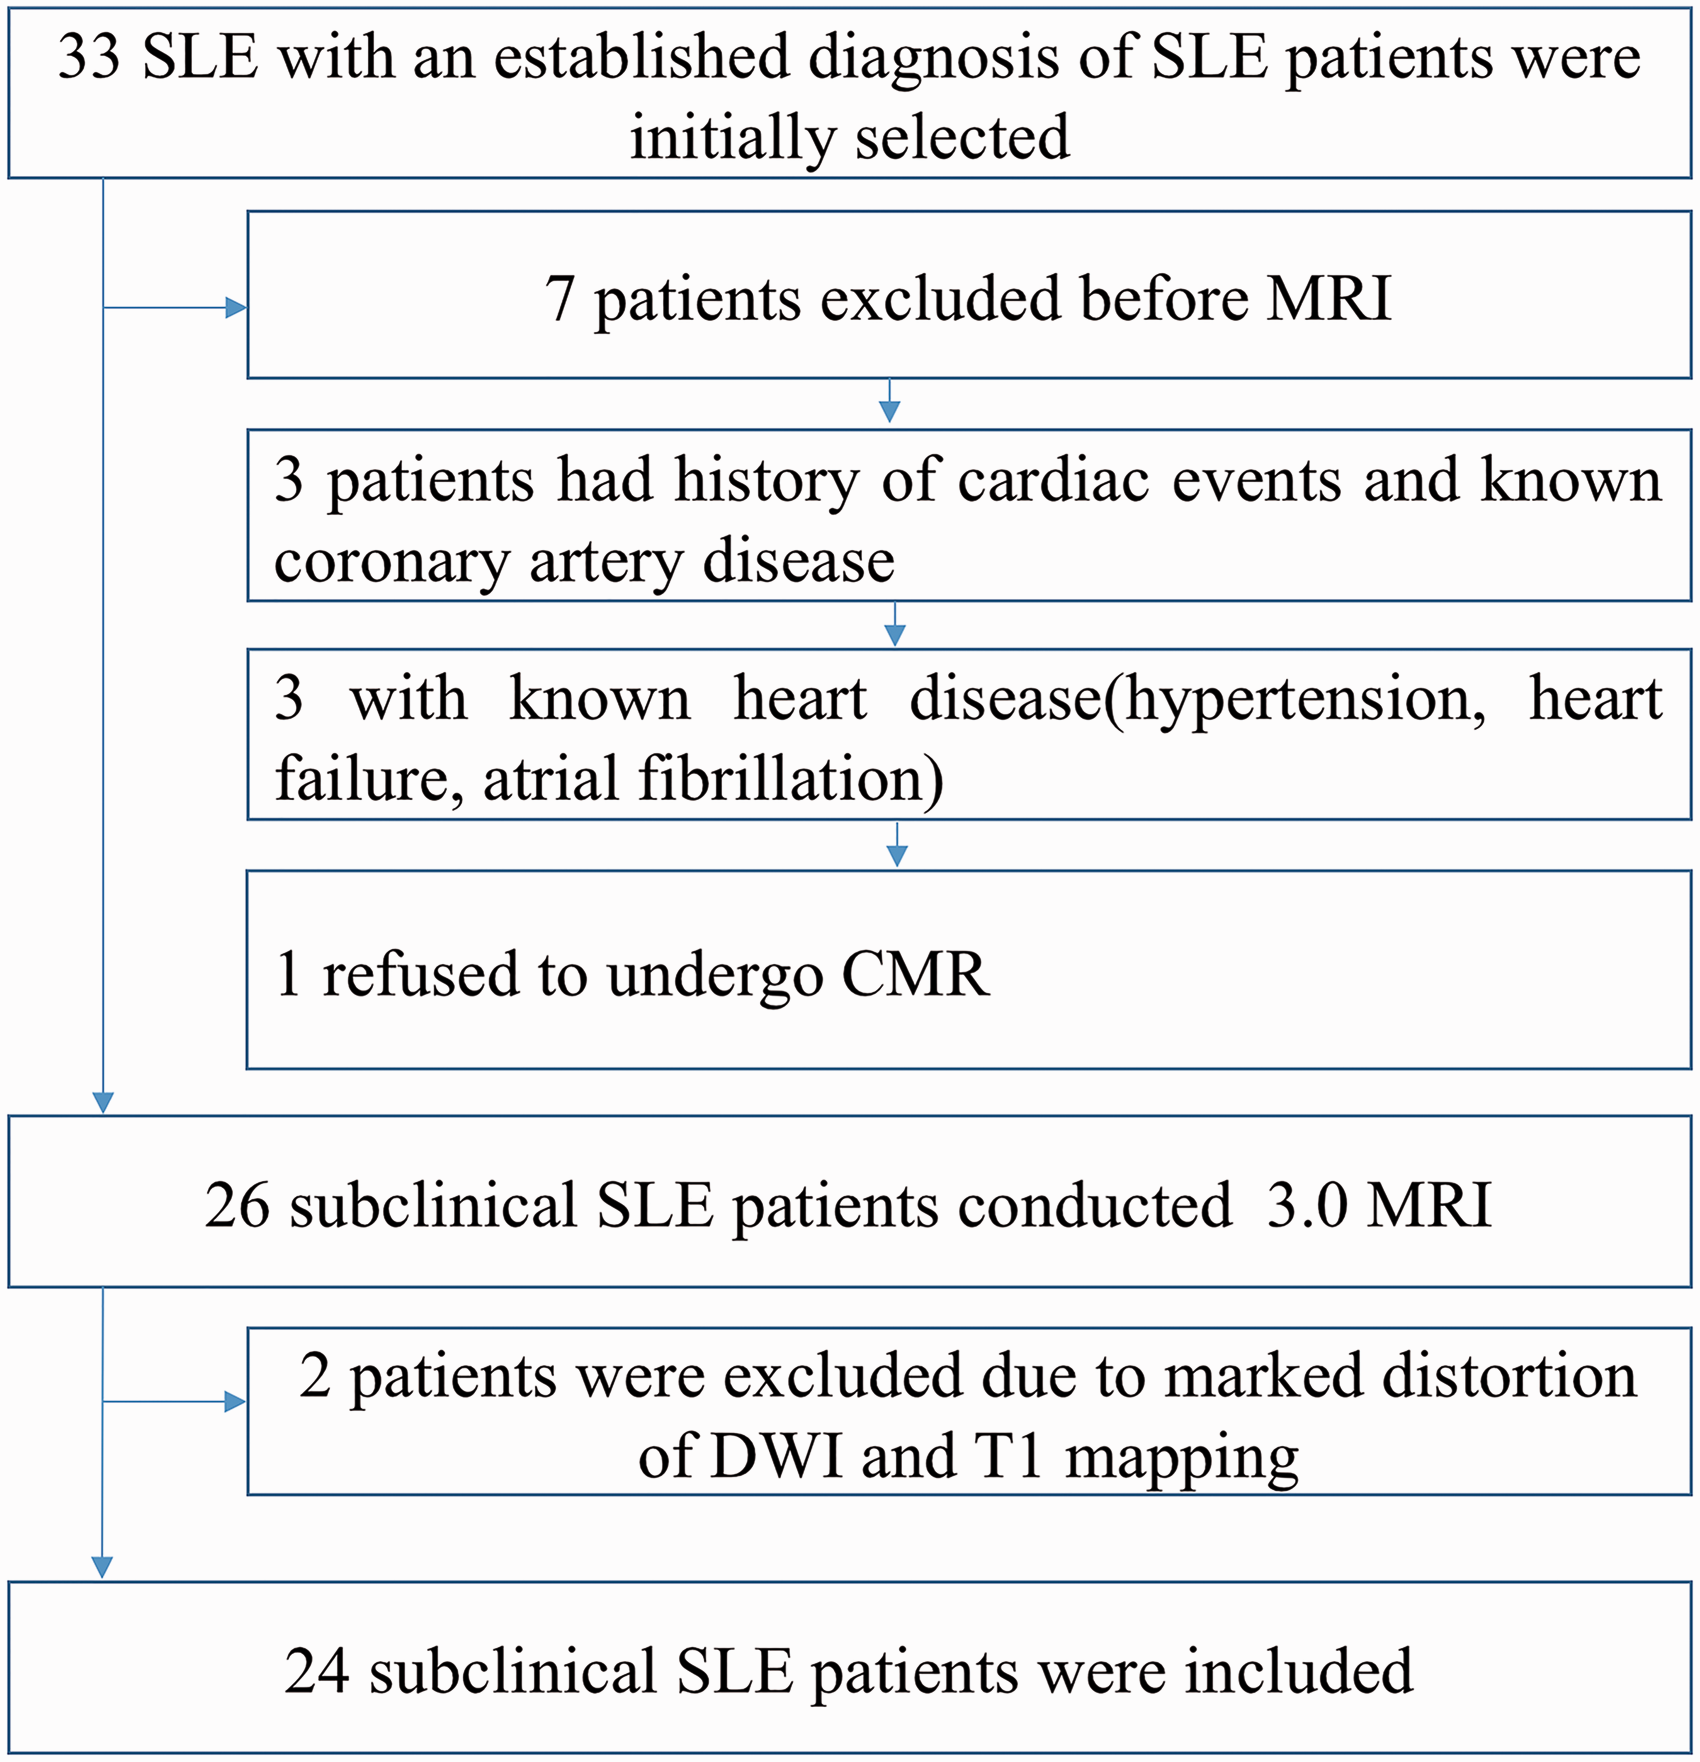
CMR protocol
CMR was performed using a 3.0 T MR machine from Ingenia, Philips Medical Systems, Best, The Netherlands, and free-precession cine imaging in the steady state was utilized to perform a left ventricle (LV) mass and functional analysis. The sequence parameters, namely, the repetition time (TR), echo time (TE), and flip angle (FA) were 2.8 ms, 1.4 ms, and 45°, respectively. The field of view (FOV) was 300 × 300 mm2 and was modified as needed to minimize artifacts; the voxel size was 1.2 × 1.2 × 7 mm3. The images were produced in the short and standard long axes. Additionally, T1 mapping (18) was performed using a modified look-locker inversion recovery (MOLLI) steady-state free precession (SSFP) and single-breath-hold method. Eight T1-weighted source pictures with over 11 heartbeats were generated with this scheme. The TE, TR, FA, FOV, and voxel size were 1.1 ms, 2.5 ms, 35°, 300 × 300 mm2, and 2 × 2 × 10 mm3, respectively. Gadopentetate dimeglumine (Gd-DTPA, 0.15 mmol/kg, Magnevist; Bayer Healthcare, Berlin, Germany) was intravenously injected into each patient, and post-T1 mapping was performed in the pre-contrast basal and mid-ventricular short-axis slices at 15 min after injection. Hematocrit (Hct) values were measured in each patient. Each patient was injected with a 0.15-mmol/kg bolus of Gd-DTPA, and the late gadolinium enhancement (LGE) images were obtained approximately 13 min thereafter using an inversion-recovery sequence sensitive to the 2D phase (in-plane resolution = 1.6 ×1.9 × 10 mm3, FA = 25°, TE = 3 ms, TR = 6.1 ms, and FOV = 300 × 300 mm2). DW-CMRI diffusion encoding was performed during the most quiescent period of the cardiac cycle using standard cine imaging (typically end-diastole or end-systole). Additionally, mapping was phased so that the LGE and T1 breath-hold positions could be matched through respiratory exhalation using a DW single-shot echo planar (EP) imaging sequence (one b0 image with three orthogonal diffusion directions, b = 350 s/mm2, and second-order motion compensation diffusion-prepared bSSFP) with the following parameters: section thickness = 10 mm, voxel size = 1.2 × 1.2 mm2, FOV = 230 × 230 mm, matrix =152 × 122, echo train length = 61, bandwidth =1449 Hz/pixel, TR/TE = 800/77 ms, and FA = 90°.
Data analysis
LMW and DALA have eight and three years of experience, respectively, and performed all the cardiovascular radiology analyses reported herein. A dedicated acquisition platform from Multimodality Workplace (Phillips Healthcare) was employed to analyze the DW pictures and ADC measurements, and a cvi42 (Circle Cardiovascular Imaging Inc., Calgary, Canada), was used for T1 mapping and ECV analysis. Each short-axis slice was obtained in the end-systolic and end-diastolic endocardial and epicardia cavity areas. The LV end-systolic volume (LVESV), end-diastolic volume (LVEDV), and mass, which were normalized to the body surface area, were subsequently determined. Cvi42 was used to measure the LV mass using the end-diastole image frames, which were assessed on a pixel-by-pixel basis using MOLLI data. A non-linear least-square plot of the signal intensity versus T1 was generated for T1 mapping. The slope of the 1/T1 plots depicting the relationship between the myocardium and blood was used to determine the partition coefficient (λ), and the data obtained from both the 15 min post-contrast and pre-contrast mid-ventricular and basal slices were fitted to the slope. ECV was then measured with the following formula: (1-Hct) × λ.
Statistical analysis
All continuous data were expressed as the mean ±standard deviation (SD), and all statistical analyses were performed using SPSS version 18 (SPSS IBM, Armonk, NY, USA). The Kolmogorov–Smirnov D test was used when homogeneity of variance was present and the data were normally distributed. Continuous variables were compared using bilateral Student’s t-tests when appropriate. Various variables were analyzed with ANOVA followed by Bonferroni correction. Myocardial fibrosis was identified using LGE imaging, which served as the gold-standard test for its diagnosis, and its severity was determined via ROC curve analysis. Spearman rank correlation coefficient was used to assess monotonic non-linear relationships; however, Pearson’s correlation coefficient was used to analyze linear associations. P < 0.05 was considered statistically significant.
Results
Patient characteristics
Baseline characteristics of the SLE LGE+ and SLE LGE– patients and normal controls.

Data are presented as n (%) for categorical variables and as the median ± standard deviation for continuous variables.
P < 0.05 vs. SLE LGE−.
P < 0.05 vs. controls.
Comparison of mean ECV, native T1 values, and ADC
Fibrosis detection in patients with SLE with the ADC, native T1 value, and ECV.

Values are mean ± SD, P < 0.05 vs. SLE groups.
SLE, systemic lupus erythematosus; ECV, extracellular volume; ADC, apparent diffusion coefficient.
Subgroup analysis and fibrosis detection with the ADC, native T1, and ECV.

Values are mean ± SD.
P < 0.05 vs. SLE (LGE+) group.
P < 0.05 vs. SLE (LGE–) group.
LGE+, late gadolinium enhancement imaging-positive; SLE, systemic lupus erythematosus; ECV, extracellular volume; ADC, apparent diffusion coefficient.

Representative images of a 38-year-old female SLE LGE+ patient. (a) LGE+ (white arrow) images, (b) native T1 mapping showing the fibrotic areas, which were not observed in the corresponding LGE– images. (white arrow), (c) ADC mapping showing the fibrotic areas, which were not observed in the corresponding LGE– images. (d–f) Representative images of a 29-year-old female SLE LGE– patient, (d) LGE– images, (e) native T1 mapping showing the fibrotic areas, which were not observed in the corresponding LGE+ images. (white arrow), (f) ADC mapping showing the fibrotic areas, which were not observed in the corresponding LGE+ images. (g–i) Representative images of a 39-year-old normal control participant, LGE– images (g), native T1 mapping showing normal tissue (h) and ADC mapping showing normal tissue (i).
Relationship among ECV, native T1 values, and ADC
As shown in Table 3, the ECV and ADC of the LGE+ subgroup were elevated compared with those of the normal and LGE– subgroups. As shown in Fig. 3a, ECV was well correlated with the ADC in all patients (R2 = 0.62, P < 0.01). Furthermore, the native T1 values were correlated with the ADC (R2 = 0.28, P < 0.01), as shown in Fig. 3b.
(a) ECV versus ADC. A positive correlation was observed between ECV and ADC (R2 = 0.62, P < 0.01). (b) A positive association was also observed between native T1 levels and the ADC (R2 = 0.28, P < 0.01). Abbreviations as in Fig. 1.
Inter-observer variability
Two independent observers performed a variability analysis, in which data for every participant were analyzed. Fig. 4 shows the Bland–Altman plots of the ADC, native T1 values, and ECV of all the participants. These plots demonstrated that the agreement between the abovementioned observers was good with respect to the measurement of the above variables.
Bland–Altman plots of inter-observer agreement with respect to the ECV, native T1, and ADC measurements. Bland–Altman plots demonstrating the presence of good interobserver agreement with respect to the ECV (a), native T1 (b), and ADC (c) measurements.
Discussion
In this study, we estimated the ability of DWI to detect diffuse myocardial fibrosis and elucidated the relationships among the ADC, ECV, and native T1 values in subclinical cardiomyopathy in patients with SLE. We found that myocardial fibrosis severity could be quantified using the ADC, which was strongly correlated with ECV and T1 mapping values. T1 values and myocardial tissue fibrosis were greater and more severe in patients with SLE than in participants without SLE. As the ADC is positively correlated with native T1 values (R2 = 0.28) and ECV (R2 = 0.62), the parameters in question could be used to quantify fibrosis in the corresponding group. Fibrosis severity was assessed via the ADC and ECV, as well as native T1 values, albeit to a limited extent, in the control and LGE– subgroups. Both ECV and ADC may be affected by high-order motion (19). However, ADC may be more strongly affected by tissue sectional heterogeneity than ECV because of differences in the signal-to-noise (SNR) ratio between fibrotic and non-fibrotic sections of the myocardium (20). In contrast, ECV may be affected by variations within non-fibrotic tissue to a greater extent than the ADC. Thus, fibrosis-induced variations in the intracellular and extracellular compartments of the myocardium may be evaluated via DWI-mediated measurements of ECV, which has been histologically validated as a non-invasive quantitative index of myocardial fibrosis (8–11). Variations in the extracellular compartment resulting from fibrosis were associated with particularly low DWI b-values attributed to the rapid exchange of water between the intracellular and extracellular compartments. Therefore, we were able to differentiate between the compartments even in absence of contrast. The differences between the ADC and ECV, as well as how these differences affect the ability of each parameter to quantify fibrosis, require further evaluation in future studies. Additionally, some the results obtained herein were inconsistent with the general understanding of cardiovascular pathophysiology, as well as the current understanding of the histopathologic changes characteristic of SLE (21).
In previous studies, the diffuse myocardial fibrosis-induced damage affecting patients with SLE was measured using cardiac DWI. We were able to duplicate these results, as mentioned above. Our results showed that the myocardial ADC is elevated in patients with SLE compared with control participants, a finding consistent with those of previous studies using T1 mapping to evaluate patients with SLE (12). DWI is a contrast-free imaging modality whose potential to detect myocardial fibrosis clinically has been evaluated in previous studies. Recent technological advancements have facilitated rapid improvements in MR techniques (high-gradient amplitudes, multichannel coils, and parallel imaging) and EP imaging that have enabled the use of diffuse imaging in CMR (12–14,19,22–25). DW-CMRI has been evaluated in four previous studies (12–14,22), which assessed its capacity to identify fibrotic tissue that has replaced healthy tissue. Fibrosis in patients with SLE patients can be recognized using the DW-CMR sequence, and the outcomes of patients whose diagnoses of fibrosis were made with DW-CMR have been compared with those of patients whose diagnoses were made using traditional CMR technology (22). The authors of the indicated study demonstrated that the ADC is apparently enhanced less in non-fibrotic areas than in fibrotic areas. In this study, we showed that the utility of ECV as an index of myocardial fibrosis is similar to that of DWI. DW-CMR is capable of differentiating between the individual foci of fibrotic tissues that have replaced normal tissues and diffuse fibrosis and is thus capable of providing accurate data with respect to native T1 mapping values and ECV, which may be used to quantity fibrosis severity.
LGE was performed in the present study, as was a subgroup analysis, in which DWI was used to study fibrosis of different severities in patients with SLE with and without LGE. We also compared the utility of ECV for the diagnosis of myocardial fibrosis in SLE with that of native T1 values. We determined that the b-values associated with cardiac DWI would make quantifying fibrosis with such values a challenging and demanding exercise. The b-values of intra-abdominal organs are in the range of 500–1000 s/mm2. Small b-values (50–100 s/mm2) correspond to a higher degreeof diffusion, which may occur in organ vessels containing flowing water molecules, as well as ischemic parenchyma affected by blood flow differentials. Thus, such values can serve as an indicator of tissue perfusion. However, in both normal (i.e. neurologic) and abnormal (i.e. tumor) cellular tissues, bright signals of approximately 1000 s/mm2 can reflect restricted diffusion. Some b-values within the range of 250–500 s/mm2 wereobserved in our study. We ultimately selected images whose b-value was approximately 350 s/mm2, as we deemed such images to be more useful than those whose b-values fell into the extreme ranges mentioned above.
There were some limitations to this study. First, histological validation was not performed in the current study, as endo-myocardial biopsy, whose sensitivity for the diagnosis of myocardial fibrosis is low, could not be performed in every patient. Furthermore, sub-optimal tissue sampling may limit the utility of endo-myocardial biopsy. Second, DW-CMR required that each patient complete an extensive series of preparatory steps to ensure that it provided optimal contrast-free T1 mapping-generated images and accurate ECV measurements. The results of this study were based on DW-CMR performed during the most quiescent period of the cardiac cycle; thus, it is unclear whether the images were affected by a lack of motion. The relatively low spatial coverage of the DWI sequence used herein (four 8-mm-thick slices, resulting in 32 mm of coverage) was another major weakness of the present study. Overall, DW-CMR achieved complete spatial coverage (∼80 mm) of the tissues of interest over a total scan time of at least 12.5 min. In cases of larger LV masses (∼100 mm), sufficient assessments require a minimum scan time of approximately 15 min in patients with SLE. Thus, this technology may restrict research designs. Furthermore, we could not perform a comprehensive assessment of LV fibrosis in this study.
In conclusion, ADC measurements are a suitable alternative to ECV that may be used to assess and quantify myocardial fibrosis in patients with SLE. Validation of the present results requires additional large prospective studies.
Footnotes
Author Contribution
Lian-Ming Wu (wlmssmu@126.com) and Jian-Rong Xu (xujrrenji@126.com) contributed equally to this article.
Declaration of Conflicting Interests
The author(s) declared no potential conflicts of interest with respect to the research, authorship, and/or publication of this article.
Funding
The author(s) disclosed receipt of the following financial support for the research, authorship, and/or publication of this article: This research was supported by National Natural Science Foundation of China (Youth Program No.81401403) and Shanghai Jiao tong University medical-engineering cross fund (YG2014MS48).