




Abstract
Background
Bone remodels in response to mechanical loads and osteoporosis results from impaired ability of bone to remodel. Bone microarchitecture analysis provides information on bone quality beyond bone mineral density (BMD).
Purpose
To compare subchondral bone microarchitecture parameters in the medial and lateral tibia plateau in individuals with and without fragility fractures.
Material and Methods
Twelve female patients (mean age = 58 ± 15 years; six with and six without previous fragility fractures) were examined with dual-energy X-ray absorptiometry (DXA) and 7-T magnetic resonance imaging (MRI) of the proximal tibia. A transverse high-resolution three-dimensional fast low-angle shot sequence was acquired (0.234 × 0.234 × 1 mm). Digital topological analysis (DTA) was applied to the medial and lateral subchondral bone of the proximal tibia. The following DTA-based bone microarchitecture parameters were assessed: apparent bone volume; trabecular thickness; profile-edge-density (trabecular bone erosion parameter); profile-interior-density (intact trabecular rods parameter); plate-to-rod ratio; and erosion index. We compared femoral neck T-scores and bone microarchitecture parameters between patients with and without fragility fracture.
Results
There was no statistical significant difference in femoral neck T-scores between individuals with and without fracture (–2.4 ± 0.9 vs. −1.8 ± 0.7, P = 0.282). Apparent bone volume in the medial compartment was lower in patients with previous fragility fracture (0.295 ± 0.022 vs. 0.317 ± 0.009; P = 0.016). Profile-edge-density, a trabecular bone erosion parameter, was higher in patients with previous fragility fracture in the medial (0.008 ± 0.003 vs. 0.005 ± 0.001) and lateral compartment (0.008 ± 0.002 vs. 0.005 ± 0.001); both P = 0.025. Other DTA parameters did not differ between groups.
Conclusion
7-T MRI and DTA permit detection of subtle changes in subchondral bone quality when differences in BMD are not evident.
Keywords
Introduction
Osteoporosis is a systemic skeletal disorder with increased risk of fragility fracture (1). The increased fracture risk is a result of reduced bone strength, which is caused by a decrease in bone mineral density (BMD) and deterioration in bone microarchitecture. Dual-energy X-ray absorptiometry (DXA) is used to measure areal BMD. Bone microarchitecture can be assessed in vivo using high-resolution peripheral quantitative computed tomography (HR-pQCT) (2,3) or high resolution magnetic resonance imaging (MRI) (4,5). Bone microarchitecture is a complex three-dimensional (3D) lattice composed of individual bony trabeculae that undergo changes detrimental to bone strength in the setting of osteoporosis. A disturbed balance in favor of osteoclastic bone resorption over osteoblastic bone formation results in thinning and erosion of trabeculae, a conversion of trabecular plates to rods, and perforation or microfracture of trabeculae (6,7). Altogether, this deterioration in bone microarchitecture weakens bone in patients with osteoporosis.
Early deterioration in bone microarchitecture may not necessarily translate into changes in areal BMD. Because areal BMD as assessed by DXA does not capture microarchitectural information, an important component of the definition of osteoporosis (microarchitectural deterioration) is not evaluated by DXA. Related to this, large cohort studies have shown that DXA is limited as a tool to differentiate between patients with and without fragility fracture, the main clinical outcome in osteoporosis (8). In fact, most patients with fragility fractures have T-scores >–2.5 and do not meet DXA criterion for an osteoporosis diagnosis (9,10). In order to image bone microarchitecture, submillimeter in-plane spatial resolution is needed to depict individual trabeculae. Compared to 1.5-T or 3-T, 7-T MR provides higher signal-to-noise ratio (SNR) and can permit imaging of bone in more proximal locations, such as the knee or the hip, which are limited by SNR due to their deeper anatomic location (11,12).
Wolff’s Law states that bone remodels in response to the mechanical loads placed upon it (13), and the Utah Paradigm, which was developed by Harold Frost et al. as an extension of Wolff’s Law, proposes that osteoporosis is due to an impaired ability of bone to remodel in response to such mechanical loads (14). In general, the medial compartment of the knee bears more mechanical loads than the lateral compartment (15). If in the setting of osteoporosis the mechanoresponse of bone is impaired, then this would predispose such bone to fragility fracture. Therefore, the purpose of our study was to assess bone microarchitecture within different subregions of bone in the proximal tibia. We hypothesized that bone microarchitecture would differ between participants with compared to those without fragility fractures.
Material and Methods
Patients
This study had institutional review board approval and we obtained informed consent from all participants. In total, we recruited 12 women (mean age = 58 ± 15 years [mean ± standard deviation]) from the Osteoporosis Center at our institution. Six patients had history of a confirmed fragility fracture of the spine, radius, sacrum, or hip (mean time since fracture = two months). Six patients had no previous fragility fracture. Body mass index (BMI) was calculated. DXA (GE Lunar, Rahway, NJ, USA) was acquired in all 12 patients. Femoral neck T-scores and lumbar spine T-scores were calculated.
MRI
The proximal tibia of all patients (right side n = 9, left side n = 3) was scanned on a 7-T whole-body MRI scanner (Siemens Magnetom, Siemens Healthcare, Erlangen, Germany) using a birdcage transmit, 28-channel receive array coil (Quality Electrodynamics, Mayfield Village, OH, USA). A 3D fast low angle shot (FLASH) sequence was implemented in the transverse plane using the following parameters: repetition time (TR) = 20 ms, echo time (TE) = 5.1 ms, field of view = 12 cm, flip angle = 10°, bandwidth = 130 Hz/pixel, matrix =512 × 512 with an in-plane resolution of 0.234 × 0.234 mm, slice thickness = 1 mm, parallel acceleration factor = 2, 80 axial slices, time of acquisition =7 min 9 s (12,16).
MRI analysis
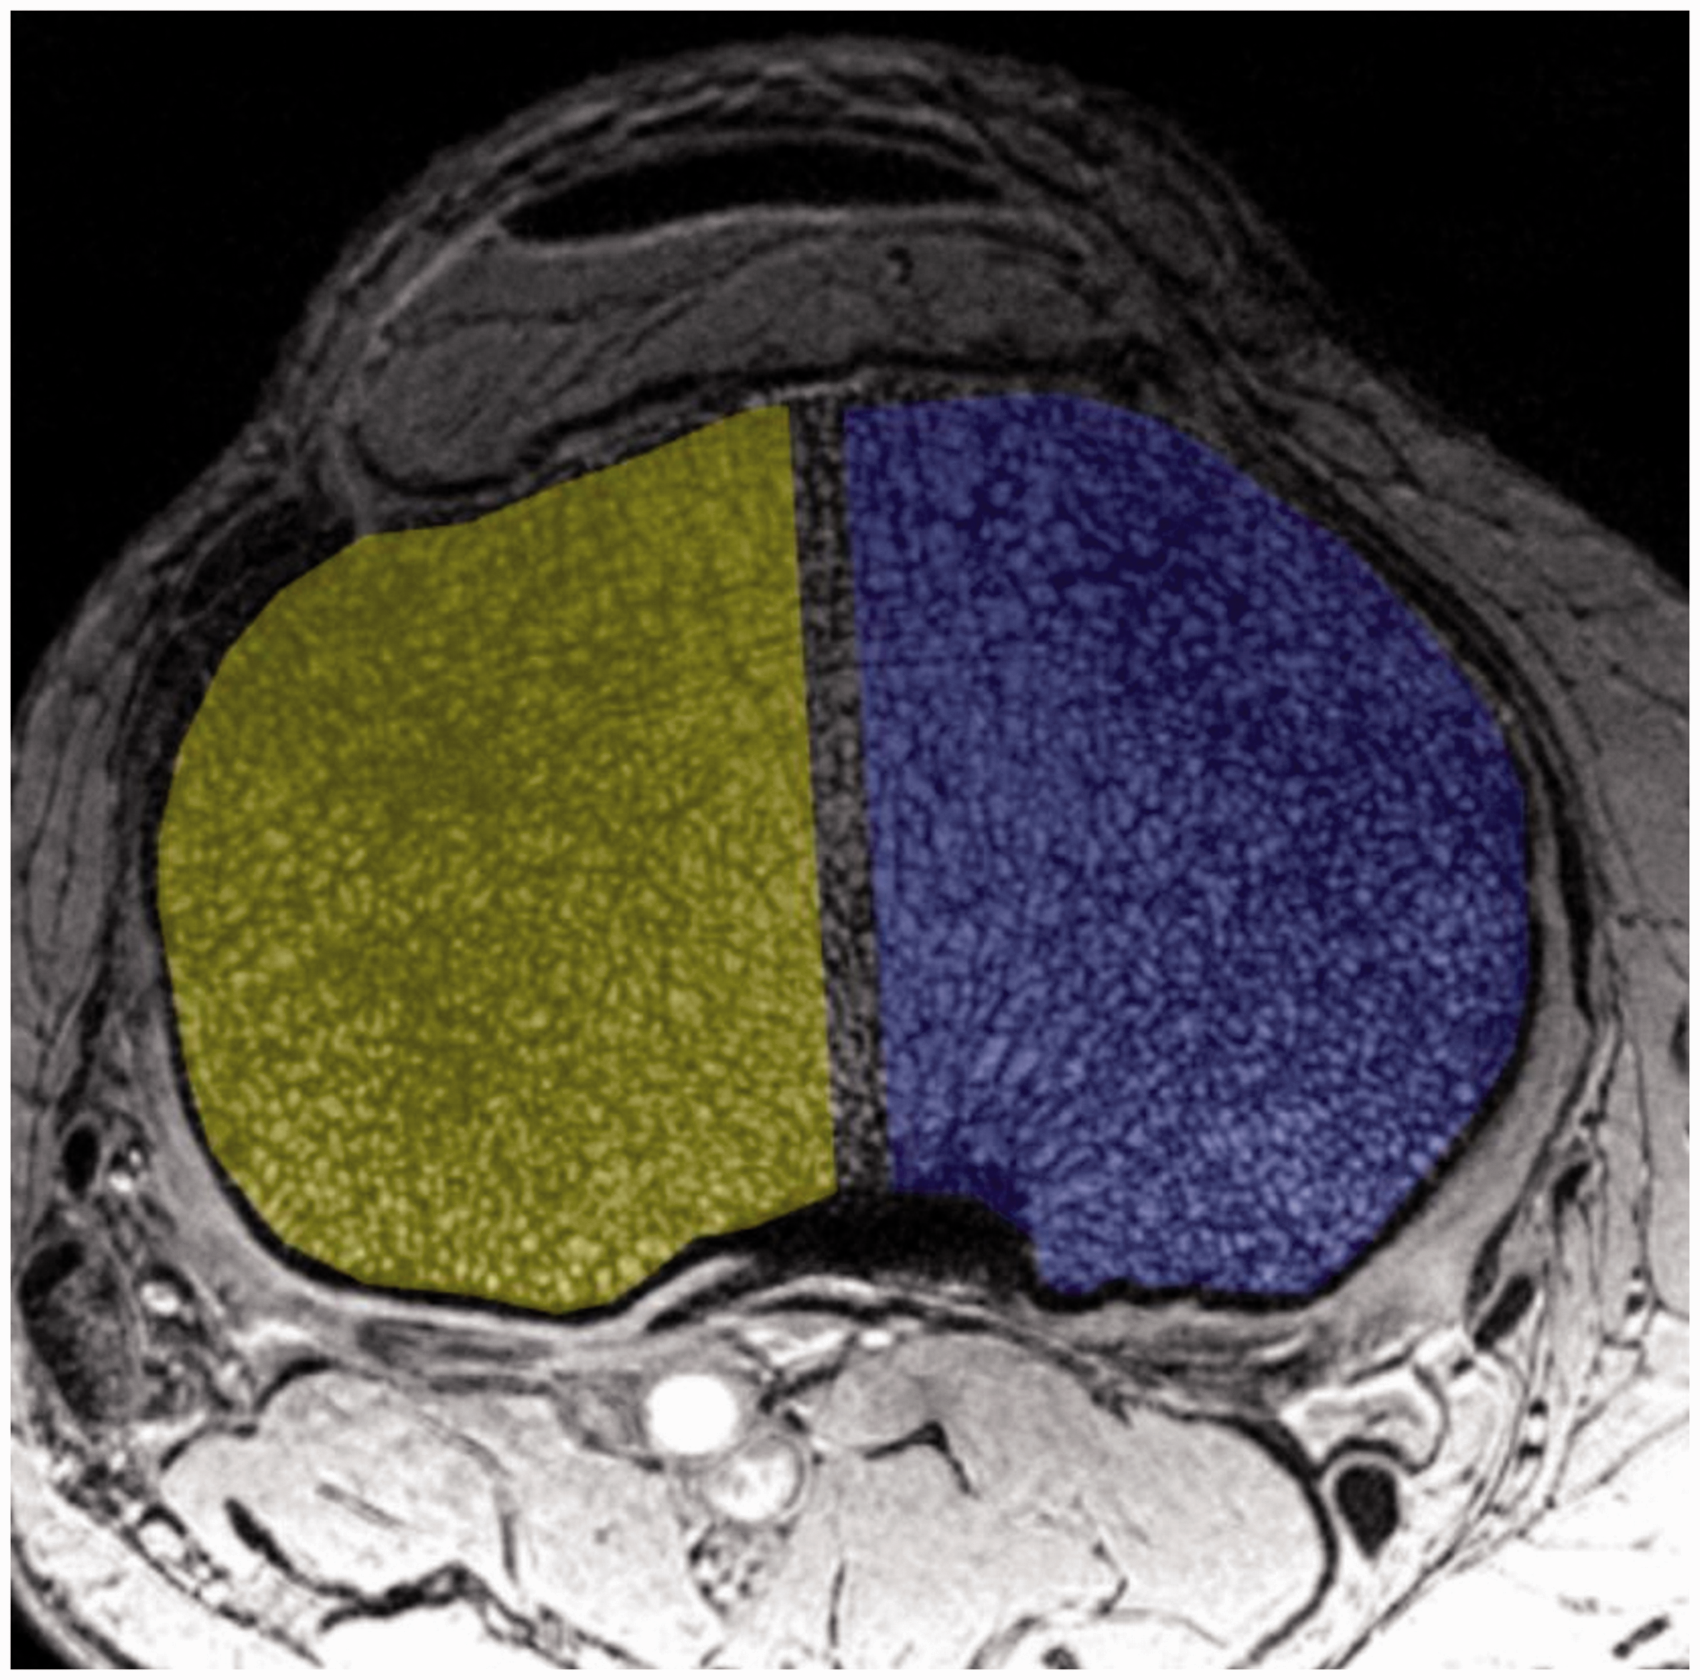
A musculoskeletal radiologist (GC, with six years of experience) oversaw the manually segmentation of 10-mm thick volume of interests on the MR images in the subchondral bone (epiphysis) of the proximal tibia, covering the whole bone cross-section with the exclusion of cortical bone (Fig. 1) (AnalyzeDirect, Overland Park, KS, USA). This volume was further divided into a medial and lateral compartment by bisecting the horizontal diameter of the bone of the respective volume of interest (Fig. 2).
Placement of volume of interest (white frame) in the subchondral bone of the proximal tibia on a coronal plane localizer MR image. Axial high-resolution MR images (7-T) through the epiphysis within the volume of interests in the proximal tibia. The medial (blue) and lateral (yellow) compartment are separated by a small safety margin. Digital topological analysis was performed in each compartment separately.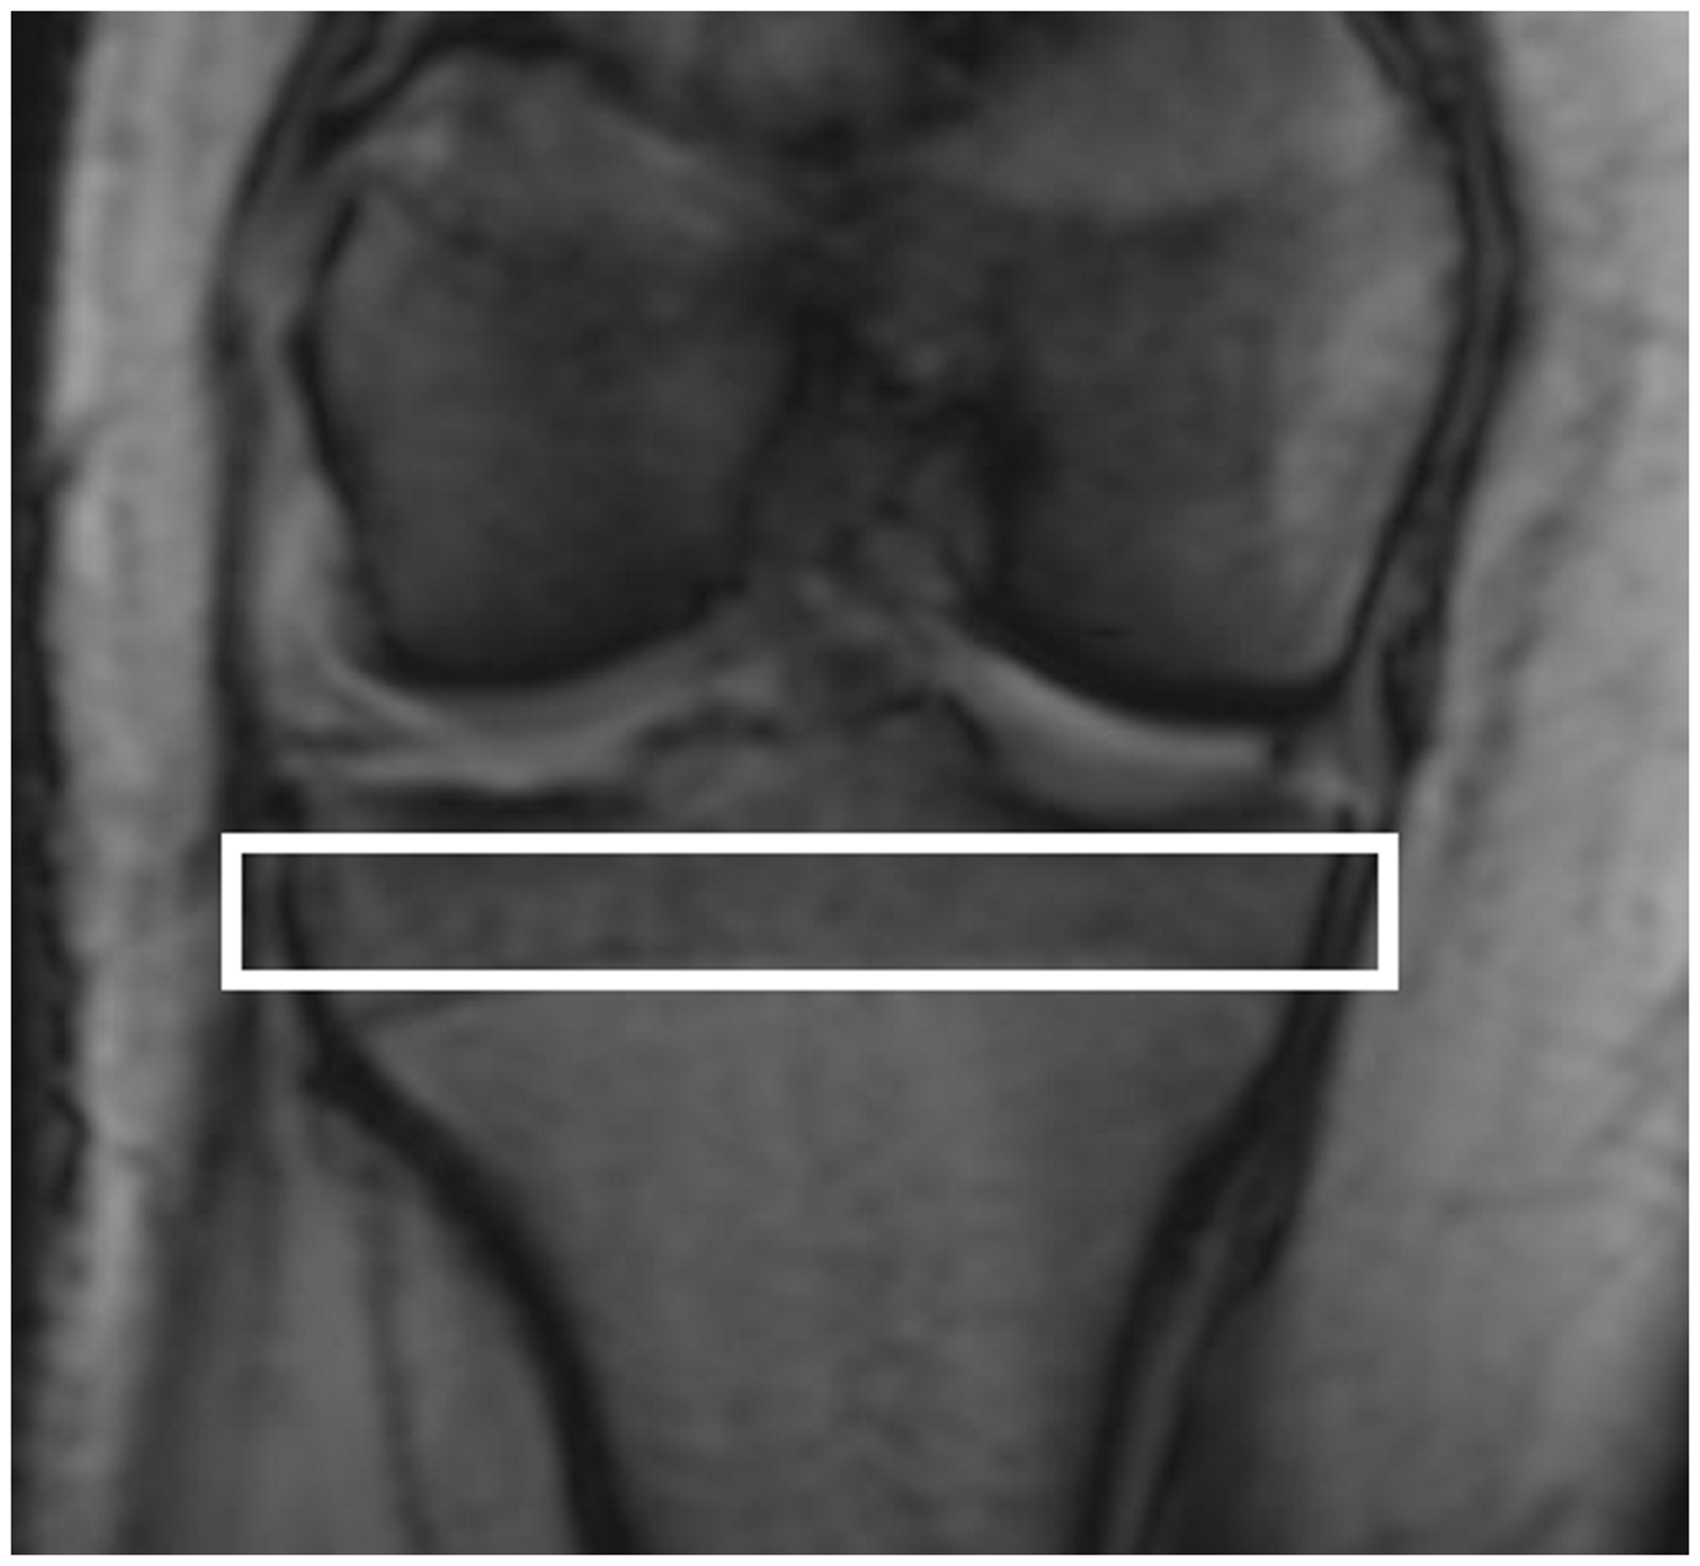
After segmentation, we used in-house developed software to preprocess the bone images and compute bone volume fraction maps, in which each voxel, based on signal intensity, represents the fraction of that voxel that is occupied by bone. Then subvoxel processing was applied to mitigate blurring effects due to partial volume averaging within voxels (17). After subvoxel processing a voxel size of 70 × 70 × 90 µm3 was achieved, basically simulating the trabecular network as if acquired at this spatial resolution.
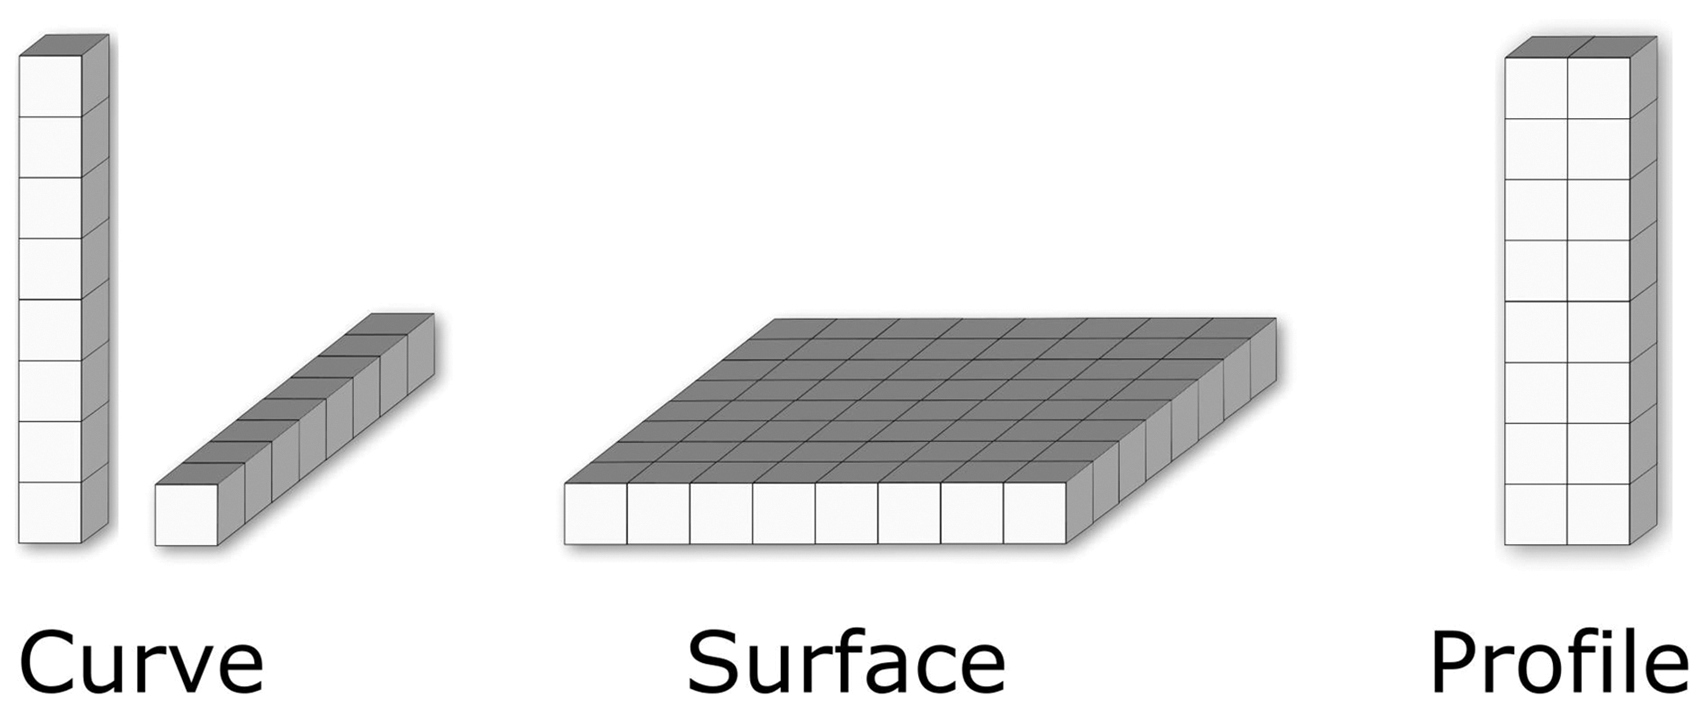
Each compartment was then assessed by digital topological analysis (DTA), described in detail previously (18–20). DTA works on a binarized image, where each image voxel is classified as a bone or marrow voxel. First, DTA computes a medial-surface representation of trabecular bone network using a skeletonization algorithm (21). Subsequently, it applies local topological analysis on the medial-surface to locate curves (rods), surfaces (plates), edges, and junctions. Characterization of local topological structures is based on the observation that, removal of a point on a curve creates two disconnected objects in a sufficiently small neighborhood, while the same creates a hole on a surface and specific other local phenomena for different topological structures (18). Besides curves and surface, an intermediate topological structure, referred to as profile, were defined that represent narrow surface structures with two-voxel width (19). The following topological classes and parameters were separately calculated in each compartment (Fig. 3):
apparent bone volume as a measure of total number of bone voxels within a volume of interest; mean trabecular thickness in micrometers; profile edge density (PE) as a measure of early trabecular bone erosion toward rods; profile interior density (PI) as a measure of intact narrow trabecular plates; surfaces/curves (plate-to-rod ratio); erosion index (19,22) as a sensitive measure to osteoclastic erosions of trabecular bone structures, which is defined as the ratio of all topological parameters expected to increase during the erosion process compared with those that are expected to decrease.
Simplified illustration of the main topological classes in digital topological analysis. Curve elements represent rods, surface elements correspond to plates, while profile elements represent an intermediate type of class between rods and plates.
Statistical analysis
Femoral neck T-scores and spinal T-scores (DXA) and bone microarchitecture parameters (DTA) were compared between patients with and without fragility fractures (Mann–Whitney U test). A P value <0.05 was considered indicating a statistically significant difference. IBM SPSS Statistics Version 24 (IBM Corp., Armonk, NY, USA) was used for all statistical analyses.
Results
There was no statistically significant difference (Mann–Whitney U test) in age (fractured group: mean age = 66 ± 10 years, median age = 66 years, age range = 57–84 years vs. no fracture group: mean age = 50 ± 17 years, median age = 59 years, age range =27–66 years; P = 0.107) and BMI (20.9 ± 4.6 kg/m2 vs. 20.1 ± 3.5 kg/m2, P = 0.670) between the two patient groups. There was no statistically significant difference in BMD T-scores between individuals with and those without fragility fracture (femoral neck T-score −2.4 ± 0.9 vs. −1.8 ± 0.7, P = 0.282 and spine T-scores −2.5 ± 0.9 vs. −2.8 ± 1.3, P = 0.394).
Compartmental analysis.
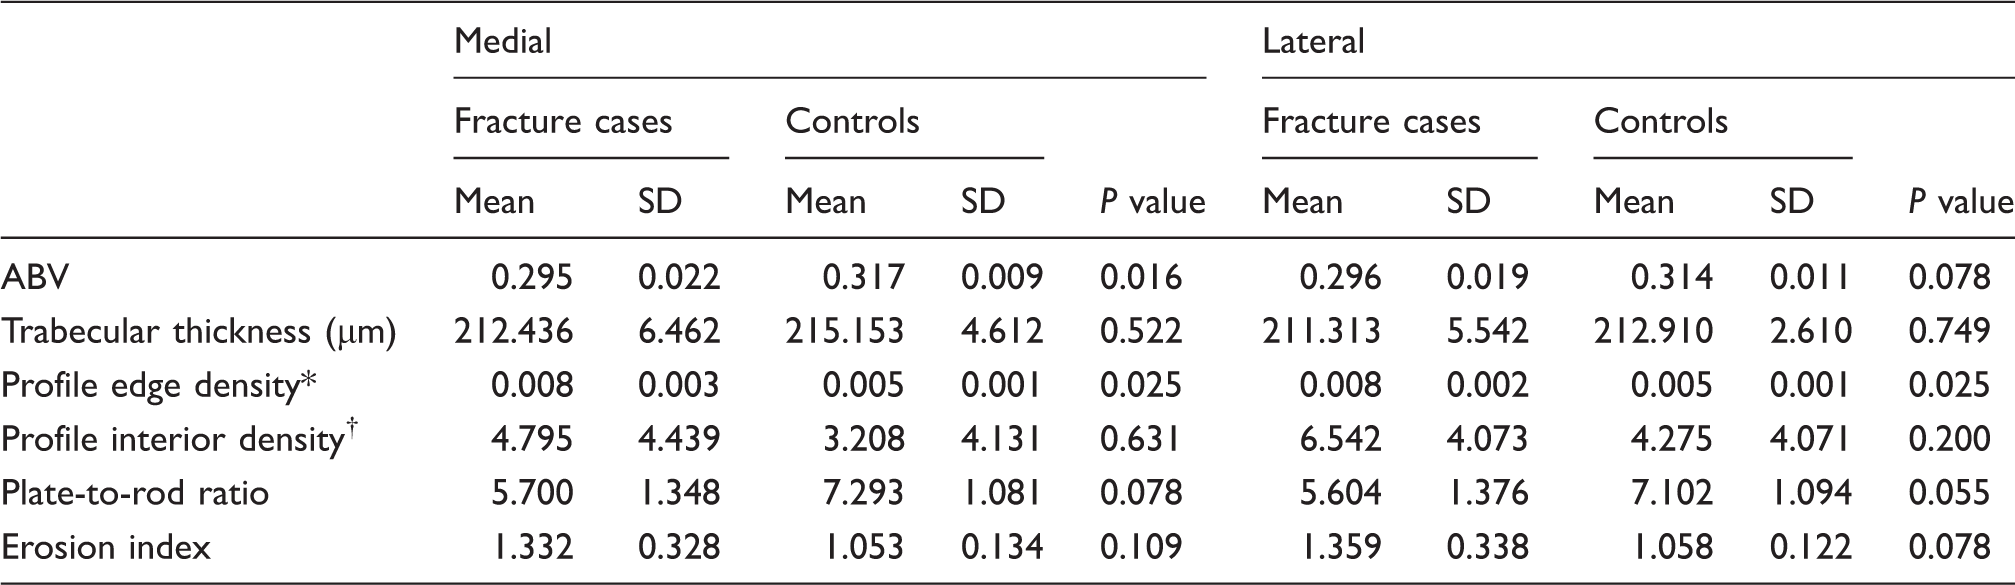
Results of digital topological analysis (DTA) within the subchondral bone of the tibia epiphysis in medial and lateral compartment.
Trabecular bone erosion parameter.
Parameter of intact trabecular rods.
ABV, apparent bone volume; SD, standard deviation.
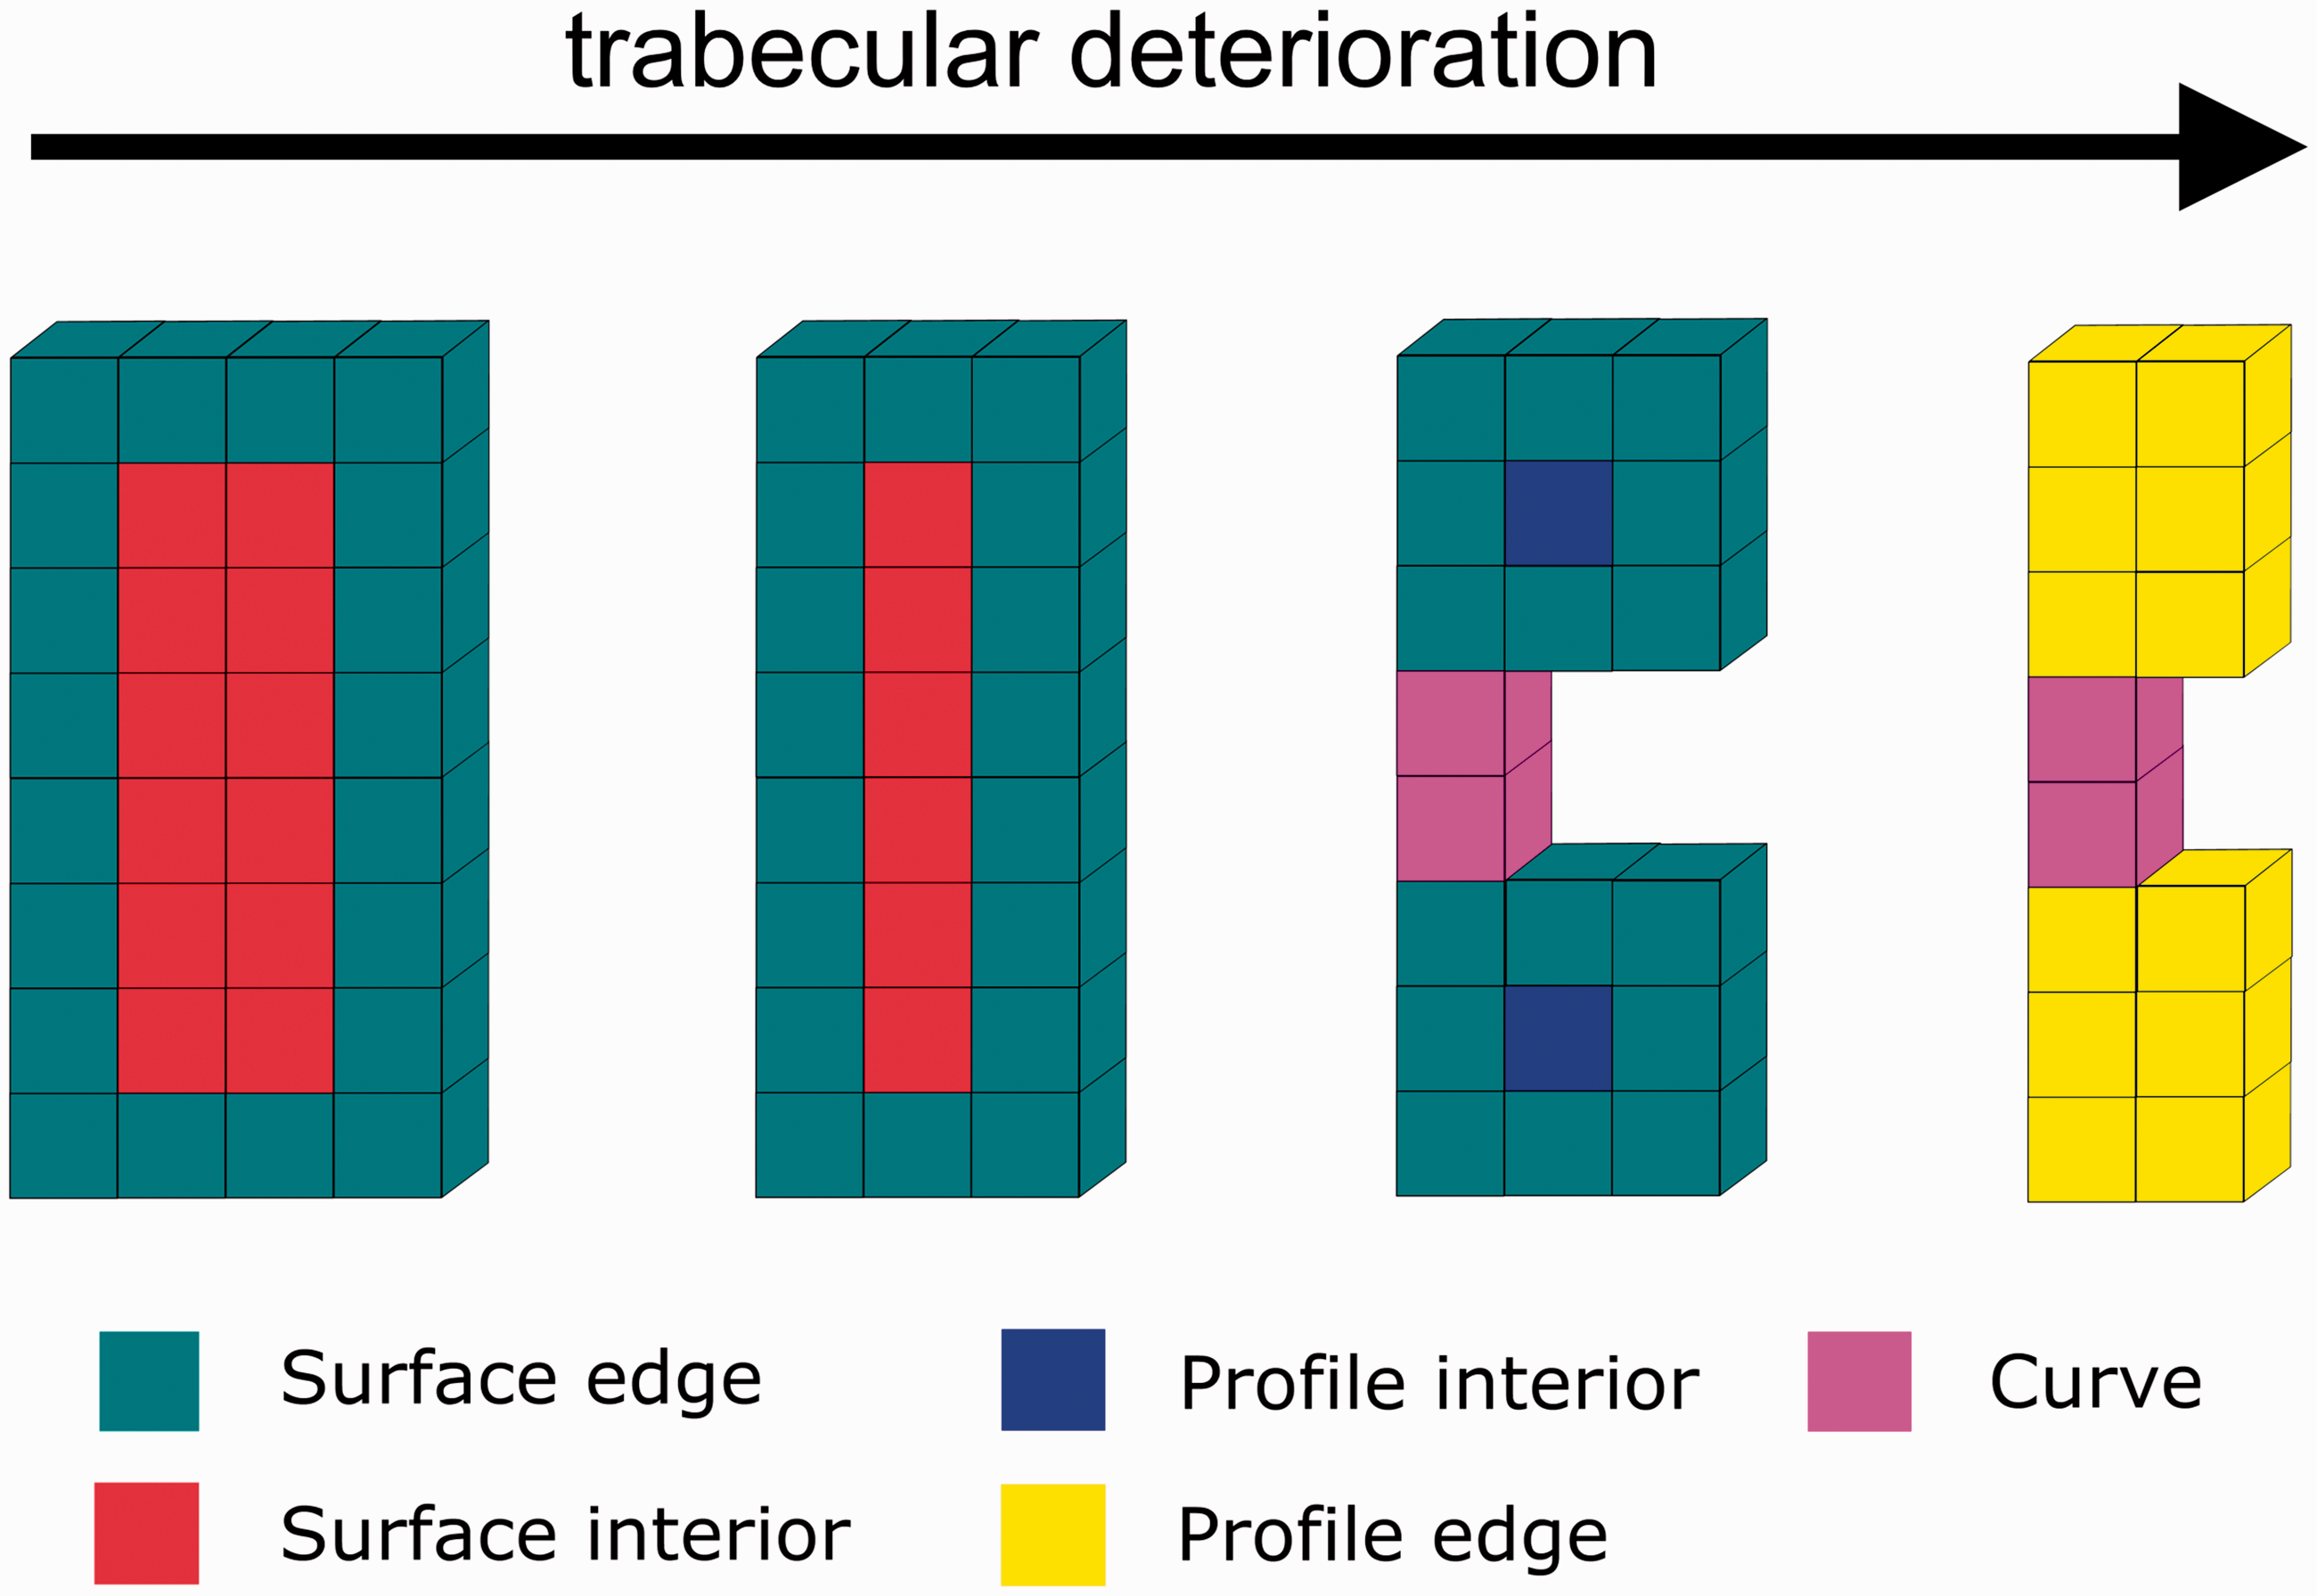
Schematic illustration of progressive trabecular erosion (from left to right) on digital topological analysis with resulting deterioration of bone microarchitecture. Surface edge and surface interior correspond to trabecular plates. Profile interior voxels (blue) are a marker of intact trabecular rods. Profile edge voxels (yellow), a marker of trabecular erosion. Curves correspond to rods.
Discussion
In this study, 7-T MRI detected regional deterioration in proximal tibia subchondral bone microarchitecture in participants with compared to those without fragility fracture, even though they did not differ by metrics of bone mass (BMD) as assessed by DXA. The results suggest that bone microarchitectural parameters, rather than metrics of bone mass, may provide useful additional information as a diagnostic biomarker of osteoporosis.
Osteoporosis, although it is a systemic disease, may not affect all regions of bone to the same degree. Discordance in the diagnosis of osteoporosis can occur if T-scores in different anatomic locations result in different diagnostic categories (23). This is one of the reason why T-scores are calculated for multiple anatomic sites in order not to miss a patient with osteoporosis by measuring at the wrong skeletal site. The typical discordance is osteoporosis or osteopenia in the lumbar spine with normal BMD or osteopenia in the hip (23). Known risk factors for such a discordance are obesity, older age, and delayed menopause (23). This discordance, in addition to DXA being an incomplete method to assess bone fragility with its two-dimensional approach which is influenced by size of the bone and overlying soft tissues, might be one reason why patients with relatively normal bone mineral density can develop fragility fractures.
Though we compared multiple microarchitectural parameters, the profile edge density microarchitectural parameter was the only one to demonstrate changes within the medial and lateral compartment. Specifically, the medial compartment of the proximal tibia showed more detrimental changes than the lateral compartment, indicated by the higher profile edge density, reflecting an increase in osteoclastic erosions of trabeculae. However, profile interior density, a marker of intact trabeculae did not show a statistically significant difference between the two groups. Absolute bone volume (apparent bone volume) was lower in the medial compartment between patients with compared to those without fracture. One possible explanation for these regional differences is an impaired mechanoresponse of bone in the setting of osteoporosis. Indeed, this might explain why insufficiency fractures occur more frequently in the medial, rather than lateral tibia plateau (24).
Since biopsy studies have shown that osteoporosis involves a conversion of trabecular plates to rods, overall, the results suggest that regional assessment of trabecular profile microstructure (trabecular struts that are intermediate between trabecular surfaces/plates, which are the strongest microstructure, and trabecular curves/rods, which are the weakest microstructure), might be a more sensitive early biomarker of osteoporosis compared to other microarchitectural parameters or BMD. Profile edge density could serve as such a parameter but needs further evaluation in clinical studies.
One strength of this study is the use of a 7-T MR scanner and use of validated microarchitectural analysis method, DTA, with good reproducibility (16). 7-T MRI provided sufficient image quality and spatial resolution to image bone microarchitecture of the proximal tibia in about 7 min, which is acceptable for patients. The achieved in-plane resolution of 0.234 × 0.234 mm is in the magnitude of a previously suggested resolution of 0.23 mm that still preserves bone parameters derived from MR images (25). With the applied subvoxel analysis, the effective resolution for the DTA analysis was even higher.
Other studies have applied DTA to bone. However, most prior analyses have been performed on the whole-bone level, rather than regional level, as in this study, and only a few studies have been performed at 7-T. One of the first studies applied DTA to MR images of the distal radius at 1.5-T and found that DTA of the whole distal radius could discriminate individuals with from those without vertebral compression deformities (20). Subregional deterioration in subchondral bone microarchitecture was detected in patients with mild knee osteoarthritis compared to healthy controls using a 7-T scanner and a high-resolution FLASH sequence (26). In that study, similar parameters derived from DTA were used as in our current study. DTA applied to 7-T MR images of the distal femur was able to discriminate patients with previous fragility fracture from non-fractured patients (11). However, in that study, no subregional analysis was performed. Finally, 7-T and DTA showed a higher trabecular bone quality in the whole distal femur in high-impact athletes compared to controls, demonstrating the adaption of trabecular bone microarchitecture on external forces (mechanoresponse) (27). DTA was also successfully applied to the proximal femur on 3-T MR scanners with a high reproducibility (5). All these studies showed that DTA is a sensitive tool to detect changes in bone microarchitecture at different anatomic locations. Previous studies have shown that DXA is not well suited to discriminate between patients with and patients without fragility fracture while this is possible with quantitative microarchitecture analyses (4,28). This highlights the clinical importance of our study and it is well possible that in the near future bone microarchitecture parameters will become an integral part in the diagnosis and monitoring of osteoporosis.
As we have shown in this current study, the changes in bone microarchitecture do not affect all regions of bone to the same extent. Future studies may need to consider the regional site on which to apply DTA to not miss asymmetric changes in bone microarchitectural deterioration. In addition, regional differences in bone microarchitecture in osteoporosis might also vary between anatomic locations. For example, asymmetric mechanical stress and therefore asymmetric mechanoresponse in the knee may result in microarchitectural differences in different regions. On the other hand, in the distal radius as a non-weight-bearing bone, regional microarchitectural differences may not be as pronounced if the bone is loaded symmetrically.
This study has limitations. First, the sample size was small. However, as a feasibility study, there were still enough participants to detect differences between groups. In addition, we used a more conservative, non-parametric statistical test rather than the t-test, which could be affected by skewed or non-normally distributed data. Second, we recognize that the sequence used does not have isotropic voxels or as small a voxel size as for example high-resolution peripheral quantitative computed tomography (HR-pQCT) scanners. However, since trabeculae in the knee are oriented along the weight-bearing axis in craniocaudal direction, the 1-mm slice thickness should not substantially affect our DTA results, as previously reported (29). The same applies to the subvoxel processing, which helped to increase resolution of the trabecular architecture for the subsequent DTA (17). In addition, the resolution was still sufficient to visualize individual trabeculae and we note that HR-pQCT scanners can only image in the distal extremity (ankle, wrist) in vivo as opposed to MRI, which can image in more proximal anatomic locations. Third, areal BMD was measured at a different location (femoral neck, spine) than the actual bone microarchitecture analysis. However, it is standard of practice in the diagnostic work-up for osteoporosis to perform DXA on the spine and hip and therefore we used these DXA results. Furthermore, we decided to use T-scores rather than true BMD values because management decisions in osteoporosis are based on T-scores.
It should be noted that MRI of microarchitecture in the proximal femur has recently become possible at both 7-T and 3-T (5,30) and only recently a cadaver study described the use of 7-T MRI to assess bone microarchitecture in vertebral bodies with good correlation with biomechanical parameters (31), thus permitting evaluation of areal BMD and bone microarchitecture in the same clinical anatomic location. Another limitation is the use of software that is not widely available for these types of analyses. But as the importance of bone microarchitecture in osteoporosis research is increasingly recognized, the number of commercially available solutions should also increase.
In conclusion, 7-T MRI and DTA may permit detection of subtle regional deterioration in trabecular microarchitectural profile parameters when differences in BMD are not evident. The results suggest that this may serve as an early biomarker of osteoporosis and should be confirmed in larger prospective studies.
Footnotes
Declaration of Conflicting Interests
The author(s) declared no potential conflicts of interest with respect to the research, authorship, and/or publication of this article.
Funding
The author(s) disclosed receipt of the following financial support for the research, authorship, and/or publication of this article: This research was supported by grants from the Swiss National Science Foundation and the Swiss Society of Radiology (to CAA) and from the United States National Institutes of Health (K23-AR059748, RO1-AR066008 to GC).