
Abstract
Background
Lymph node enlargement is a common clinical finding in clinical practice with different treatment strategies.
Purpose
To investigate the application of Virtual Touch Image Quantification (VTIQ) to diagnose benign and malignant superficial enlarged lymph nodes.
Material and Methods
Between December 2015 and August 2016, 116 superficial enlarged lymph nodes were examined by VTIQ. Maximum (Vmax), minimum (Vmin), and average (Vmean) shear wave velocities (SWV) were obtained from the lymph nodes and from normal muscular tissues (Vn) located at the same level and within 5 mm from the target lymph node. The pathological results were used as the gold standard to evaluate VTIQ.
Results
All 116 patients underwent fine-needle aspiration biopsy for pathological examination. Forty patients had malignant lymph nodes and 76 patients had benign lymph nodes. Lymph node characteristics on B-mode ultrasound showed no differences between malignant and benign lymph nodes, but there were differences in VTIQ parameters (all P < 0.001). Compared with pathological diagnosis as the gold standard, the area under the ROC curves of Vmax, Vmin, and Vmean were 0.815, 0.746, and 0.795. The Vmax cutoff value to diagnose benign from malignant lymph nodes was 3.045 m/s. The sensitivity, specificity, and positive and negative predictive values were 70%, 78.9%, 63.6%, and 83.3%.
Conclusion
VTIQ has a clinical application in the differential diagnosis of superficial enlarged lymph nodes.
Keywords
Introduction
Superficial lymphadenopathies frequently arise as a manifestation of underlying malignancy or due to local/systemic, benign, infectious diseases. Pathological examination is currently the gold standard for the diagnosis of lymphadenopathies, but most methods to obtain specimens are invasive. Among the non-invasive diagnostic tools, ultrasound (US) is the first choice for lymph nodes (1–3).
Ultrasound elastography relies on the fact that stiff tissues deform less than softer tissues under similar force, and cancerous tissues have greater cell density than normal tissues (4). Shear wave elastography (SWE) involves exposing the region of interest (ROI) to short duration, high intensity acoustic pulses and measuring the velocity of the shear waves (SWs) (5). Elastography has been widely used as a diagnostic tool to determine malignancy (6–10). Through SWE, acoustic radiation force impulse (ARFI) can provide visual and quantitative information on the mechanical properties of the tissue. ARFI technologies include Virtual Touch Imaging (VTI), Virtual Touch Quantification (VTQ), and Virtual Touch Image Quantification (VTIQ) (Siemens, Erlangen, Germany). VTI provides a qualitative gray-scale map of tissue stiffness based on the local tissue displacements in response to short acoustic waves. VTIQ, on the other hand, provides a quantitative read-out based on the shear wave velocity (SWV), which is measured in m/s and is higher in stiffer tissues. Compared with VTQ and VTI, VTIQ also has a SW quality control chart, which can evaluate the quality of the examination (11–13). Nevertheless, the accuracy of the diagnosis depends on the clinical experience of the examiner. VTIQ has also been performed for the assessment of benign and malignant lymph nodes in the thyroid, salivary glands, and breast (11,14). Studies have also investigated the use of acoustic radiation force impulse imaging for cervical lymph nodes (15,16).
The aim of this study was to investigate the application of VTIQ to diagnose benign and malignant superficial enlarged lymph nodes.
Material and Methods
Patients
This retrospective study included consecutive patients diagnosed with lymph node enlargement found during a clinical examination from December 2015 to August 2016. A total of 116 patients with lymphadenopathy (116 patients and 116 lymph nodes; 34 men, 82 women; age range = 18–98 years; mean age = 53 ± 16 years) were selected. Lymphadenopathies were present in different parts of the body including cervical (n = 82), axillary (n = 29), and inguinal lymph nodes (n = 5). All lymph nodes underwent pathological examination. All patients had complete ultrasound and VTIQ examination data. To be included, the enlarged lymph nodes had to meet at least two of the following criteria: (i) unclear node structure on B-mode ultrasound (i.e. disappearance of the hilus; internal liquefaction, necrosis, or calcifications could also be observed); (ii) the largest anteroposterior (the largest distance between the anterior and posterior capsule of the lymph nodes on the transverse section) diameter of the lymph node was ≥ 5 mm; and (iii) the ratio of the suprainferior (the largest distance between the superior and inferior capsule of the lymph nodes on the vertical section) to the anteroposterior diameters was ≤ 2. In addition, the patients had to be without any form of treatment (such as chemotherapy) before the ultrasound examination. The patients were selected according to the STARD 2015 criteria (17).
In each patient, only the largest lymph node was selected as the observation target, and the maximum suprainferior diameter of the targeted lymph node was < 30 mm. The exclusion criteria were: (i) the patient had received treatment or lymph node biopsy; (ii) the maximum suprainferior diameter of the lymph node was > 30 mm; or (iii) the quality of the VTIQ examination was very poor (the target region of the VTIQ quality control chart showed large red areas, indicating that the quality of the elastography was poor).
The study protocol was approved by the ethics committee of the hospital. The need for individual consent was waived by the committee because of the retrospective nature of the study.
Pathological examination
The diagnoses were determined by pathological examination. The lymph nodes were examined independently by two pathologists (at least ten years of experience) and a third pathologist was invited if the results were inconsistent. These pathologists were blinded to the results of the US examinations.
Ultrasound elastography and VTIQ measurements
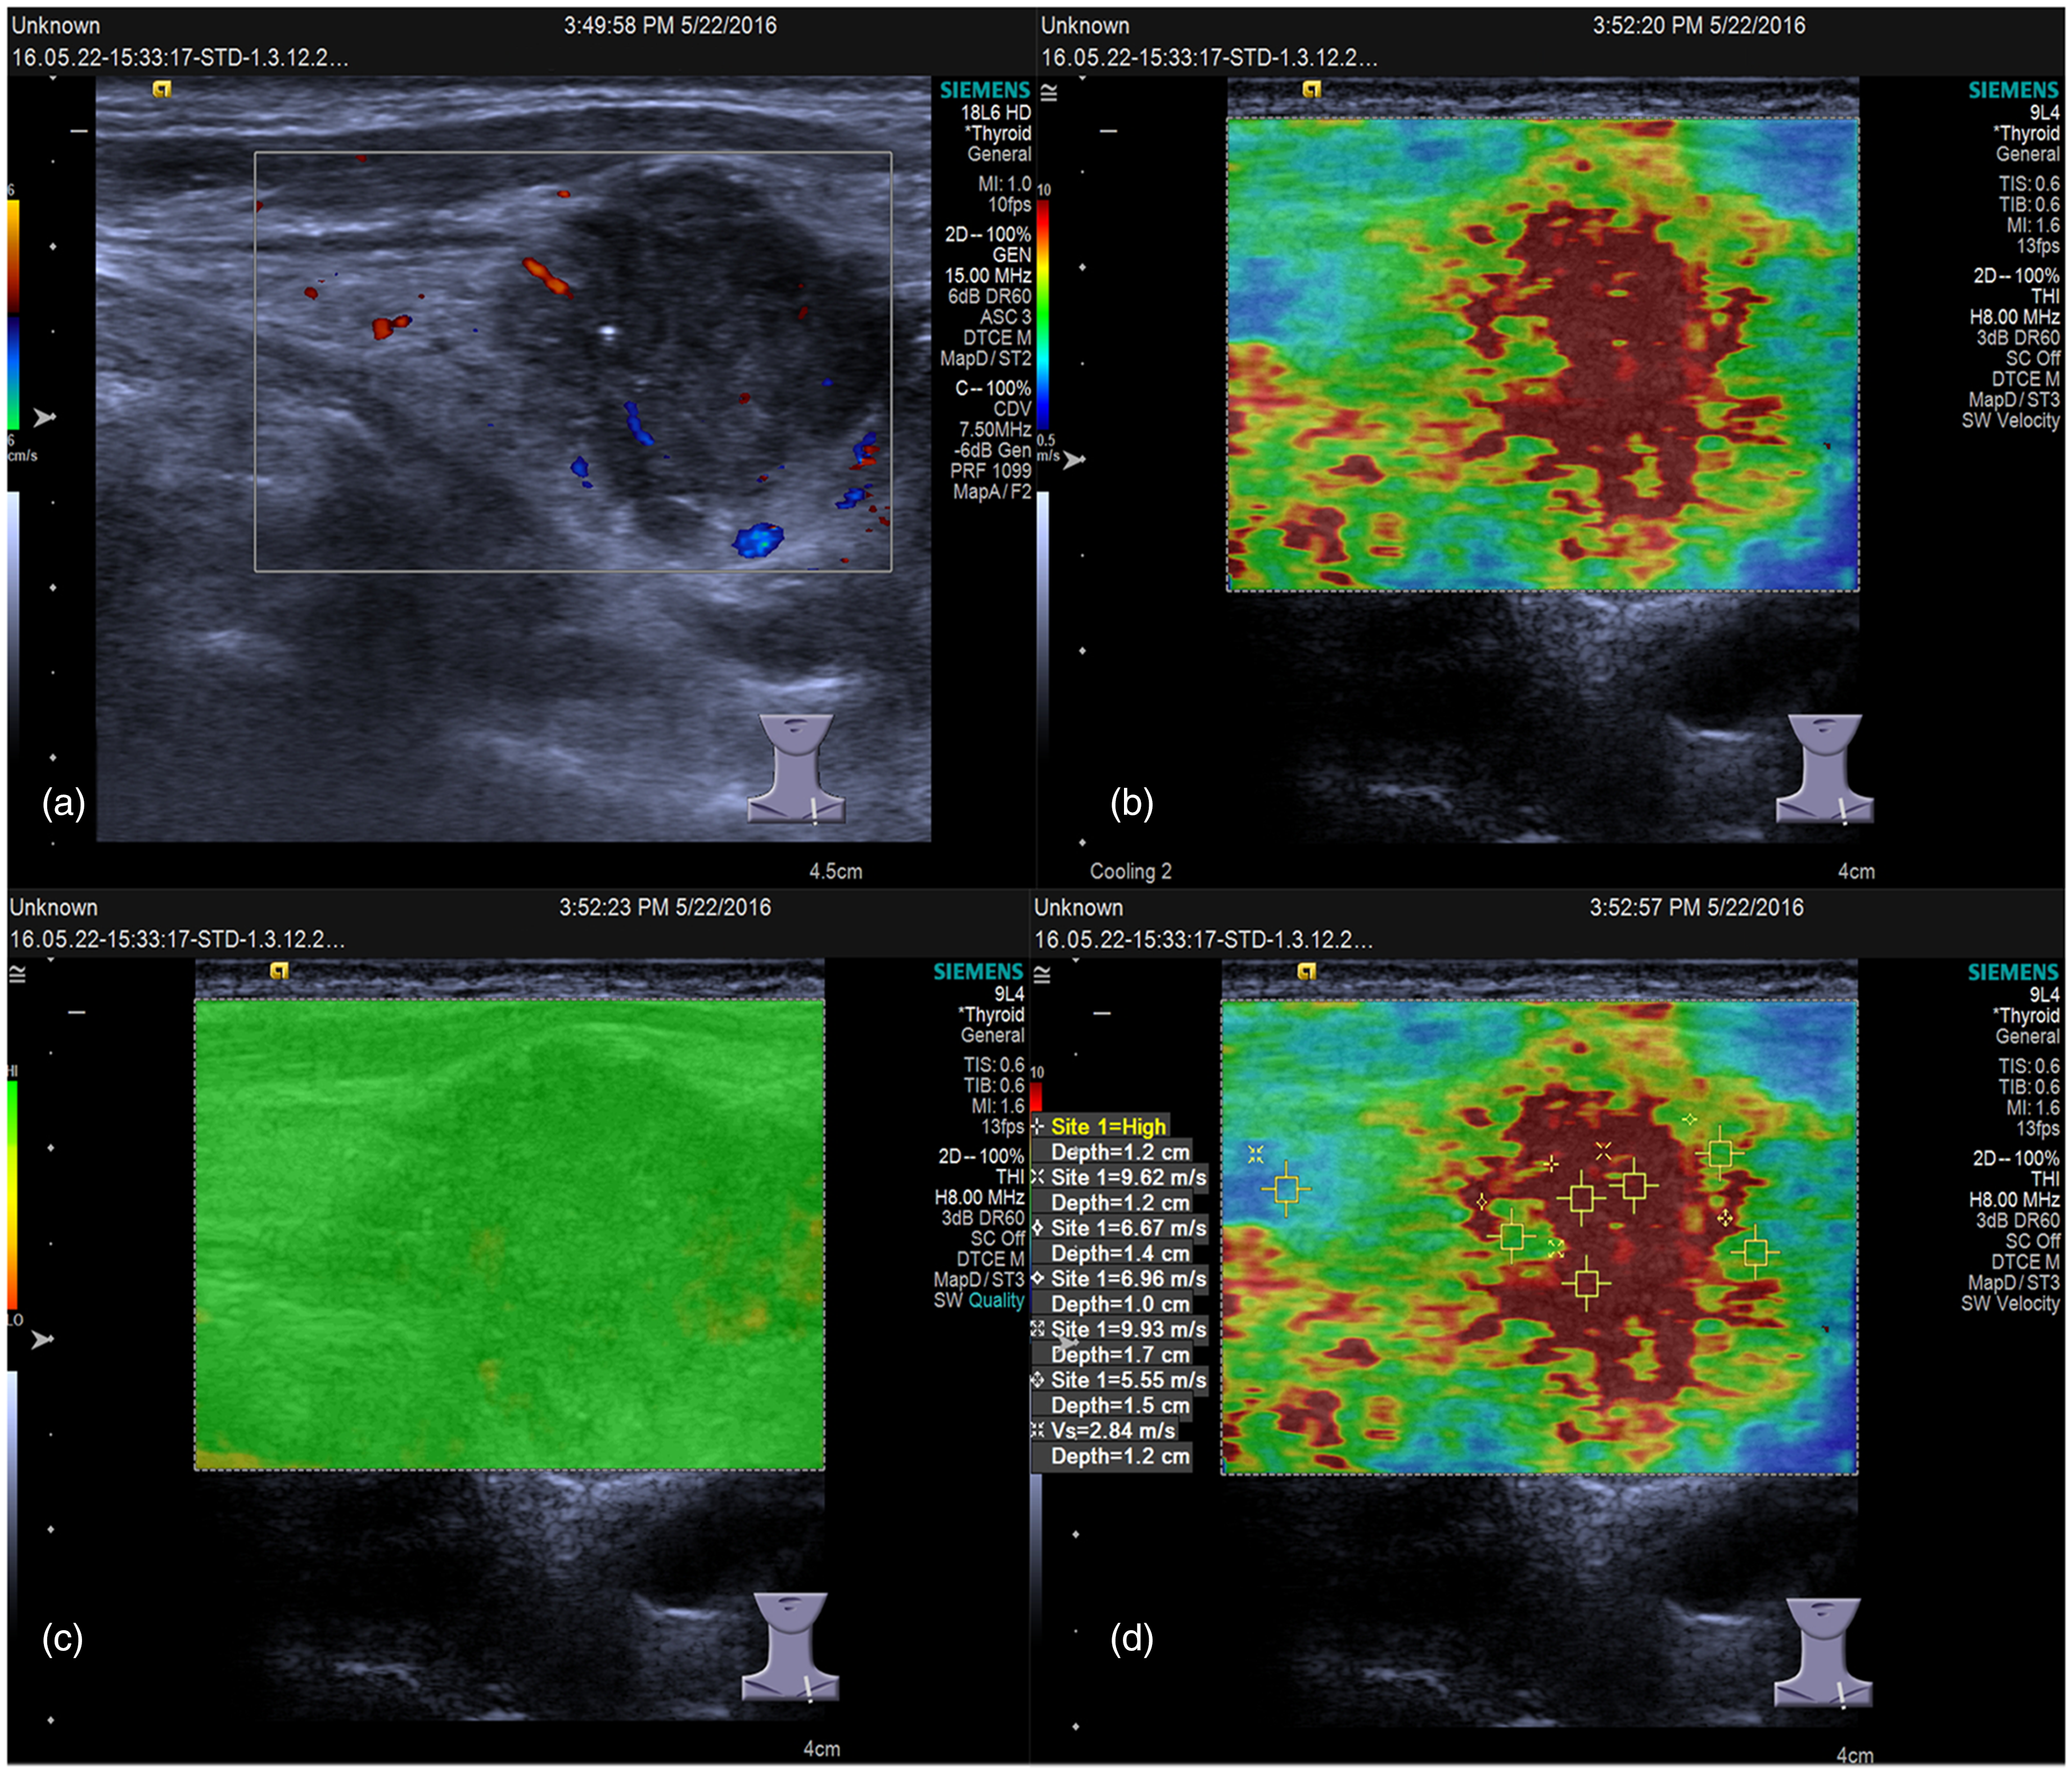
Enlarged lymph nodes were selected as observation targets, and the ratio of the surrounding normal tissue area and target lymph node area during VTIQ was at least 1:1, i.e. that the normal tissue covered at least 50% of the image. Cases in which lymph nodes were too enlarged, leading to a too small amount of peripheral tissue during VTIQ examination, were excluded. All the ultrasound examinations were performed with a Siemens Acuson S3000 ultrasonic diagnostic system (Siemens Medical Solutions, Mountain View, CA, USA), with a 9L4 probe, and built-in VTIQ software. Patients were laid in the supine position to expose the target lymph node and conventional ultrasound was used to observe the size of the lymph nodes and internal echo. In general, the largest lymph nodes were chosen as the observation targets for VTIQ examination, and the sampling frame included both target lymph nodes and surrounding normal tissues. The “normal tissues” were the muscle tissues located at almost the same level and within 5 mm around the targeted lymph node. When the lymph nodes were larger, sampling frame contained only a portion of the lymph node tissue to ensure that the surrounding tissues occupied at least half of the sample frame. During VTIQ examination, the probe was held perpendicular to the node without any pressure and the patients were asked not to swallow or breathe. The SW quality diagram was obtained after image stabilization by pressing the “update” button. The SW quality map indicates whether the SW is of sufficient magnitude and signal-to-noise ratio (SNR); green represents high quality, yellow and orange represent marginal and low quality. If the image has low quality then the VTIQ examination was re-performed. The SWV map was then plotted, in which high wave velocity is represented in red and intermediate and slow velocities in yellow/green and blue. When there was uniform SW distribution, five SW ROIs were placed arbitrary in the lymph node to obtain values. In case of heterogeneous SW distribution, two SW ROIs were placed in the region of the highest and lowest tissue stiffness while the remaining three SW ROIs were placed randomly in the rest of the lymph node. Maximum, minimum, mean, and median SWVs were then calculated from the five SW values. One measurement was performed in the normal muscle tissue area, where the velocity color distribution was relatively uniform (Figs. 1 and 2). If the SWV was “high,” then the scale key was adjusted until the appearance of a specific value. If it had reached the maximum already, but SWV still showed “High,” then the value of 10 m/s was recorded. The same method was applied to all lymph nodes.
SW elastogram of lymph nodes with reactive hyperplasia. (a) Blood stream diagram of malignant lymph nodes. (b) SWV diagram of benign lymph nodes. (c) Quality control image for a benign lymph node. (d) SW measurement diagram of benign lymph nodes. Vmax = 2.77 m/s, Vmin = 2.49 m/s, Vmean = 2.66 m/s, and Vn = 2.53 m/s. SW elastogram of lymph node enlargement caused by lung adenocarcinoma. (a) Blood stream diagram of malignant lymph nodes. (b) SWV diagram of malignant lymph nodes. (c) Quality control image for a malignant lymph node. (d) SW measurement diagram of malignant lymph nodes. Vmax = 10 m/s, Vmin = 5.55 m/s, Vmean = 8.12 m/s, and Vn = 2.84 m/s.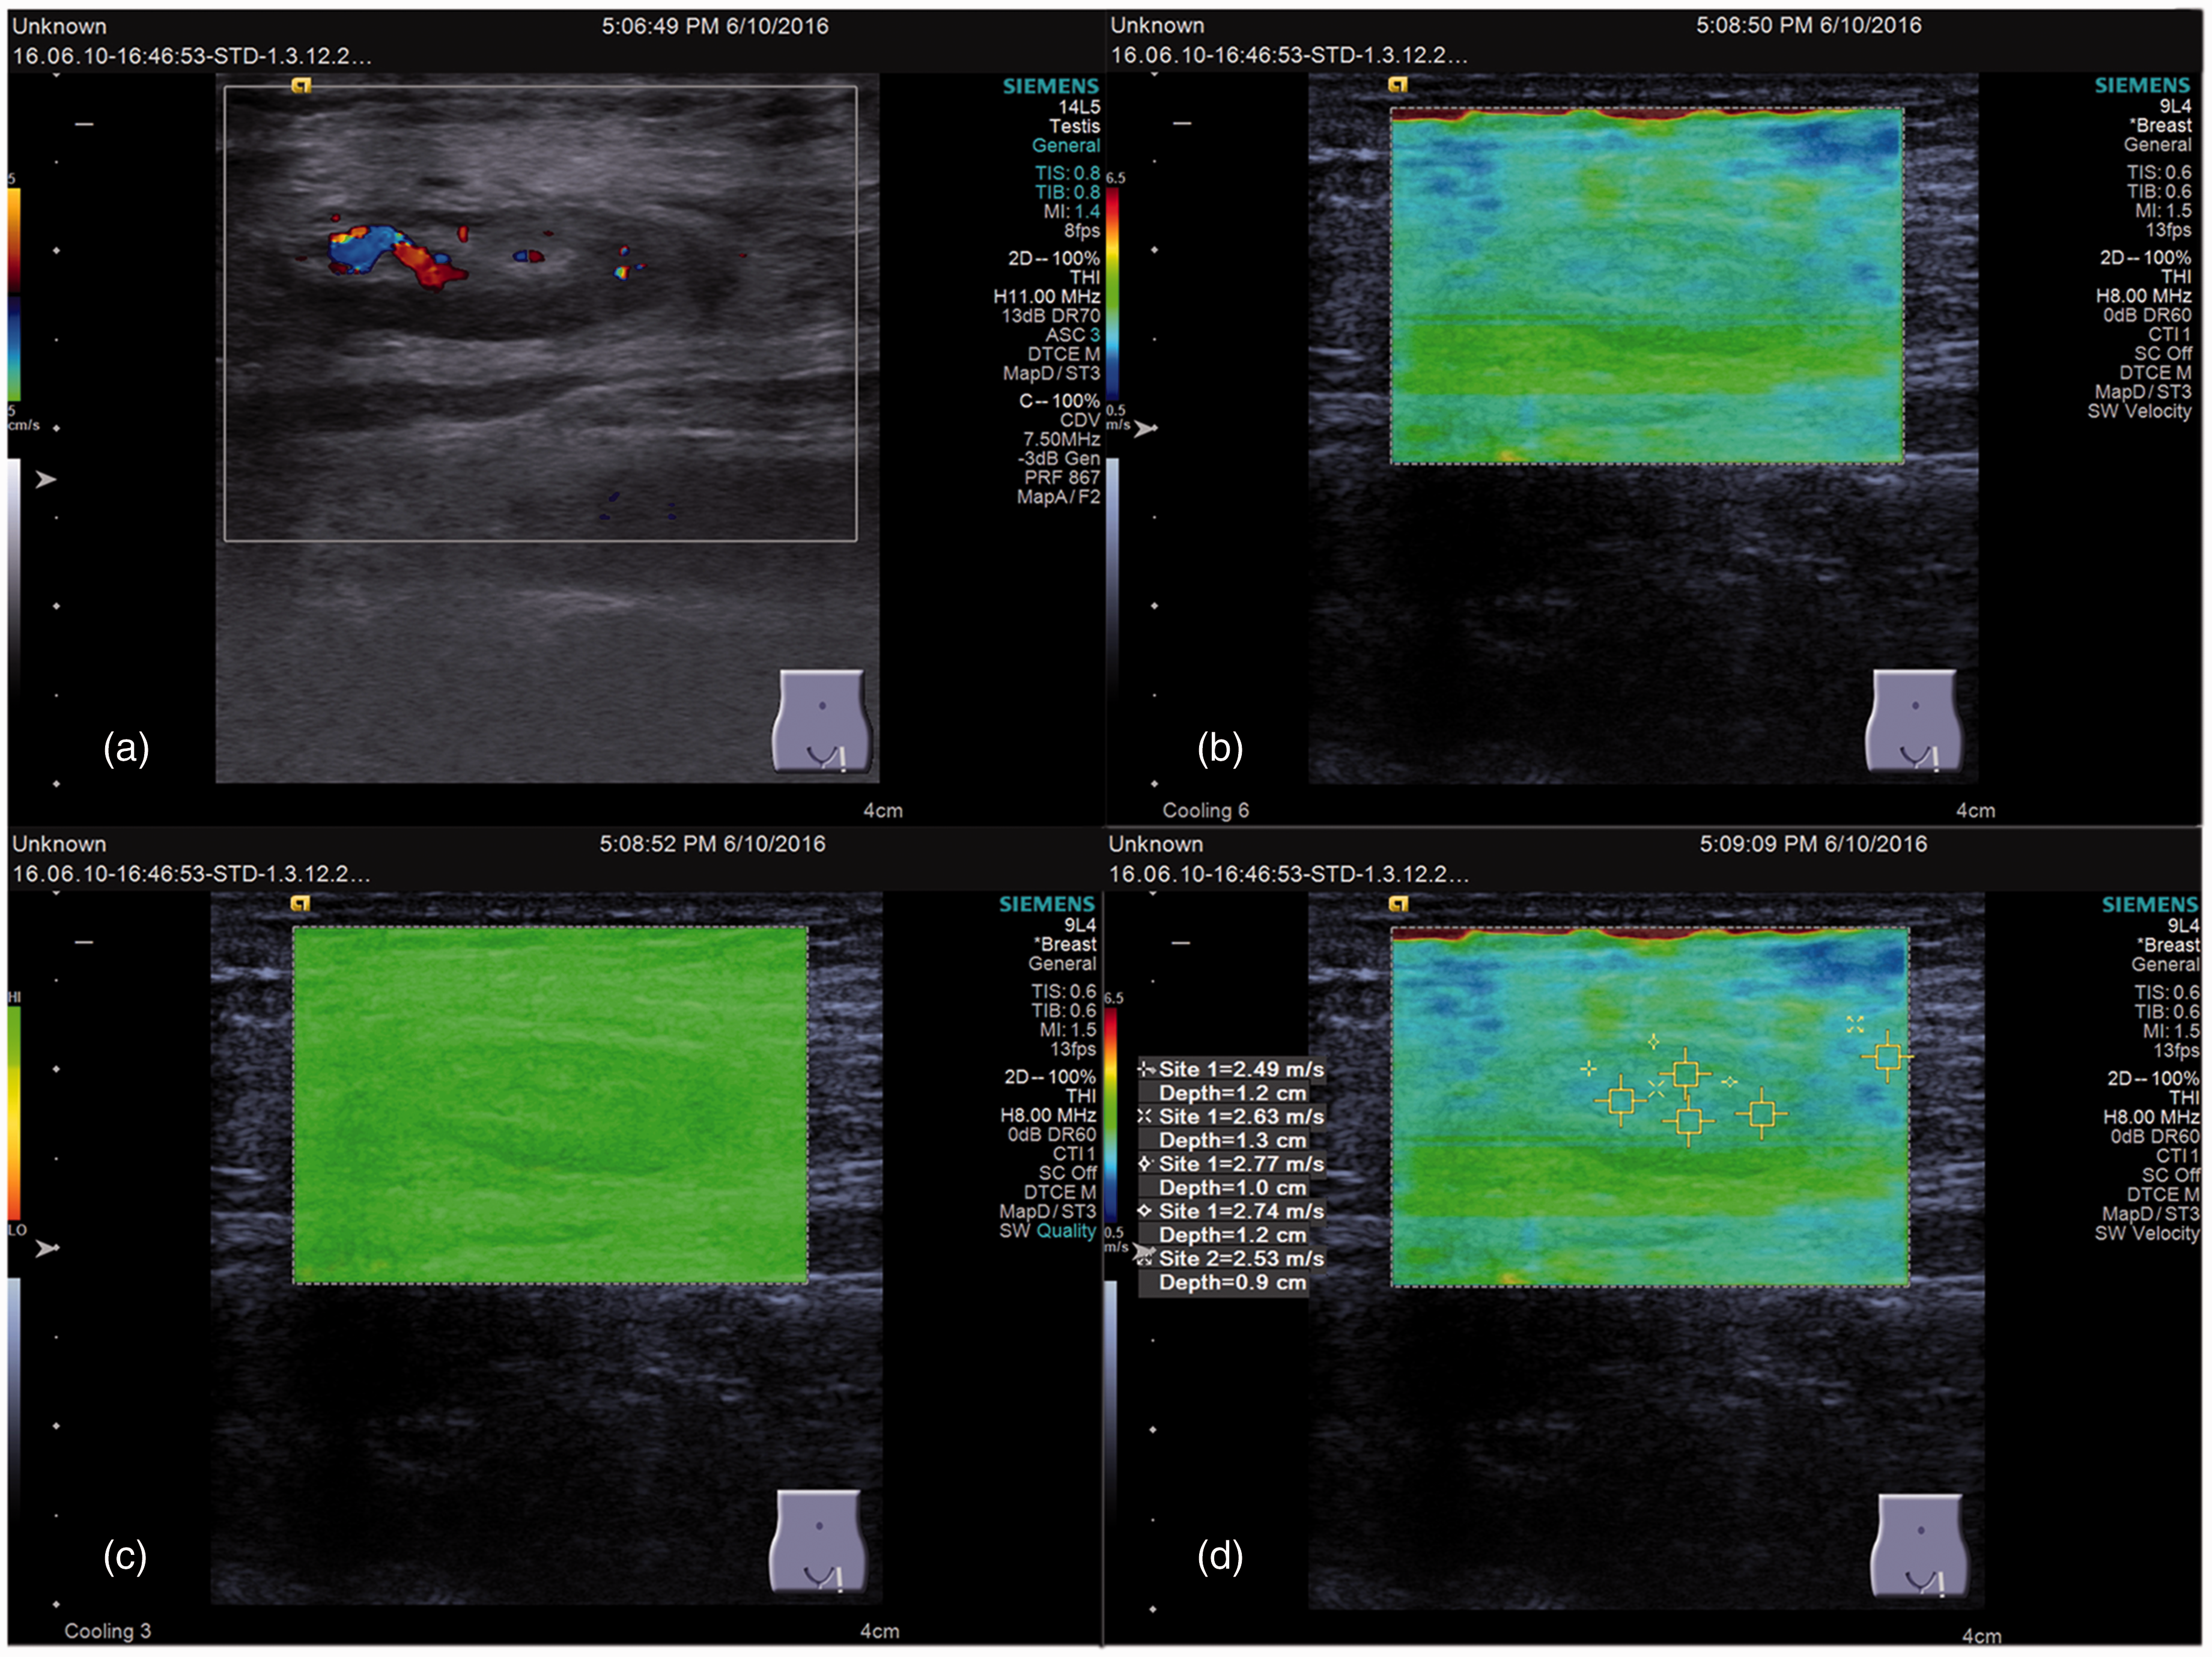
Sixty-eight lymph nodes from the first 68 patients enrolled in the study were examined by two skilled attending physicians, proficient in VTIQ examination for more than six months, to assess the consistency amongst VTIQ examiners. The VTIQ results from the remaining 48 lymph nodes were evaluated by two ultrasound physicians independently. The ultrasound physicians were blinded to the pathological results and patient history of all 116 patients (benign or malignant). The read-outs of the VTIQ examination were: maximum (Vmax), minimum (Vmin), mean (Vmean) SWV, and SWV of normal tissues (Vn) around the lymph nodes.
Statistical analysis
The normal distribution was tested with the Kolmogorov–Smirnov test and the data were verified to be normally distributed. Patients were classified in two groups: benign (n = 76 cases) and malignant (n = 40 cases). The SPSS 19.0 (IBM, Armonk, NY, USA) software was used for analysis. Normally distributed data were presented as mean ± standard deviation and the Student’s t-test was used for analysis. The consistency of the measurements between different examiners was analyzed using intraclass correlation coefficient (ICC) analysis. Pathological results were used as the gold standard. Receiver operating characteristic (ROC) curve was drawn from the values, and the area under the ROC curve (AUC) was calculated. The optimal VTIQ parameter cutoff point for the diagnosis of benign and malignant lymph nodes was obtained using the Youden index. P < 0.05 indicated statistically significant differences. Results were further compared with the gold standard, and comparisons between VTIQ diagnoses and the gold standard were listed. Subsequently, the statistical efficiency indexes, including sensitivity, specificity, positive predictive value, negative predictive value, and Youden index were calculated.
Results
Differential diagnosis of benign and malignant lymph nodes by pathological examination
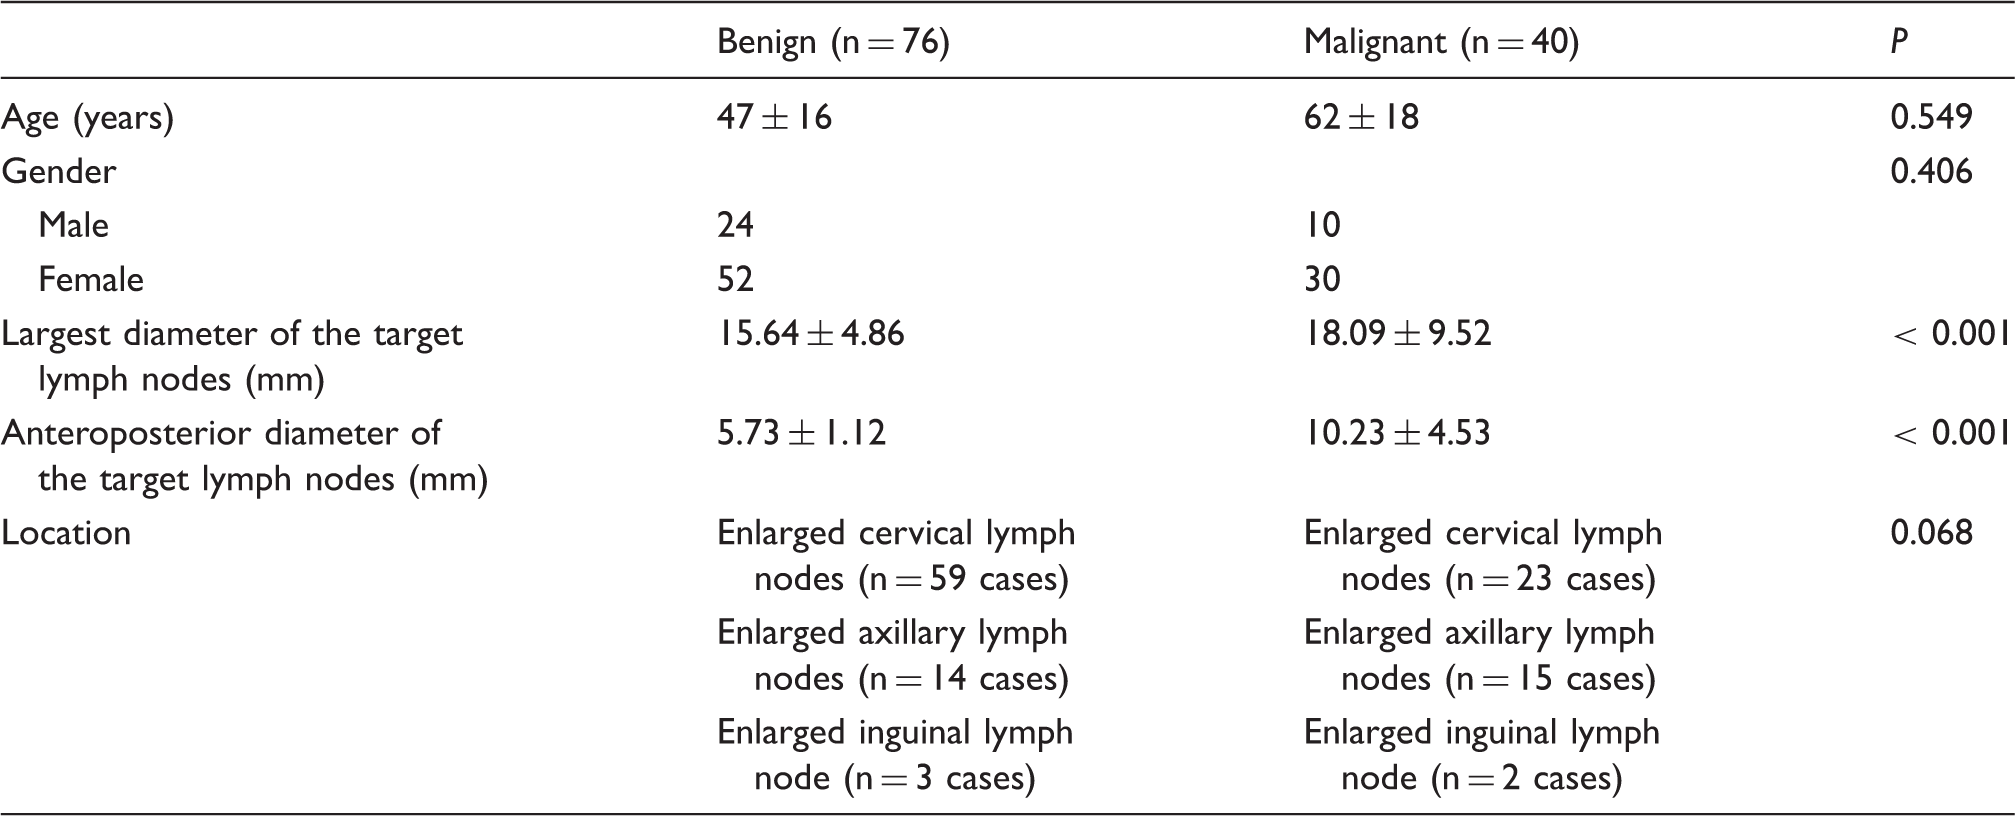
All 116 patients underwent pathological examination. There were 40 patients with malignant lymph nodes (10 men, 30 women) and 76 patients (24 men, 52 women) with benign lymph nodes. Benign lymph nodes included reactive hyperplasia (n = 68), tuberculous lymphadenitis (n = 2), and inflammatory reactive hyperplasia (n = 6). Malignant lymph nodes included metastatic lymph nodes (n = 34) and lymphomas (n = 6). All of the 116 cases underwent biopsy.
Baseline characteristics and comparison of benign and malignant group
Characteristics of the patients.
Characteristics of the lymph nodes with benign and malignant lymph nodes.
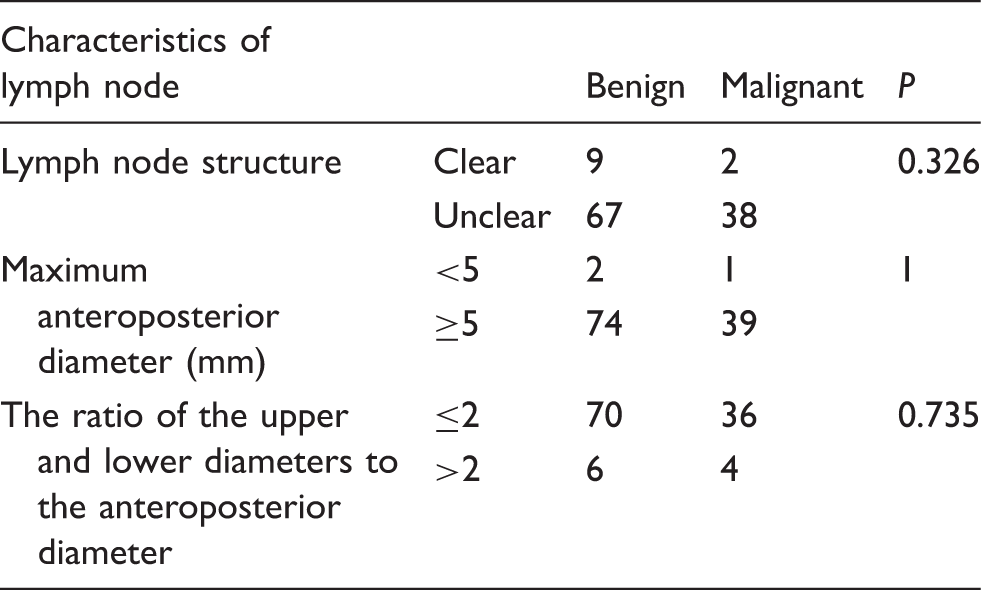
Unclear lymph node structure meant the disappearance of the hilus; internal liquefaction, necrosis, or calcifications could also be observed. Clear lymph node meant that the hilus could be easily seen.
Inter-examiner consistency of VTIQ quantification
VTIQ examination of 68 lymph nodes was independently performed by two different examiners. The results obtained by the two examiners were tested by ICC analysis and was found to be consistent. There was no significant difference in Vmax, Vmin, Vmean, and Vn calculated by the two examiners, and the ICC values were 0.82, 0.80, 0.78, and 0.81, respectively.
Differential diagnosis of benign and malignant lymph nodes by VTIQ
VTIQ in benign and malignant lymph nodes.
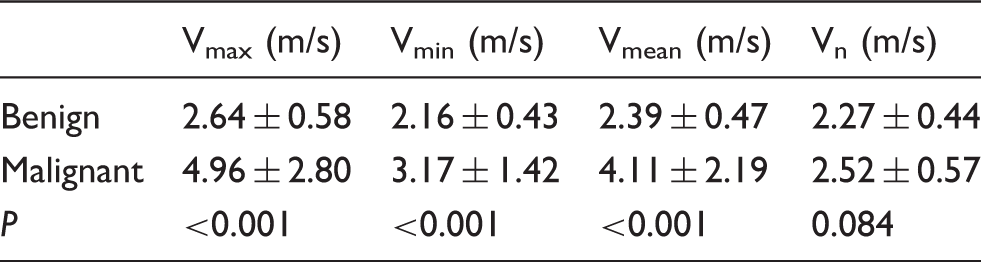
Maximum (Vmax), minimum (Vmin), and mean SWV (Vmean) in the target and surrounding normal tissue (Vn).
The values are shown as mean ± SD.
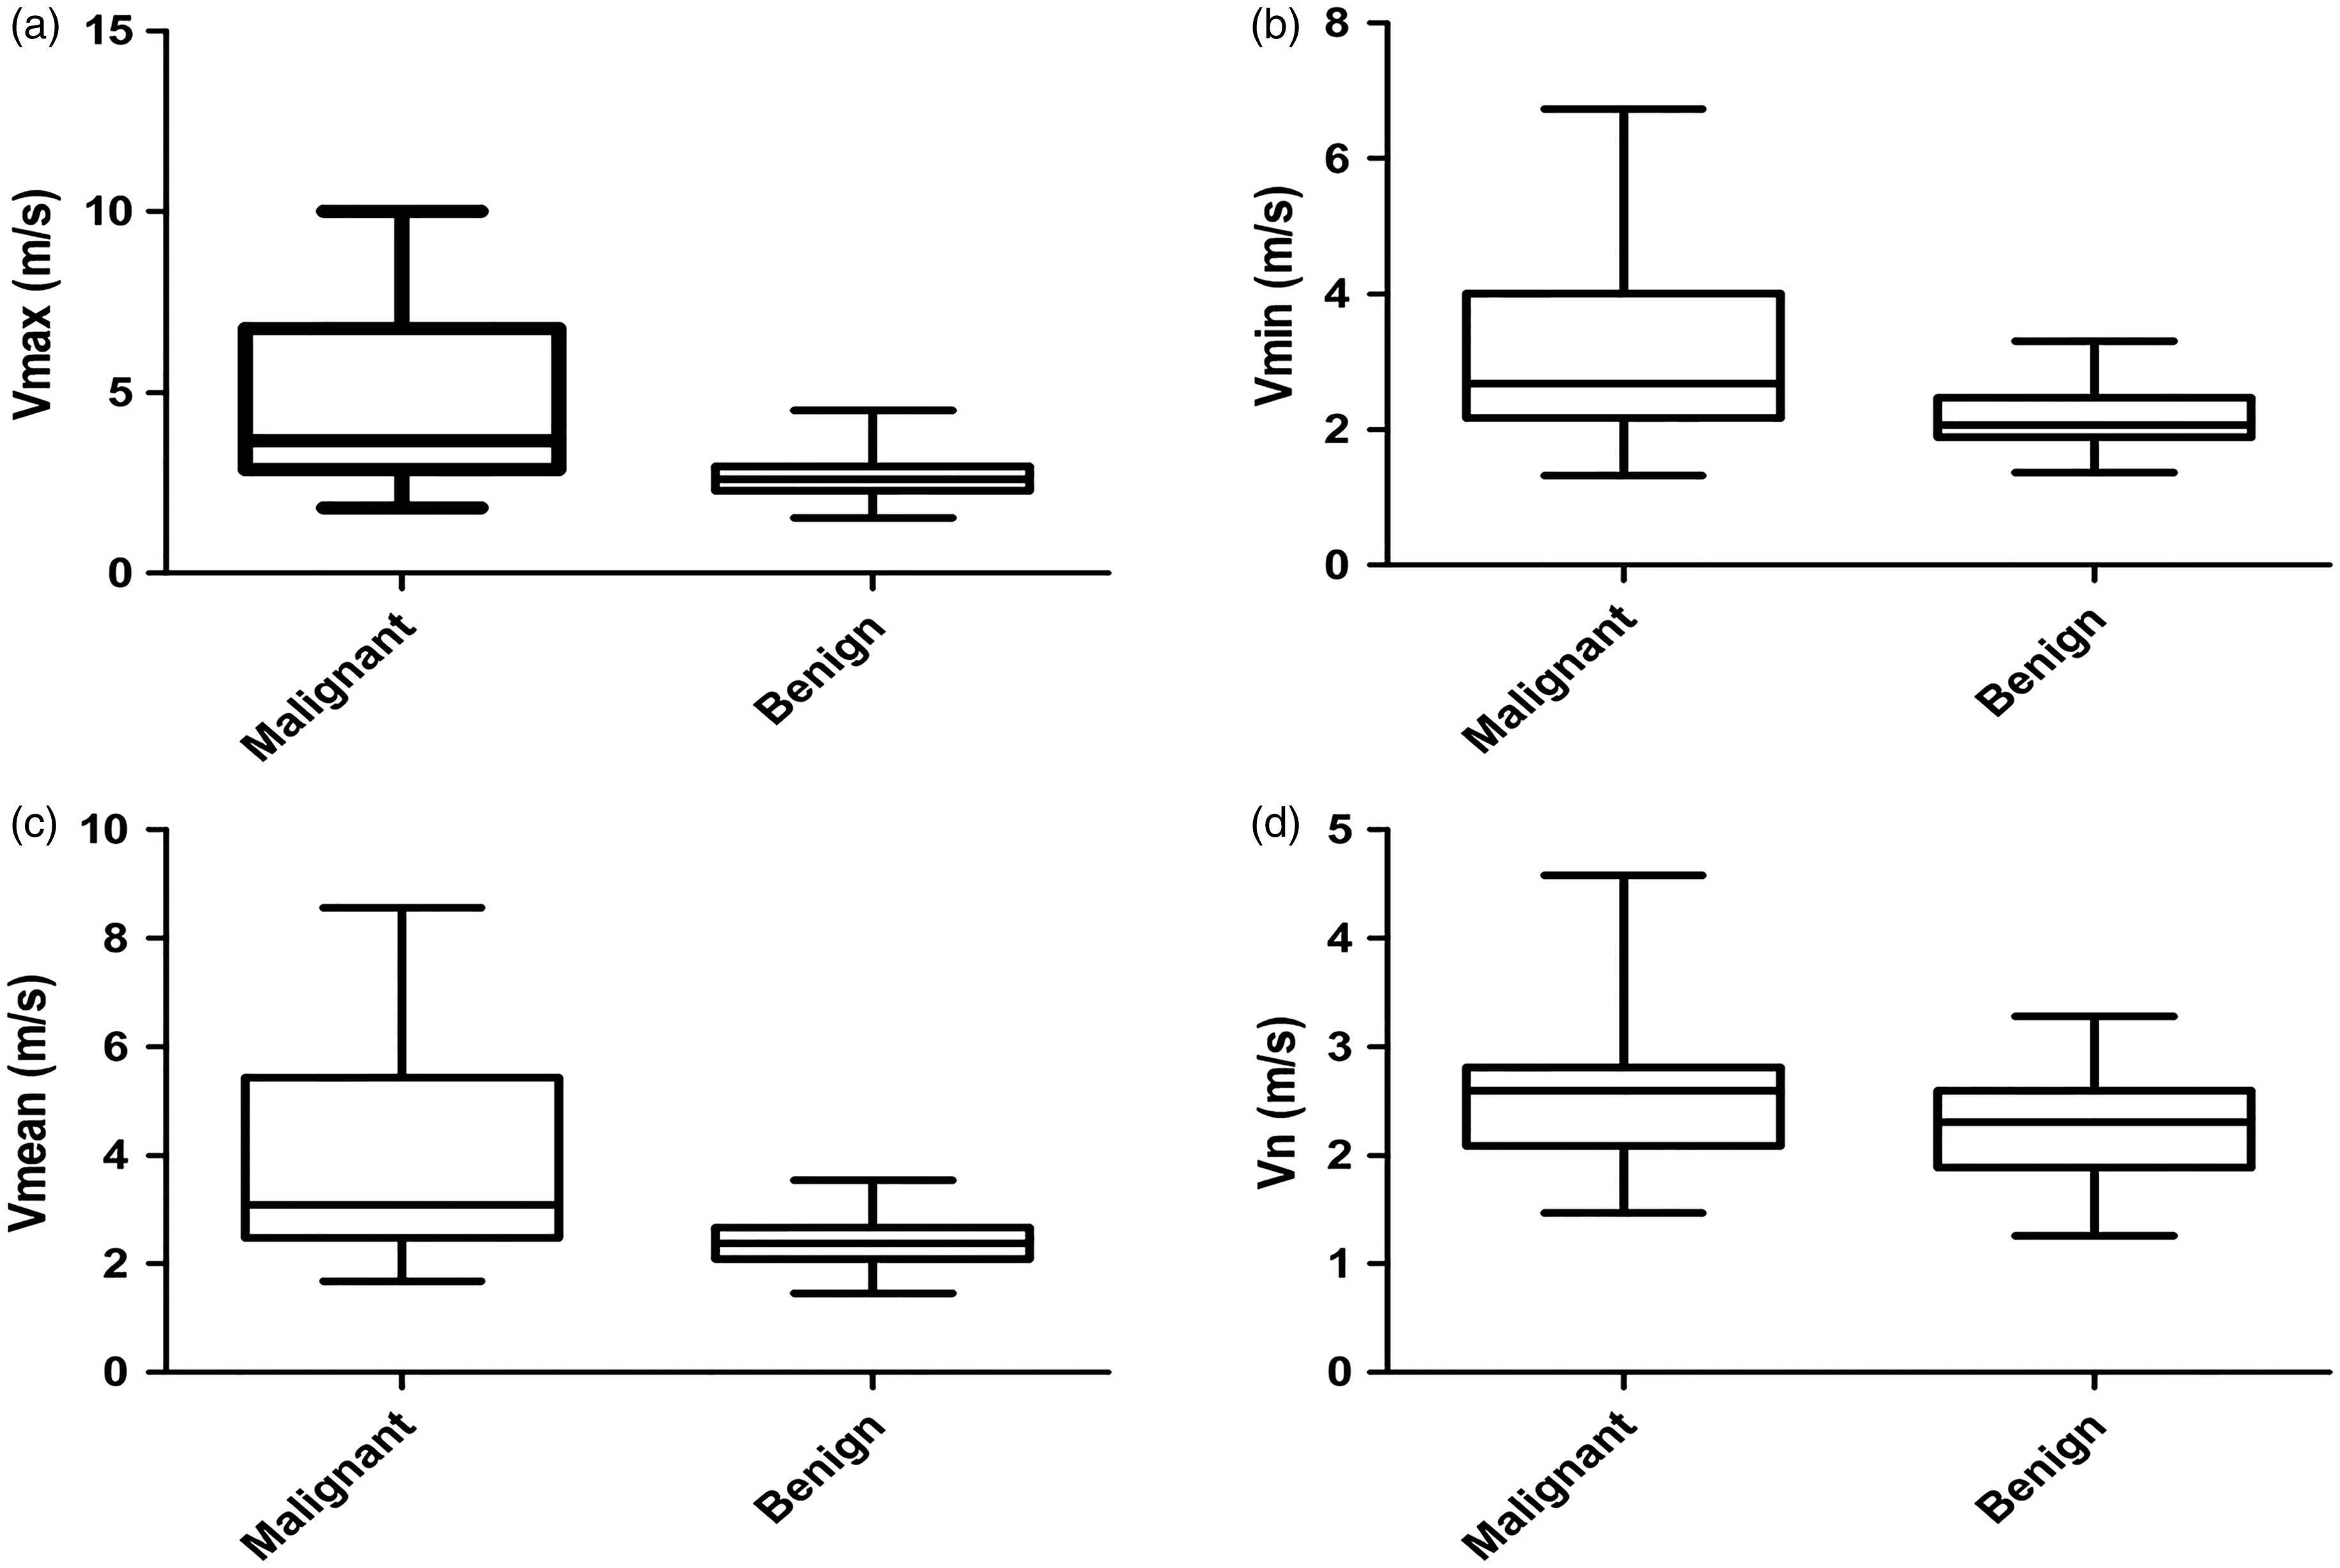
VTIQ parameters for benign and malignant lymph nodes. Box plots of (a) Vmax, (b) Vmin, and (c) Vmean for benign and malignant lymph nodes. (d) Comparison of the surrounding normal tissues between the benign and malignant group.

ROC curves of SWV curves. The ROC curves for maximum, minimum, and average SWV of benign and malignant lymph nodes.
ROC curve analysis of VTIQ between benign and malignant lymph nodes.
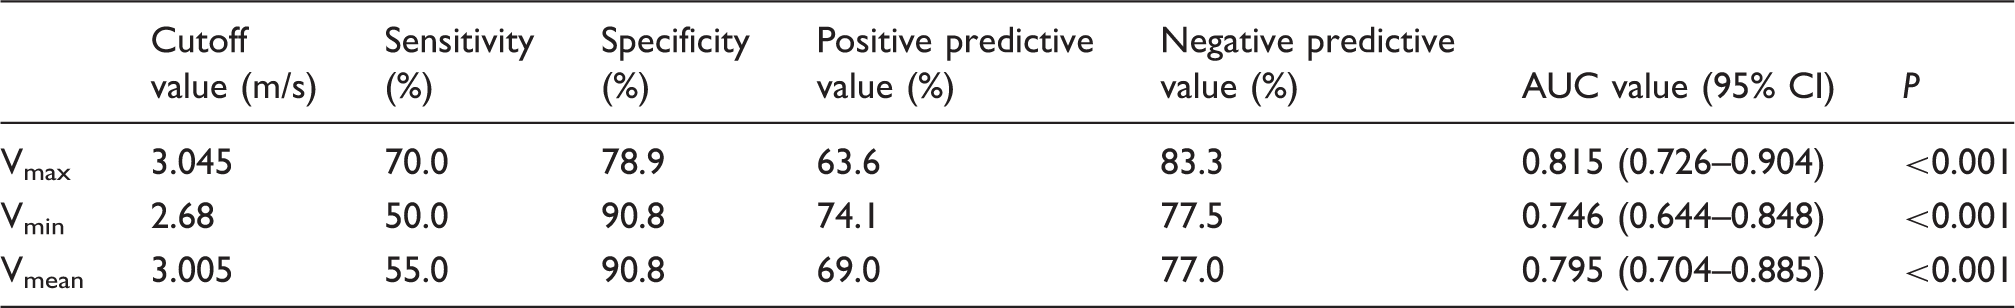
CI, confidence interval.
Discussion
Lymph node enlargement is a common clinical finding in clinical practice, but the ultrasound features that could discriminate malignant from benign nodes are poorly known. Therefore, this study aimed to investigate the application of VTIQ to diagnose benign and malignant superficial enlarged lymph nodes. The results showed that VTIQ has a clinical application in the differential diagnosis of superficial enlarged lymph nodes.
Biopsy is a common method to discriminate between pathological conditions of lymph nodes (16,18,19), but its limitations include risk of bleeding due to invasive procedure and false-negative diagnosis. Using conventional B-mode ultrasound, reproducibility of the results is poor, and there is a lack of unified and quantitative standard for the diagnosis of benign and malignant lymph nodes (20). In addition, an examination based solely on ultrasound morphology can lead to diagnostic uncertainties causing increased management costs and decreased quality of life in patients (21). VTIQ is used to quantitatively evaluate the stiffness of lymph nodes. Most studies show that stress elastography is superior to B-mode ultrasound (22), but some studies have also shown that elastography does not improve the diagnostic accuracy compared to conventional ultrasound diagnosis (22). Recent studies have used SWE along with B-mode ultrasound and color Doppler for the diagnosis of cervical lymphadenopathies (11,23–28).
In this study, we used SWE to determine tissue stiffness and diagnose malignancy in lymph nodes (cervical, axillary, and inguinal). We found that Vmax, Vmin, and Vmean were significantly different between benign and malignant lymph nodes using pathological examination as the gold standard. VTIQ showed 70.0% sensitivity and 78.9% specificity at the cutoff value of 3.045 m/s. The AUC of Vmax was used as the diagnostic criteria (Vmax = 0.815). This was different from the study of Cheng et al. (11), where 3.34 m/s was used as the cutoff value for diagnosis. Nevertheless, the sensitivity and specificity of the two studies are similar due to location, pathological characteristics, and numbers of lymph nodes. This indicates that VTIQ has consistent clinical application in the diagnosis of superficial lymph nodes. We also found two cases of benign lymph nodes in which the SWV was higher and the Vmax value exceeded the SWV cutoff value. We propose that this could be due to significant fibrosis and partial tissue calcification. In addition, VTIQ has been used for the examination of superficial tissues such as thyroid nodules, breast masses, and superficial enlarged lymph nodes, where the depth was < 20 mm (29,30). Thus, VTIQ is not suitable for deep tissue analysis.
We also tested inter-examiner variability of 68 lymph nodes that were independently examined by two physicians using VTIQ. We found that Vmax, Vmin, Vmean, and Vn were not significantly different between the two physicians. The consistency between examiners strongly suggests that VTIQ results are not related to the experience of the examiners or artificial interferences.
Further investigation is required to address the caveats of this study. The proportion of benign and malignant nodules was not similar. The participants in this study were cancer patients and many of them had enlarged inguinal lymph nodes due to inflammation and hence were excluded from the study. Their enlarged lymph nodes regressed after anti-inflammatory therapy, but the diagnoses of these patients were not confirmed by pathological examinations. This led to a skewed proportion of cervical, axillary, and inguinal lymphadenopathies; also, these patients may have other symptoms which may contribute to the observations made in this study. Furthermore, there was no comparative analysis on the cause of the metastatic lymph nodes. The effect of location and depth of the lymph nodule and breathing on the SWV also need to be further examined. There were some complications in biopsy of the superficial lymph nodes. As there are vessels and nerves around the enlarged lymph node, biopsy may result in vessel and nerve injury. The tissues from biopsy were less and thus high standards for pathological diagnosis could not be achieved.
In conclusion, VTIQ could be used to evaluate the nature of enlarged lymph nodes more accurately and provide more information than B-mode ultrasound. Eventually, patients could avoid the pain of surgery or biopsy, but additional studies are necessary to improve our understanding of the role of VTIQ in the evaluation of enlarged lymph nodes. Nevertheless, this study for the first time investigates the use of VTIQ for the diagnosis and differentiation of benign and malignant lymph nodes in the whole body and provides evidence that this non-invasive, real-time, sensitive technique can indeed be a potent diagnostic tool for lymphadenopathies.
Footnotes
Acknowledgments
The authors thank Drs. Rong Huang, Rong Ge, and Ying Miao from the Ningbo Pathological Diagnosis Center for their help in the pathological diagnosis.
Declaration of Conflicting Interests
The author(s) declare no potential conflicts of interest with respect to the research, authorship, and/or publication of this article.
Funding
The author(s) received no financial support for the research, authorship, and/or publication of this article.