




Abstract
Background
18F-fluorodeoxyglucose positron emission tomography/computed tomography (18F-FDG-PET/CT) has been widely used in clinical practice. However, the prognostic value of the pre-treatment standardized uptake value (SUV) for patients with small-cell lung cancer (SCLC) remains controversial.
Purpose
To investigate the prognostic role of pre-treatment 18F-FDG PET on SCLC patients by meta-analysis.
Material and Methods
Extensive literature searches of the PubMed, EMBASE, Web of Science, and Cochrane Library databases were conducted to identify literature published until 5 May 2017. Comparative analyses of the pooled hazard ratios (HRs) for event-free survival (EFS) and overall survival (OS) were performed to assess their correlations with the pre-treatment maximum SUV (SUVmax). Either the fixed- or the random-effects model was adopted, depending on the heterogeneity observed across the studies. Subgroup analyses were performed to assess the robustness of the results.
Results
Twelve studies with 1062 patients were included. The pooled HR for OS of 11 studies was 1.13 (95% confidence interval [CI] = 1.05–1.22; P = 0.001; I2 = 0%) and the pooled HR for EFS of nine studies was 1.09 (95% CI = 1.02–1.17; P = 0.014; I2 = 0%), indicating that patients with high SUVs may have poorer prognoses. Begg’s test detected no significant publication bias. The prognostic role of the SUVmax remained similar in the subgroup analyses.
Conclusion
Our meta-analysis indicated that the pre-treatment SUVmax of primary lesions can be an important prognostic factor for OS and EFS in patients with SCLC. A high SUVmax may indicate poorer prognosis.
Keywords
Introduction
Small-cell lung cancer (SCLC) is a fast-growing aggressive type of cancer that is characterized by early extra-thoracic metastases at initial presentation. In the United States, in 2015, there were 31,000 new cases of SCLC (1). SCLC is usually classified according to the Veterans Affairs Lung Study Group as a limited disease (LD) or an extensive disease (ED) (2). An LD is defined as a disease that is confined to the ipsilateral hemithorax and that can be encompassed within a tolerable radiation port. An ED is defined as a disease extending outside the ipsilateral hemithorax, including malignant pleural effusion. Staging, age at diagnosis, and performance status have been shown to have prognostic value for SCLC (3). However, none of them can accurately assess the prognosis of patients in clinical practice.
In the early 1990s, 18F-fluorodeoxyglucosepositron emission tomography (18F-FDG PET) entered clinical usage as a practical imaging technique in the regulation of neoplastic disorders, and it was also applied in staging, restaging, and monitoring of the treatment response in a variety of tumors (4). In addition, various FDG parameters have been discussed during or after chemotherapy and radiotherapy as independent prognostic factors for outcome in numerous malignant tumors (5–7). Standardized uptake value (SUV) is a semi-quantitative measure of the normalized concentration of radioactivity in a lesion and the maximum SUV (SUVmax) is one of the most widely used parameters in clinical practice. It is supposed to be a prognostic marker in some malignancies (5,8).
However, a number of studies have reported conflicting results of the prognostic value of the SUVmax in SCLC patients. Thus, this meta-analysis and systematic review was aimed at evaluating the prognostic values of 18F-FDG-PET/CT for survival outcomes in patients with SCLC.
Material and Methods
Literature search
We systematically searched the databases PubMed, EMBASE, the Cochrane library, and Web of Science for relevant articles until 25 September 2017. The keywords “small-cell lung cancer,” “small-cell lung carcinoma,” “PET,” “positron emission tomography,” “18F-FDG,” “18-fluoro-deoxy-glucose,” “F-18-fluorodeoxyglucose,” and “2-fluoro-2-deoxy-D-glucose” were used to summarize the search strategy. Moreover, relevant files or supplementary files included with the publications were carefully reviewed to identify the available data.
Selection of studies
The inclusion criteria were as follows: (i) patients were histopathologically diagnosed with SCLC; (ii) the study was identified as a case-control or cohort study; (iii) at least one 18F-FDG-PET/CT scan was performed before treatments, including chemotherapy, surgical therapy, and/or radiotherapy; (iv) at least one relevant prognostic factor was assessed, such as overall survival (OS), event-free survival (EFS), disease-free survival (DFS), progress-free survival (PFS), or disease metastasis-free survival (DMFS); (v) hazard ratios (HRs) and 95% confidence intervals (CIs) were available or able to be calculated based on the data from the original articles; and (vi) the study was published in English.
The exclusion criteria were as follows: (i) performed in vitro studies and animal experiments; (ii) categorized as reviews, comments, letters, case reports, or conference abstracts; (iii) provided insufficient data to calculate the HRs and 95% CIs; (iv) limited research to investigating the role of PET-CT scans in diagnosis and tumor staging, and/or did not provide prognostic parameter data; and (v) only focused on the SUV of metastatic lymph nodes, surgical anastomosis, or distant metastatic sites rather than the primary tumor lesions.
Data extraction
Two authors (JC and YFW) performed the data extraction independently from the publications. A Microsoft Excel sheet was designed to collect the following items: (i) basic information for each study, including author names, year of publication, study period, follow-up duration, study design; (ii) details regarding the patients and tumors, including each patient’s origin, number, median age, staging, and endpoints provided; and (iii) data from the 18F-FDGPET scan and parameters, including PET scanners, duration of fasting before FDG injection, pre-injection blood glucose test, radiation doses of FDG, post-injection interval, the method of determination of cut-off values, PET parameters, tumor delineation, and cut-off values of the SUVmax.
Methodological quality for potentially included studies according to Newcastle–Ottawa scale in this meta-analysis.

Statistical analysis
In this meta-analysis, we followed the same methodology as was used in the Pak et al. study (10). The primary endpoint was EFS. DFS, PFS, and DMFS, which are newly defined as EFS, were obtained as primary outcomes from the included studies and were measured from the date of initiation of therapy to the date of recurrence or metastasis (11). The secondary endpoint was OS, which was measured from the date of initiation of therapy to the date of death from any cause. Univariate and multivariate HRs and their 95% CIs, P values for the log-rank test, and necessary statistics such as 95% CIs, the number of events, and the number included in each group assessed using Kaplan–Meier curves were recorded. Then, we used the methods suggested by Parmar et al. and Williamson et al. to convert these data into logHRs and SEs (12,13). HR values were calculated by applying a spreadsheet and using the methods suggested by Tierney et al. (14). A HR >1 indicated a worse prognosis in patients with high parameter values, and a HR <1 indicated a better prognosis. The level of heterogeneity across studies was evaluated using the Chi-square test and I2 statistic, as recommended by the Cochrane Handbook for Systematic Reviews of Interventions (http://handbook.cochrane.org). If the P value was >0.1 and the I2 value was <50%, no or moderate heterogeneity was indicated and the fixed-effects model was used; otherwise, the random-effects model was used when significant heterogeneity was observed. Begg’s funnel test and Egger’s test were performed to assess publication bias. The analyses described above were conducted using STATA version 12.0 (STATA Corp., College Station, TX, USA). P values <0.05 were considered statistically significant.
Results
Study characteristics and qualitative assessment
The electronic search identified 1264 articles. After excluding 29 articles in languages other than English, 268 conference abstracts, and 931 studies that did not meet the inclusion criteria based on title and abstract, and after reviewing the full text of 24 articles, 12 studies including 963 patients were eligible for inclusion in this study (15–26) (Fig. 1). The primary characteristics of the enrolled studies are presented in (Suppl. Table 1) and detailed information regarding the PET protocol is shown in (Suppl. Table 2).
Flowchart for the identification of eligible studies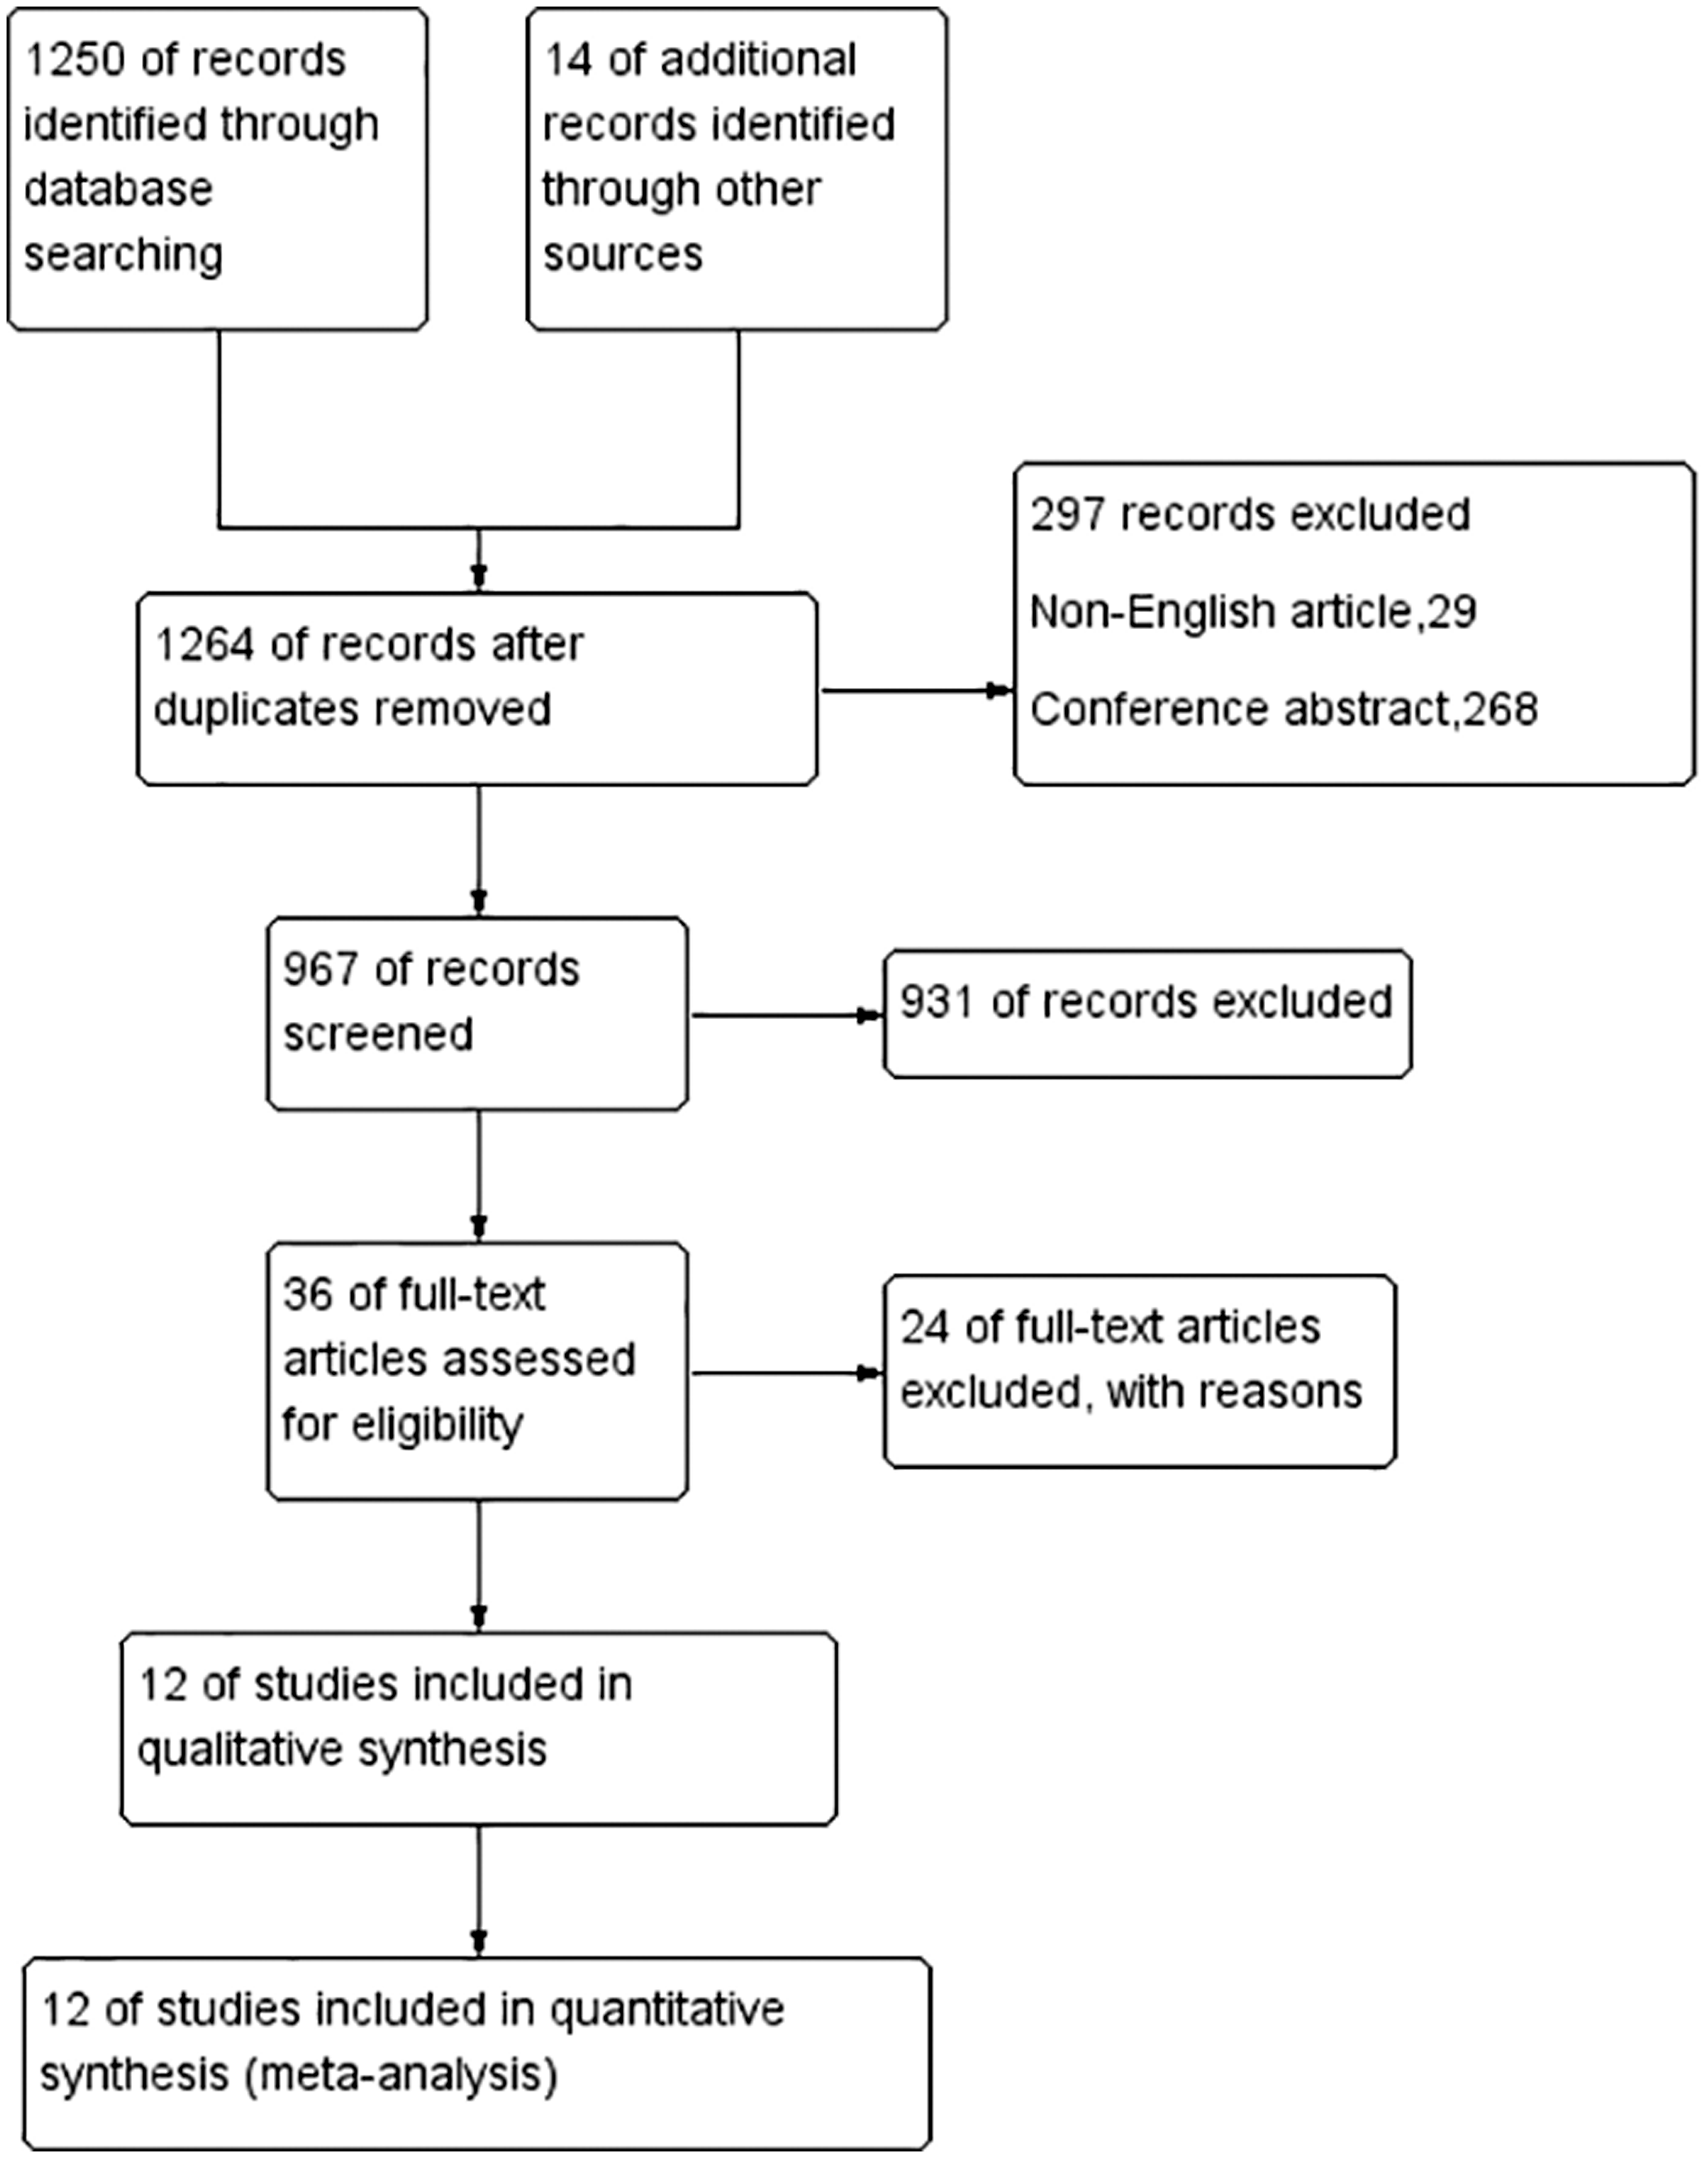
We excluded studies in which the lesions (volume of interest) used to measure the SUV were defined in the sum of the SUVmax values of malignant lesions, metastatic lymph nodes, surgical anastomosis, and distant metastatic sites. All 12 studies presented the maximum SUVs of primary lesions of SCLC, and all reported pre-treatment values. Among the 12 included studies, two studies (16,18) reported OS, one study (17) reported PFS, one study (19) reported both OS and DFS, one study (23) reported both OS and the locoregional control rate (LCR), and seven studies (15,20–22,24–26) reported PFS and OS. For the determination of the cut-off values for high and low SUVs, five studies (15,17,19,25,26) used the receiver operating characteristic (ROC) and seven studies (16,18,20–24) used medians as the threshold values. Five studies evaluated the patients in the LD stage (15,19,20,23,26). Of these included studies, 12 provided sample size data and the sample sizes of all the included studies were in the range of 46–142 (median = 80). The follow-up duration was in the range of 10–38 months (median = 20 months). The median cut-off point was 10.8 (range = 7.8–16) for the SUVmax. All the studies were retrospective. The NOS scores for the studies are shown in Table 1 and all the included studies had scores > 6.
Primary outcome: EFS
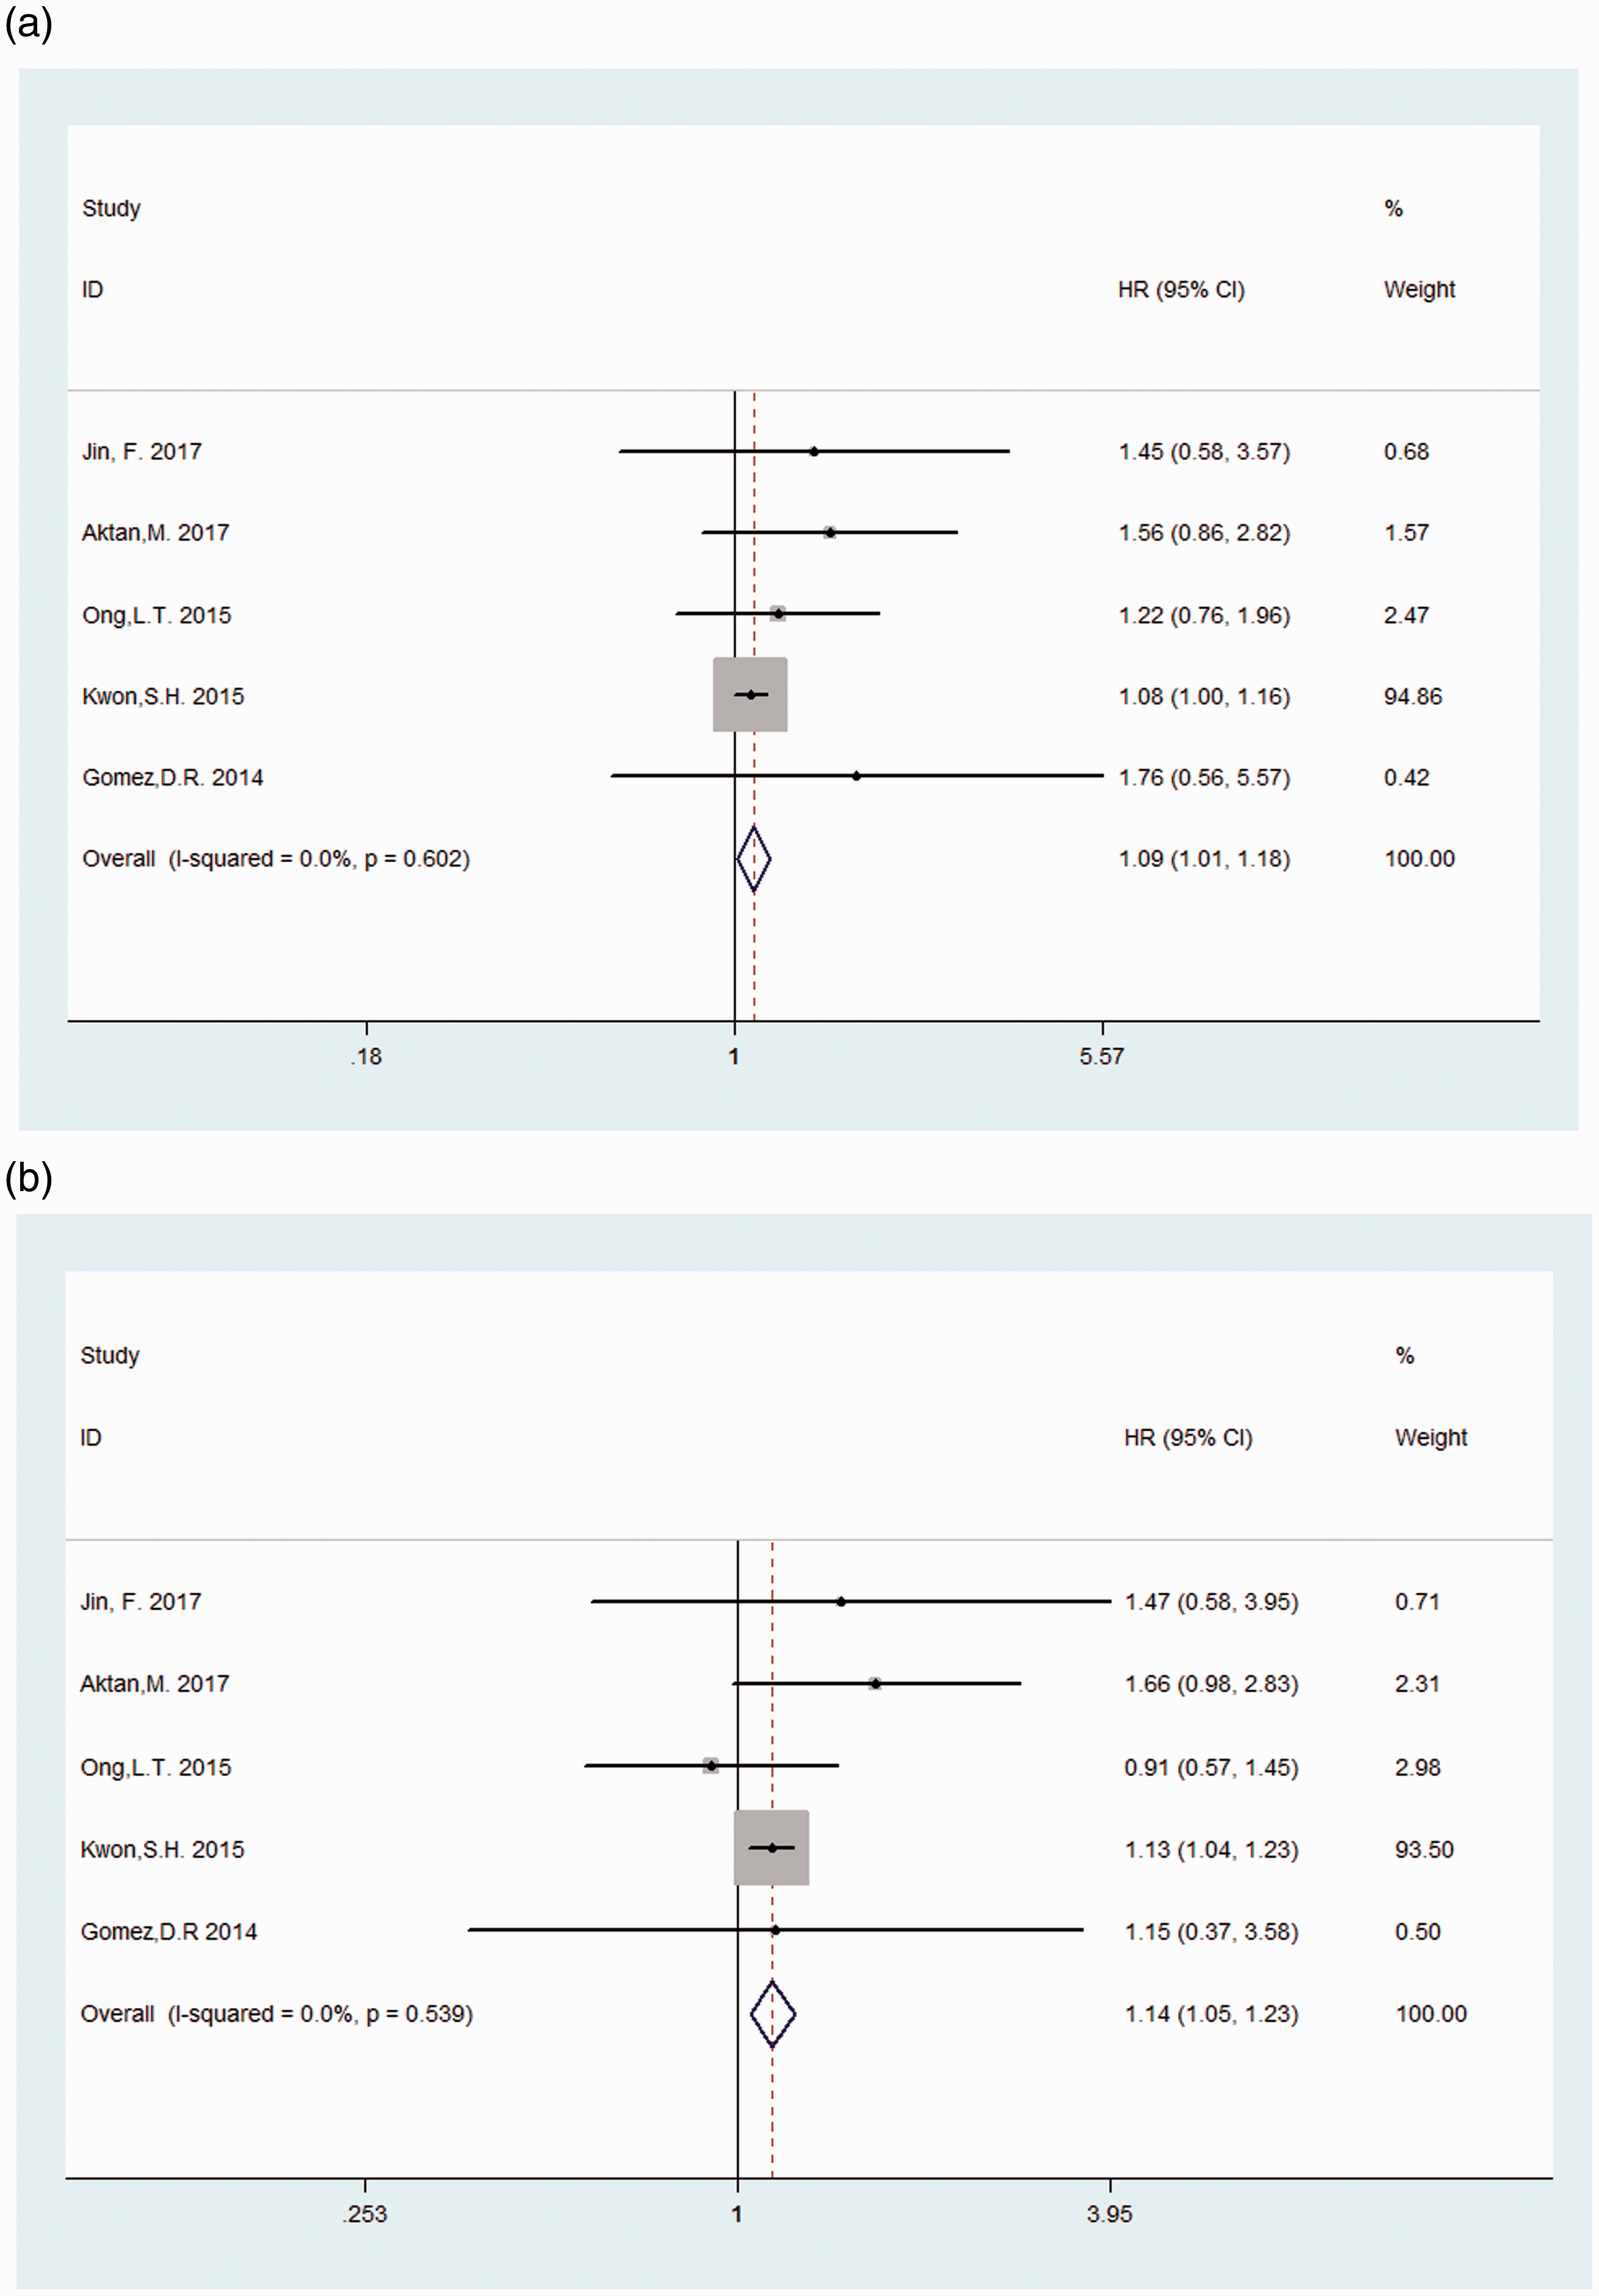
Nine studies were included to determine the association between the SUVmax and EFS, and the combined data revealed that a high SUVmax predicted poor EFS (HR = 1.09; 95% CI = 1.02–1.17; P = 0.014; I2 = 0%) (Fig. 2a). Among these studies, five evaluated the patients in the LD stage, which had an HR of 1.09 (95% CI = 1.01–1.18; P = 0.020) (Fig. 3a), while four studies did not distinguish the patients according to the stages. None of the studies analyzed the pre-treatment SUVmax in ED SCLC separately.
Forest plots of HRs for EFS and OS with SUVmax (a, EFS; b, OS). The Chi-square test is a measurement of heterogeneity. P < 0.05 indicates significant heterogeneity. Squares = individual study point estimates, horizontal lines = 95% CIs, rhombus = summarized estimate and its 95% CI. Fixed, fixed effect model; Random, random-effects model. Nobashi 2015a is the result of the central type of SCLC and Nobashi 2015b is the result of the peripheral type of SCLC. Forest plots of HRs for EFS and OS with SUVmax in LD-SCLC (a, EFS; b, OS)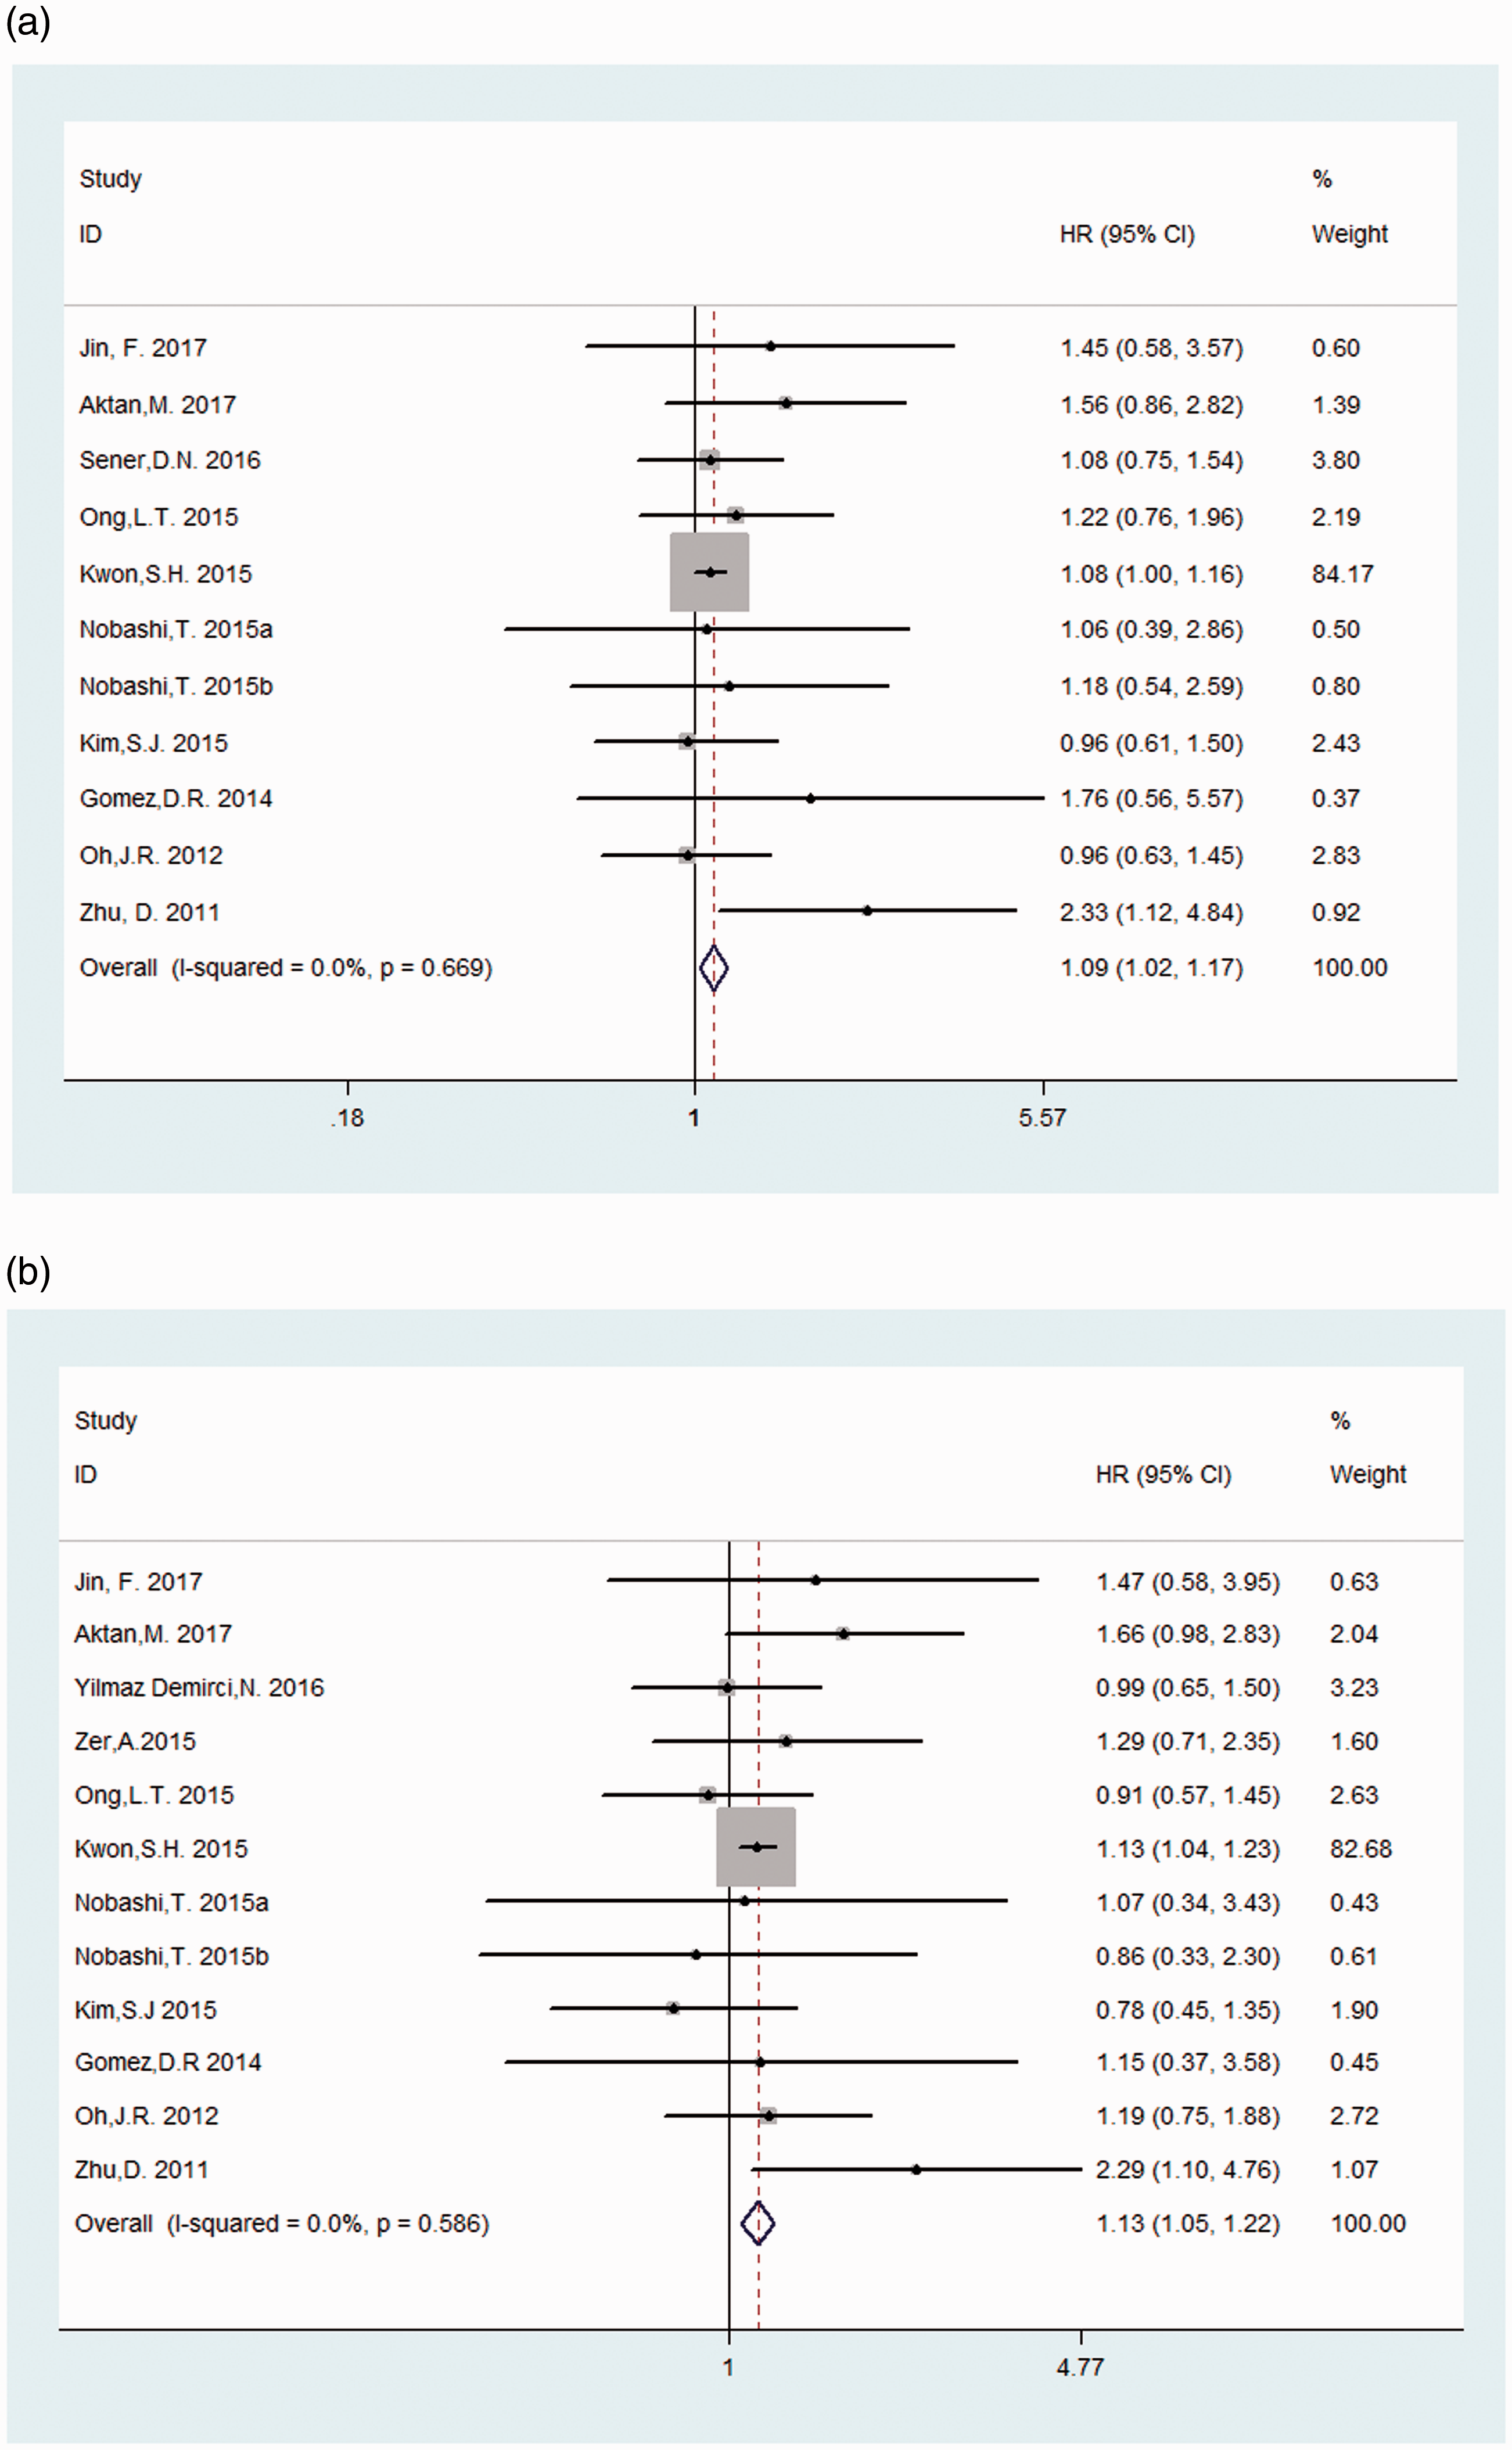
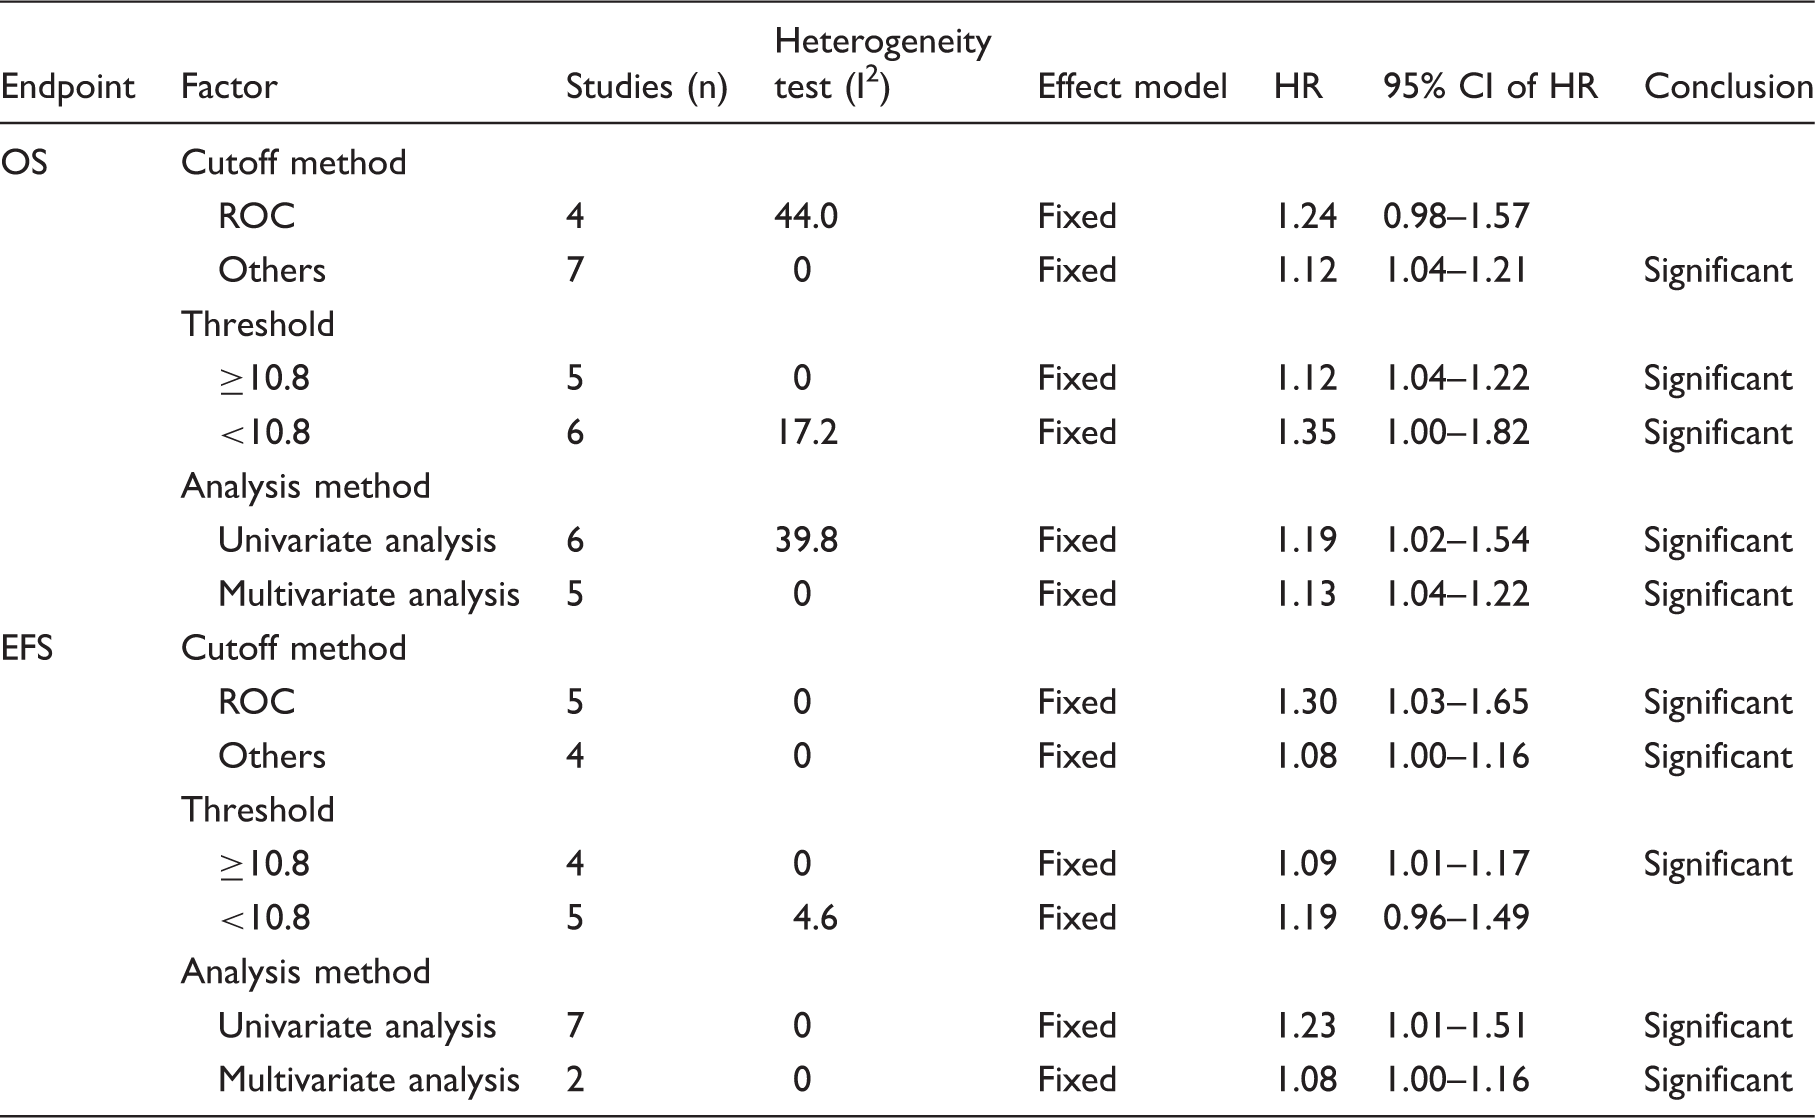
Meta-analysis of the associations between 18F-FDG PET parameters and survival outcomes.
Secondary outcome: OS
Eleven studies were included to assess the correlation between the SUVmax and OS. There was no significant heterogeneity (χ2 = 9.39; P = 0.586; I2 = 0%) among these studies, so the fixed-effects model was applied to calculate the pooled HR (1.13; 95% CI = 1.05–1.22; P = 0.001) (Fig. 2b). Among these studies, five evaluated the patients in the LD stage, which had an HR of 1.14 (95% CI = 1.05–1.23; P = 0.002) (Fig. 3b), and the other six studies did not distinguish the patients according to the stages. None of studies researched the pre-treatment SUVmax in ED SCLC separately.
The results of the subgroup meta-analysis were demonstrated as follows. Among the studies including the SUVmax, with four studies using the ROC method, the HR of those with cut-off values was 1.24 (95% CI = 0.98–2.45; P = 0.069), and that of seven studies using other methods was 1.13 (95% CI = 1.05–1.22; P = 0.001). Five studies with a high cut-off value had an HR of 1.12 (95% CI = 1.04–1.21; P = 0.004), while the HR of six studies with a low cut-off value was 1.35 (95% CI = 1.00–1.82; P = 0.050). Additionally, six studies using univariate analysis had an HR of 1.19 (95% CI = 1.02–1.54; P = 0.046), and the HR of five studies using multivariate analysis was 1.13 (95% CI = 1.04–1.22; P = 0.003) (Table 2).
Publication bias
Begg’s and Egger’s tests were conducted to assess the publication bias. Funnel plots showed the correlations of the SUVmax and OS (Fig. 4). Visual observation of Begg’s funnel plot and estimation of the P values did not identify substantial asymmetry.
Funnel plots. The pseudo 95% CI is computed as part of the analysis that produced the funnel plot and corresponds to the expected 95% CI for a given standard error (SE). HR, hazard ratio.
Discussion
18F-FDG PET/CT is now commonly used with promising outcomes in the initial diagnosis, staging work-up, and early detection of recurrence and metastasis in many kinds of cancer. From the recent literature, the metabolic parameters of 18F-FDG PET/CT cannot only be used to reflect the biological characteristics of the tumor but also be used to evaluate clinical prognosis (27,28). At present, SUV is still the most popular metric routinely used and is included in 90% of PET reports (29); thus, it is considered the most frequently used value in diagnosis and therapeutic evaluation because of its high practicability, sensitivity, and efficiency. Several studies have reported that high SUV values in 18F-FDG PET as a prognostic factor are associated with a poorer clinical outcome in patients with various malignancies, such as head-and-neck cancer, colorectal cancer, gastric cancer, and non-SCLC (30–32). There are some conflicting findings with regard to whether 18F-FDG PET plays an important role as a predictive or prognostic factor in SCLC. As it is generally known, SCLC tends to be more aggressive and disseminate early in the disease course, which leads to relatively worse prognoses because of its high cellular turnover and very active metabolism. Some researchers have also reported other PET metabolic parameters based on the SUVmax, meanSUVmax and meanSUVmean, which are also independent prognostic factors associated with OS and EFS in pre-treatment SCLC patients (23,25,33). There is a thread of connections showing that the parameters reflecting the entire tumor metabolic burden, such as the sum of the SUVmax (sumSUVmax), metabolic tumor volume (MTV), or total lesion glycolysis (TLG), are more effective predictors of survival in patients with SCLC than the SUVmax at a single site or the mean SUVmax (18–21,24,25). However, our meta-analysis showed that the SUVmax of primary lesions of pre-treatment SCLC could also be an independent prognostic factor for poorer OS and EFS. By quantitative analyses, the risk of death in the high SUV group was 1.13 times higher than that in the low SUV group in OS (95% CI = 1.05–1.22; P = 0.001) and 1.09 times higher than the low SUV group in EFS (95% CI = 1.02–1.17; P = 0.014).
Indeed, only 2/11 studies of OS and only 1/9 studies of EFS showed positive results. However, the pooled results of both are positive. The results of the subgroup analyses showed small and acceptable variations in the HRs for OS and EFS associated with the SUVmax. Through subgroup analysis, finding a subgroup that has a stronger risk–benefit ratio is very useful (34). To evaluate the effects of the methods utilized by each study (Table 2), we performed subgroup analyses by the cut-off method, threshold analysis method, and analysis method. The prognostic role of the SUVmax remained similar in the subgroup analysis, although very few results were different. For instance, ROC curves were used to determine the optimal cut-off point, which has been reported to be a more reasonable method for cut-off calculation. However, in our meta-analysis, the result was different; when using the ROC cut-off method in OS, the HR was 1.24 (95% CI = 0.98–1.57; P = 0.069). One possible explanation is that the decrease in the sample size can lead to a decrease in the test efficiency and an increase in the CI. Thus, future multicenter studies are needed to validate our findings.
Chemotherapy remains the cornerstone treatment for all stages of SCLC. Patients with LD are treated with combined concurrent chemoradiotherapy and patients with ED are treated with chemotherapy alone. Despite therapeutic heterogeneity in terms of different chemotherapy regimens and the combination of chemotherapy and TRT, no significant differences were found between analyzing LD-SCLC separately and combining LD-SCLC with ED-SCLC when considering the SUVmax in a prognostic role. In a study by van der Leest et al., where 75 patients with SCLC who underwent PET/CT imaging for staging were evaluated, the SUVmax of the primary tumor was higher in ED than in LD (35). In contrast, OS was shown to be longer with a higher primary tumor SUVmax in ED related to the chemo-sensitivity of tumors with higher mitotic activity, resulting in a better response rate to chemotherapy in these patients. These conflicting results support the idea that there are more complex mechanisms that make the prediction of prognosis harder with the metabolic parameters in SCLC.
Moreover, this study has a few limitations. First, the presence of clinical heterogeneity in the study design may have affected the general results. Although all of the included studies were evaluated by NOS scores and considered high quality, some studies still lacked some patient details and 18F-FDG PET scan data. Further, more prospective studies combining the survival rate of SCLC and PET parameters are required. Second, we included only English articles, so the potential effect of language bias should not be ignored. Finally, Engauge Digitizer was used to extract the HR data from survival curves, which may have indirectly led to imprecision. However, despite these limitations, this is the first meta-analysis that evaluated the prognostic value of the SUVmax in SCLC. We found that patients with a high pre-treatment SUVmax tend to have a poor prognosis.
In conclusion, this meta-analysis demonstrated that the pre-treatment SUVmax in primary lesions can be an important prognostic factor for OS and EFS in patients with SCLC. A high SUVmax may indicate a poor prognosis. Future multicenter studies are needed to validate our findings and to further explore the significant prognosis value of other 18F-FDG PET/CT parameters in prolonging the survival of SCLC patients.
Footnotes
Declaration of Conflicting Interests
The author(s) declared no potential conflicts of interest with respect to the research, authorship, and/or publication of this article.
Funding
The author(s) received no financial support for the research, authorship, and/or publication of this article.