



Abstract
Background
One significant barrier to incorporate Alzheimer’s disease (AD) imaging biomarkers into diagnostic criteria is the lack of standardized methods for biomarker quantification. The European Alzheimer’s Disease Consortium-Alzheimer’s Disease Neuroimaging Initiative (EADC-ADNI) Harmonization Protocol project provides the most authoritative guideline for hippocampal definition and has produced a manually segmented reference dataset for validation of automated methods.
Purpose
To validate automated hippocampal volumetry using AccuBrain™, against the EADC-ADNI dataset, and assess its diagnostic performance for differentiating AD and normal aging in an independent cohort.
Material and Methods
The EADC-ADNI reference dataset comprise of manually segmented hippocampal labels from 135 volumetric T1-weighted scans from various scanners. Dice similarity coefficient (DSC), intraclass correlation coefficient (ICC), and Pearson’s r were obtained for AccuBrain™ and FreeSurfer. The magnetic resonance imaging (MRI) of a separate cohort of 299 individuals (150 normal controls, 149 with AD) were obtained from the ADNI database and processed with AccuBrain™ to assess its diagnostic accuracy. Area under the curve (AUC) for total hippocampal volumes (HV) and hippocampal fraction (HF) were determined.
Results
Compared with EADC-ADNI dataset ground truths, AccuBrain™ had a mean DSC of 0.89/0.89/0.89, ICC of 0.94/0.96/0.95, and r of 0.95/0.96/0.95 for right/left/total HV. AccuBrain™ HV and HF had AUC of 0.76 and 0.80, respectively. Thresholds of ≤ 5.71 mL and ≤ 0.38% afforded 80% sensitivity for AD detection.
Conclusion
AccuBrain™ provides accurate automated hippocampus segmentation in accordance with the EADC-ADNI standard, with great potential value in assisting clinical diagnosis of AD.
Introduction
Hippocampal atrophy is a well-established and validated structural marker of neuronal injury in Alzheimer’s disease (AD), with potential to be diagnostic at the mild cognitive impairment (MCI) stage (1) as well as predict conversion of MCI to AD (2). It can be detected accurately with manual volumetry, although for practical purposes will depend on an automated method.
Hippocampal volumetry has been identified as a target for initial AD imaging biomarker for standardization and validation (3). The collaborative efforts of the European Alzheimer’s Disease Consortium and Alzheimer’s Disease Neuroimaging Initiative (EADC-ADNI) have laid the foundation for this endeavor and have produced a reference standard dataset of hand-drawn hippocampal volumes following a harmonized protocol (HarP) for use in the validation of automated segmentation algorithms (4). In order to generalize the EADC-ADNI HarP into common practice, it is essential that automated tools segment and quantify hippocampal volumes (HV) conforming to the EADC-ADNI hippocampal tracing standard.
To this aim, we validated AccuBrain™, which provides hippocampal volumetry in an automated mode, against the EADC-ADNI reference standard dataset. For comparison, validation of the widely used tool FreeSurfer was also undertaken. Finally, in a separate ADNI cohort, we illustrated the diagnostic performance of AccuBrain™ hippocampal volumetry for differentiating AD and normal elderly individuals.
Material and Methods
All data were obtained from the Alzheimer’s Disease Neuroimaging Initiative (ADNI) database (adni.loni.usc.edu) and no individual was directly recruited for this study. The ADNI was launched in 2003 as a public–private partnership. The primary goal of ADNI has been to test whether serial magnetic resonance imaging (MRI), positron emission tomography (PET), other biological markers, and clinical and neuropsychological assessment can be combined to measure the progression of MCI and early AD.
For the technical validation of AccuBrain™ and FreeSurfer, 135 individuals were drawn from the EADC-ADNI HarP project in works that were described previously (4–6). The individuals comprised normal controls (NC) and patients with MCI and AD, and their MRI scans were acquired from a mix of 1.5-T and 3.0-T clinical MRI scanners following the ADNI scanning protocol which are described elsewhere (http://adni.loni.usc.edu/methods/documents/mri-protocols/) (7). Briefly, the T1-weighted (T1W) scans were acquired in the sagittal plane using the MPRAGE or IR-SPGR technique and with a field of view (FOV) of 240–270 mm, in-plane resolution of 1 × 1 mm, and slice thickness of 1.2 mm. Manual hippocampal segmentation was performed by five master tracers using standardized HarP guidelines for anatomical landmarks of the hippocampus (http://www.hippocampal-protocol.net/SOPs/LINK_PAGE/FINAL_RELEASE/02_Appendix-II_HarP-UserManual.pdf). The hippocampal labels from the manual segmentation were used as ground truth for comparison with AccuBrain™ and FreeSurfer.
For the clinical validation of AccuBrain™, a separate independent cohort of 150 AD patients and 150 NC aged 65–90 years were randomly selected from the ADNI 1 and ADNI 2 phases. The individuals underwent volumetric MP-RAGE/IR-SPGR scans following the aforementioned ADNI MRI acquisition protocol which were downloaded and subsequently processed with AccuBrain™ .
Image post-processing using AccuBrain™ and FreeSurfer
Automated hippocampal volumetry was performed using AccuBrain™, a brain quantification tool that performs brain structure and tissue segmentation and quantification in a fully automatic mode. The program was executed on a personal computer with the configuration of Intel Xeon CPU E5-2683 v3 @ 2.00 GHz (2 cores) and RAM 112G, NVIDIA GPU GeForce GTX 1080. The individual brain MRI under analysis was segmented automatically in a multi-atlas-based segmentation manner. The pipeline of AccuBrain™ is shown in Fig. 1. Pre-processing techniques, including noise reduction, bias field correction, and intensity normalization to normalize intensity level of MRIs from different scanners, are first performed to increase the image quality. The atlas pool, consisting of 300 brain MRIs together with their segmentation labels, were previously obtained from different individuals using different scanners and have highly variable appearances. Each atlas contains both brain MRI and the prior encoded radiologist-specified anatomy information for over 40 brain structures (e.g. hippocampus, lateral ventricle, amygdala, etc.) and three major brain tissues (i.e. white matter, gray matter, and cerebrospinal fluid). During processing, AccuBrain™ selects a number of brain images from the atlas pool based on similarity with the subject images. The selected images and subject image are then matched with non-rigid image registration. After registration, the pre-defined labels of the atlas pool are transformed into subject space and fused to produce the segmentation labels of the subject image. In addition, to segment each subject, AccuBrain™ selects atlases having top similarities with the target image from its large atlas pool of hundreds of brain MRIs. An advanced GPU-based non-rigid registration algorithm is implemented to ensure the time efficiency. The numerical data on HV in mL and hippocampal fraction (HF), calculated as the percent of HV to intracranial volume, were recorded for analysis. The execution time for each T1W dataset in this study was approximately 25 min.

AccuBrain™ pipeline.
For comparison, automated hippocampal volumetry was also performed using the freely available automated imaging software FreeSurfer (v5.3.0) (8). FreeSurfer was executed on an Ubuntu 14.04 OS platform installed on a server cluster with eight nodes and each with RAM of 12G. The hippocampal areas were extracted from the segmentation volume and used for the study. The time required to perform analysis of one dataset was 8–10 hrs.
Statistical analysis
For technical validation, the spatial similarity between results from automatic methods (i.e. AccuBrain™ and FreeSurfer) and manual segmentation was determined using Dice similarity coefficient (DSC), calculated as twice the volume of intersection divided by the volume of the union. DSC values are in the range of 0–1, where 0 indicates no overlap and 1 represents perfect overlap. Numerical precision was reported as intraclass correlation coefficient (ICC) and their 95% confidence intervals (CI) for a single rater, calculated using a two-way model for consistency, as well as Pearson’s correlation. The latter was also employed to explore the relationship of DSC with manual HV. A Bland–Altman plot was generated to illustrate the differences between AccuBrain™ and manual segmentation measures.
To explore potential variations in AccuBrain™ performance, means of similarity indices were compared using Student’s t-test or one-way ANOVA with post-hoc analysis (Tukey). We compared the right, left, and total hippocampus DSC, while total hippocampus DSCs were used to compare the three clinical cohorts, the 1.5-T and 3-T scanners, and the different commercial manufacturers of scanners.
For clinical validation, we performed receiver operating characteristic (ROC) curve analysis to determine the diagnostic accuracy of AccuBrain™ total HV and HF for differentiating AD patients and NC in the independent ADNI cohort, represented by the area under the curve (AUC). Subgroup analysis for age (individuals aged ≤ 75 years and > 75 years) and gender were additionally performed. Thresholds affording 80% sensitivity, considered suitable for clinical studies (2), were recorded.
Statistical analysis was performed using MedCalc Statistical Software version 17.6 (MedCalc Software bvba, Ostend, Belgium). All statistical tests were two-tailed with significance set at P < 0.05.
Results
Technical validation
The clinical data and hippocampal volumetry of the 135 individuals from the EADC-ADNI project are summarized in Table 1. Automated hippocampal volumetry using AccuBrain™ and FreeSurfer were successful for all MRI data of this cohort.
Clinical profiles and hippocampal volumetry results of the 135 individuals in the EADC-ADNI cohort for technical validation.

Significantly different with MCI in post-hoc analysis.
Significantly different with AD in post-hoc analysis.
Significantly different with NC in post-hoc analysis.
NC, normal control; MCI, mild cognitive impairment; AD, Alzheimer’s disease; MMSE, Mini-Mental State Examination.
AccuBrain™
In terms of volume overlap, DSC between AccuBrain™ and manual segmentation volumes are summarized in Table 2, with P values for subgroup analyses. DSCs were comparably high between right and left hippocampus and were not different when using total hippocampus measures. AccuBrain™ performance was also high among clinical cohorts, magnetic field strengths, and MRI vendors, with a lowest mean DSC of 0.88 for the AD group and highest mean DSC of 0.91 for the NC group. At the individual level, the lowest and highest DSCs were 0.73 and 0.94 (Fig. 2), respectively, with a median value of 0.90. With the exception of a single case with total hippocampus DSC of 0.73, all other cases showed total hippocampus DSC of 0.81 and above (Fig. 3). DSC showed moderate correlation with manual volumes (r = 0.54, P < 0.001), i.e. AccuBrain™ performance was better with higher HV.
Mean DSC (SD) of AccuBrain™ and FreeSurfer with manual segmentation as reference method.

Significantly different between MCI and AD in post-hoc analysis.
Significantly different between NC vs. MCI in post-hoc analysis.
Significantly different between NC vs AD in post-hoc analysis.
DSC, Dice similarity coefficient; NC, normal control; MCI, mild cognitive impairment; AD, Alzheimer’s disease.

Sample hippocampal segmentation results of AccuBrain™ (a, e) and FreeSurfer (b, f) compared with the respective ground truths (c, g), together with original MRI slices (d, h). (a–d) Superior hippocampal segmentations (DSC of 0.94 [AccuBrain™] and 0.77 [FreeSurfer]); (e–f) inferior hippocampal segmentations (DSC of 0.73 [AccuBrain™] and 0.57 [FreeSurfer]).
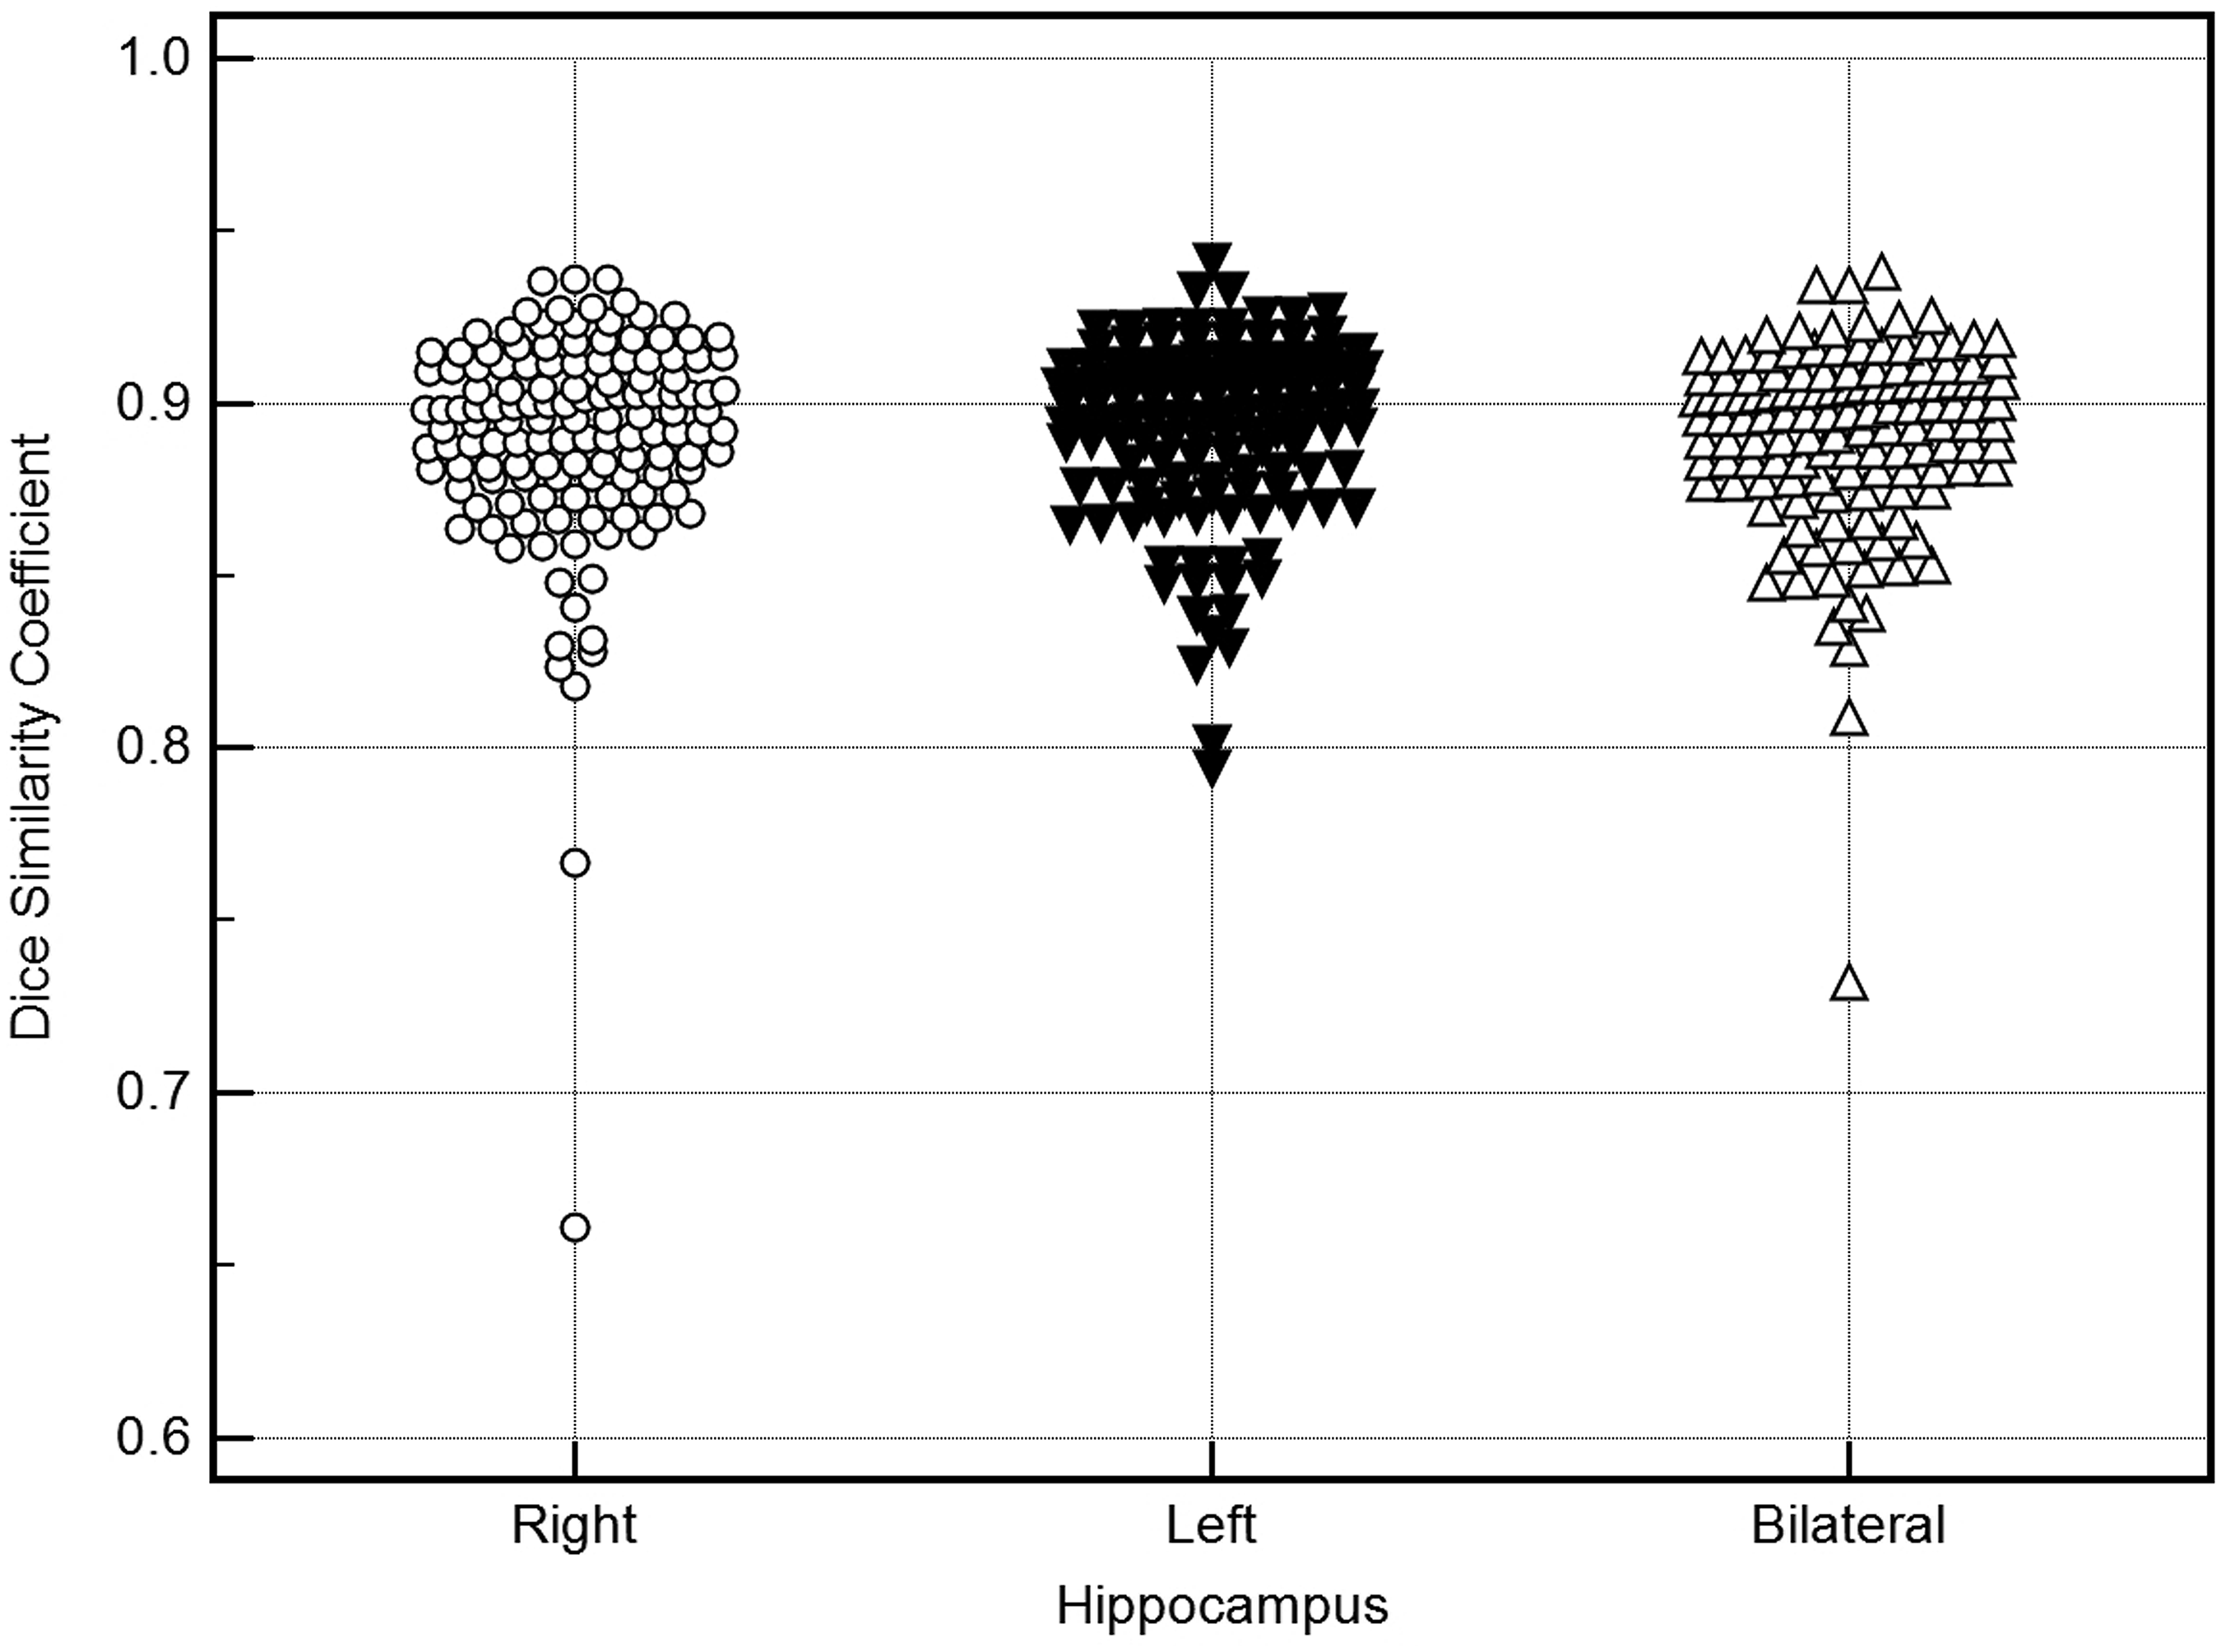
DSCs between AccuBrain segmentations and manual segmentations in right, left, and bilateral hippocampi.
In terms of numeric precision, AccuBrain™ volumes were strongly correlated with manual segmentation volumes, with ICC of 0.94 (95% CI = 0.92–0.96, P < 0.001), 0.96 (95% CI = 0.94–0.97, P < 0.001), and 0.95 (95% CI = 0.93–0.96, P < 0.001) for the right, left, and bilateral HV, respectively. Corresponding Pearson’s r values for these areas were 0.95 (95% CI = 0.93–0.96), 0.96 (95% CI = 0.94–0.97), and 0.96 (95% CI = 0.94–0.97) (P < 0.001).
Bland–Altman plot of absolute differences between AccuBrain™ and manual segmentation volumes, using manual segmentation volume as reference standard, shows general slight volume overestimation by AccuBrain™ (means of +0.24 and +0.24 mL for the right and left hippocampus, respectively). Approximately 93% of data points fell within a 1.00 mL difference in volumes (Fig. 4). Nine outliers had volume differences of 1.01–1.32 mL.

Bland–Altman plot of absolute differences in total HV between AccuBrain™ and manual segmentation. NC, normal cohort; MCI, mild cognitive impairment; AD, Alzheimer’s disease.
FreeSurfer
FreeSurfer mean DSCs were 0.75 (SD = 0.03), 0.74 (SD = 0.04), and 0.75 (SD = 0.03) for right, left, and total HV, respectively. Similar DSCs of < 0.80 were obtained in the different subgroups (Table 1). The highest DSC was 0.77 (SD = 0.03) in NC and lowest DSC was 0.73 (SD = 0.03) in AD patients. Whereas, ICC was 0.87 (95% CI = 0.83–0.91), 0.85 (95% CI = 0.79–0.89), and 0.88 (95% CI = 0.83–0.91) while Pearson’s r were 0.90 (95% CI = 0.86–0.92), 0.87 (95% CI = 0.83–0.91), and 0.90 (95% CI = 0.86–0.93) (P < 0.001) for the right, left, and bilateral HV, respectively.
Clinical validation of AccuBrain™
Of the 300 participants selected for the independent cohort, one AD patient was excluded because of change in baseline diagnosis to MCI. Thus, 299 volumetric T1W MRI scans of 149 AD and 150 NC were obtained. All were successfully run on AccuBrain™. Their clinical profiles and volumetry results are summarized in Table 3.
Clinical profiles and hippocampal volumetry results of the 299 participants in the ADNI independent cohort for clinical validation.

NC, normal control; AD, Alzheimer’s disease; MMSE, Mini-Mental State Examination; HV, total hippocampal volume; HF, hippocampal fraction.
The AUC of HV and HF for differentiating AD and NC were 0.76 (95% CI = 0.71–0.81) and 0.80 (95% CI = 0.76–0.85), respectively, which are significantly different (P = 0.033). An 80% sensitivity was afforded by using an HV threshold of ≤5.71 mL and an HF threshold of ≤0.38%.
HV AUC between individuals aged ≤75 years and >75 years and between men and women were not significantly different (P = 0.301). HF AUC was also not significantly different between the two age groups (P = 0.190) but was higher in men than women (P = 0.014). The various HV and HF thresholds allowing 80% sensitivity in these groups are summarized in Table 4.
Summary of diagnostic accuracy measures of AccuBrain™ HV and HF for differentiating AD from NC.

AD, Alzheimer’s disease; NC, normal control; AUC, area under the curve; CI, confidence interval.
Discussion
The hippocampus is a vulnerable structure in the AD neuropathologic process, and its atrophy and rate of atrophy are well-recognized diagnostic and predictive markers in dementia studies. MRI-based hippocampal volumetry has been recommended by the U.S. National Institute on Aging-Alzheimer’s Association, the International Working Group, and the European Medicines Agency as a complementary tool for subject enrichment in pre-clinical dementia trials (9–11). As the volumetric acquisition of brain MRI can be readily performed on commonly available 1.5-T and 3-T clinical scanners, the quantification of HV is gaining ground in the clinical setting, with the automated method paving the way towards its translation into routine patient care. However, for widespread adoption, automated hippocampal segmentation will require standardization with an internationally accepted reference to reduce variability across laboratories (12).
In this paper, we report the technical and clinical validation of AccuBrain™ automated hippocampal segmentation using the complete (135 individuals) reference standard dataset provided by the EADC-ADNI HarP study. Our results showed that AccuBrain™ had high accuracy and reliability for segmenting the hippocampi of NC to patients with AD, reflecting a good range of HV. AccuBrain™ achieved mean DSC of 0.89, ICC of 0.95, and Pearson’s r of 0.96. In comparison, hippocampal segmentation with the widely used research tool FreeSurfer yielded mean DSC, ICC, and r of 0.75, 0.88, and 0.90, respectively. While currently no minimum technical performance metrics have been set for automated hippocampal volumetry, the significantly long processing time of FreeSurfer (8–10 hrs vs. 25 min for AccuBrain™) makes it impractical for clinical use.
The complete EADC-ADNI HarP reference standard dataset of 135 paired hippocampal labels has only been available in the last few years, and few automated methods have been validated against it. Neuroreader, a commercial software which received U.S. Food and Drug Authority clearance, was reported to have a mean DSC of 0.87 (95% CI = 0.78–0.91) based on 99 paired EADC-ADNI hippocampal labels (13). In a brief published abstract, the LEAP automated technique was reported to have a mean DSC of 0.88 and ICC of 0.93 on 100 paired EADC-ADNI hippocampal labels (14). Finally, statistical parametric mapping (SPM8) in the VBM toolbox yielded Pearson’s correlation of 0.90 with 135 paired EADC-ADNI hippocampal labels in MNI space (15).
With AccuBrain™, excepting the lowest total hippocampus DSC of 0.73, the DSC of all other cases were high and fell in the range of 0.81–0.94. The case with low DSC occurred in an 86-year-old AD patient with Mini-Mental State Examination score of 21 and markedly atrophic hippocampi (right = 1.05 mL, left = 1.43 mL with DSC of 0.66 and 0.79, respectively). Structural MRI showed that the choroid plexuses within the temporal horns were included in the AccuBrain™ segmentation mask owing to their very close proximity to the diminutive hippocampal heads and bodies. Decreased accuracy in the presence of severe hippocampal atrophy is a known phenomenon in automated volumetry procedures (15). Despite AccuBrain™ tendency for overestimation, interpretation of such cases may not change. In addition, the vast majority of cases were still within a 1.00 mL difference with manual volumes.
In clinical validation, AccuBrain™ hippocampal volumetry showed good diagnostic accuracy. HF appears to be the better metric over HV and, additionally, its accuracy may be better in men. HV and HF cut-off values may vary based on age and gender although the differences are quite small. Of the few aforementioned automated hippocampal volumetry methods standardized to HarP, SPM8 was reported to have AUC of 0.88 (right hippocampus) and 0.90 (left hippocampus) for 45 AD and 44 NC, which are small clinical cohorts (15). FreeSurfer’s AUC was reported as 0.87 in 135 AD patients and 178 NC in leave-one-out cross-validation experiments, despite segmentation accuracy of DSC 0.77 (16) which was similar to our reported FreeSurfer results. Meanwhile, Neuroreader AUC has only been reported in MCI converters to AD, which was at 0.68 (17). Expectedly, hippocampal volumetry alone is a limited diagnostic tool; a combination with other regional volume measurements and multimodal MRI information could fine-tune the diagnostic algorithm (18).
Interestingly, the AccuBrain™ volume threshold derived in our study (5.7cm3) is not far from the cut-off of 5.3cm3 that was derived from a larger cohort in the DESCRIPA (Development of Screening Guidelines and Clinical Criteria for Predementia AD) study, which utilized the LEAP automated technique (19). Using the DESCRIPA threshold in our independent cohort would yield a lower sensitivity (70%) but higher specificity (73%) for AD. We additionally reported an HF threshold, an index that removes gender variations (20) which might serve as a more sensitive measure for AD detection. Finally, it remains to be seen if percentile ranking in a normative database could provide better risk stratification in clinical practice. We intend to evaluate the performance of these various measures in local and national cohorts and test the utility and impact of this information in regional practice in cases of suspected AD and in the work-up of MCI. The clinical utility of hippocampal volumetry in other dementia types will also need to be explored further.
In summary, our findings suggest that AccuBrain™ is an acceptable replacement for manual segmentation and has potential clinical value in assisting AD diagnosis. AccuBrain™ is easy and efficient to use; it is a completely automated image analysis tool that only requires uploading of MRI data by the user and allows batch processing of several scans in a single upload. Of equal importance, AccuBrain™ segmentation is also robust, with consistently high accuracy across clinical cohorts (reflecting different hippocampal volumes), MRI magnetic field strengths, and different commercial scanners, making it a reliable method for assessment of MRI data from multiple centers. While minimum technical performance metrics have not been set, validation of AccuBrain™ showed excellent numeric precision (ICC = 0.95, Pearson’s r = 0.96) while the more stringent index to assess volume overlap (DSC = 0.89) is the highest yet reported when using the EADC-ADNI reference standard dataset. Our efforts are in line with standardization of automated hippocampal volumetry as a necessary step for clinical translation of the method.
In conclusion, AccuBrain™ provides a reliable and robust automated tool for hippocampal segmentation and shows coherence with EADC-ADNI protocol. It shows great potential clinical value in assisting AD diagnosis. The technical and clinical validation of AccuBrain™ reported herein sets the stage for translation of the technique into our clinical practice.
Footnotes
Acknowledgments
Data used in preparation of this article were obtained from the Alzheimer’s Disease Neuroimaging Initiative (ADNI) database (adni.loni.usc.edu). As such, the investigators within the ADNI contributed to the design and implementation of ADNI and/or provided data but did not participate in analysis or writing of this report. A complete listing of ADNI investigators can be found at:  .
.
Declaration of Conflicting Interests
The author(s) declared the following potential conflicts of interest with respect to the research, authorship, and/or publication of this article: Lin Shi is the director of BrainNow Medical Technology Limited. Yishan Luo is an employee of BrainNow Medical Technology Limited.
Funding
The author(s) received no financial support for the research, authorship, and/or publication of this article.