
Abstract
Background
Glioma is the most common neoplasm that is neuroepithelial in nature. However, Spectral computed tomography (CT) has rarely been reported to detect angiogenesis in tumors.
Purpose
To investigate the value of multi-parameter spectral CT for the detection of angiogenesis in C6 glioma in rats.
Material and Methods
Fifteen male Wistar rats were seeded with C6 glioma cells in the right basal ganglia and spectral CT-enhanced scanning was performed at days 7, 10, and 14 after the C6 glioma cells were seeded. The spectral CT parameters were measured in three areas: the solid tumor; the peritumoral area; and the contralateral mirror area. After different periods of scanning, the rats’ brain tissue was stained with HE and CD105 immunohistochemical staining. Different periods of spectral CT quantitative parameters and pathological images were analyzed.
Results
The spectral CT parameter and CD105 among the solid tumor, peritumoral area, and contralateral mirror area were significantly different: monochromatic CT value (211.30 ± 34.67 HU, 119.16 ± 13.31 HU, and 55.59 ± 7.87 HU, P < 0.001); CD105 (16.14 ± 1.91, 6.79 ± 1.31, and 2.50 ± 0.51, P < 0.001); spectral curve slope (10.35 ± 1.89, 5.33 ± 0.87, 0.88 ± 0.26, P < 0.001); iodine (water) value (49.75 ± 9.02, 26.04 ± 4.32, 4.36 ± 1.18, P < 0.001). CD105 correlated strongly with the CT value at 65 keV (correlation coefficient r = 0.98, P < 0.001).
Conclusion
Multi-parameter spectral CT can reflect the formation of tumor angiogenesis in rat C6 glioma to a certain extent and can be used as an effective means to evaluate glioma.
Keywords
Introduction
The formation of neovascularization provides sufficient “nourishment” for the subsequent development of the tumor. Many studies have found that malignant proliferation, invasion, and recurrence of tumors are closely related to tumor angiogenesis, where a higher tumor grade is associated with more abundant neovascularization. Folkman et al. proposed a theory in 1971 that the growth of the tumor depends on the proliferation of blood vessels (1). Therefore, angiogenesis has become a potential therapeutic target in anticancer therapy (2). Accurate evaluation of the angiogenesis of glioma vessels is of great significance for the diagnosis, treatment, and the prediction of therapeutic effects (3). CD105 (endoglin) is highly sensitive to vascular endothelial cells in the proliferating state but not to mature vascular endothelial cells. Duff et al. (4) suggests that MVD CD105, which marks tumor tissue, is superior to other markers, while Behrem et al. (5) suggests that use of CD105 as an immature tumor marker may be better than other vascular endothelial markers in predicting the prognosis and effect of the treatment of the tumor.
Currently, imaging studies of tumor vessels have mainly focused on perfusion imaging. Computed tomography (CT) perfusion parameters have been used to evaluate the angiogenesis of glioma. The advantages of a powerful post-processing system and multi-parameter imaging developed on spectral CT in recent years have been shown in the qualitative diagnosis and differential diagnosis of systemic disease. Spectral CT enables the reconstruction of monochromatic images with energies in the range of 40–140 keV. The multi-parameter mode of CT imaging (spectral curve, material-decomposition images, monochromatic image, and effective atomic number image) has been realized. The monochromatic images have been used to determine the CT value of a substance under a specific monochrome. The variation of the monochromatic images can reflect the difference in the X-ray attenuation of the tissue at a given monochromatic energy (6). It is commonly used to identify the homology of the lesion, such as the determination of cancer lymph nodes. Therefore, this experiment determines the microscopic difference (CD105) of the tissue by the monochromatic images. The slope of the spectral curve is the shape of the CT value under continuous single energy, and the similarity of tissue components can be judged. A substance separation image, based on the values at any monochrome of two known materials (water and iodine), could detect the types and contents of substance components in tissues. It is commonly used in the differential diagnosis of lesions and the detection of components in lesions, such as detection of renal angiomyolipoma. They find that both the slope of the spectral curve and iodine concentration from renal lesions demonstrated the potential in differentiating renal cell carcinoma and minimal fat renal angiomyolipoma. The cortical phase is better than the corticomedullary phase (7). Determination of inorganic components in tissue can be performed by effective atomic number imaging and detection of urinary calculi: use of third-generation dual-source CT at the energy combination of 100 and 150 kV Sn improved classification of urinary stones across a wide range of phantom sizes and increased the ability to differentiate from stones (8). Most studies have shown that spectral CT can accurately distinguish and quantify the specific components in the mixture, reflecting the blood supply of tissue damage (9–12).
We hypothesized that monochromatic CT value, spectral curve slope, and iodine (water) value will be different in tumors and in the normal brain and that it would correlate to CD105 vascular staining. This experiment therefore is based on the advantage of multi-parameter spectral CT imaging using the rat C6 glioma model, while comparing the relationship between spectral CT quantitative parameters and glioma CD105-MVD to investigate whether the spectral CT quantitative parameters could respond to immature vascular quantity of glioma. Evaluation of spectral CT quantitative parameters in the investigation of glioma cell angiogenesis was performed. Here, we provide a new method for the accurate detection of malignant gliomas.
Material and Methods
Culture of C6 glioma cells
The study protocol was approved by the Ethics Committees of the Lanzhou University Second Hospital, Lanzhou, PR China (2016‑D40).
C6 glioma cells were purchased from the Cell Bank of the Shanghai Institute of Life Sciences, Chinese Academy of Sciences, Shanghai, PR China, and cultured in Dulbecco’s modified eagle medium (DMEM; Gibco BRL, Grand Island, NY, USA), supplemented with 10% fetal bovine serum (FBS; HyClone, Logan, UT, USA) 100 U/mL penicillin and 100 μg/mL streptomycin (HyClone) at 37°C with 5% CO2.
Rat model of glioblastoma
Ten‑week‑old male Wistar rats (n = 15), weighing 280–300 g, were maintained in a standardized specific pathogen‑free animal facility. Each rat was anesthetized by intraperitoneal injection of 10% chloral hydrate (4 mL/kg) and fixed in a prone position on a murine stereotactic device. A 1‑cm vertical incision was made at the lower right position along the sagittal direction, from the middle of the horizontal line between the eyes. A 0.6‑mm‑diameter drill was used to open the skull 1 mm above and 4 mm to the right of the bregma. A suspension of C6 cells (10 μL, 1.0 × 10⁵ cells/μL) at the logarithmic growth phase was injected slowly (over a 5‑min period) into the brain. The needle was slowly removed 5 min after the injection had finished. The incision was then sutured and sterilized. Subsequently, the rat was maintained as normal. C6 gliomas were observed to grow rapidly and reach a size of 2–4 mm at 12 days. Without intervention, rats bearing C6 gliomas usually die after 3–4 weeks; therefore, we chose to perform final CT scanning on day 14 after tumor cell injection.
CT scanning
On day 7 after seeding of C6 cells, each rat was anesthetized with an intraperitoneal injection of 10% chloral hydrate (4 mL/kg) and fixed in a prone position. All rats were then scanned and 14 tumors were determined; no tumor growth was found in the right basal ganglia of one rat during the three scanning processes (based on contrast-enhanced spectral CT imaging) and this animal was thus excluded from further analysis. After the scan was completed, five randomly selected rats were sacrificed. On the 10th day, another five randomly selected rats were scanned and sacrificed. On the 14th day, the remaining four rats were scanned and sacrificed. A disposable intravenous infusion needle (0.45 × 13.5 RWLB; Weigao Medical Polymer Co., Ltd., Weihai, PR China) was placed in the tail vein. Local CT scanning (HD750 CT scanner; GE Healthcare, Little Chalfont, UK) was performed first, followed by spectral CT scanning with a bolus injection of iohexol contrast agent (2.5 mL/kg, injected at 0.2 mL/s; Yangtze River Pharmaceutical Group, Taizhou, PR China). Scanning was performed in the axial mode, using the following parameters: gantry rotation time = 0.5 s; tube voltage = 80/140 kVp; fast switching; tube current = 630 mAs; pitch = 1.375:1; detector coverage = 20 mm; scan field of view (SFOV) = small head; display field of view (DFOV) = 9 cm; reconstruction type = standard; matrix size = 512; adaptive statistical iterative reconstruction (ASIR) = 30%; thickness = 0.625 mm; and time delay = 30 s.
Analysis of spectral CT data
Three‑dimensional (3D) multiplanar reconstruction (MPR) images were generated using GSI general post‑processing software running on an AW4.6 workstation (GE Healthcare). The optimal contrast-to-noise ratio (CNR) was achieved at 65 keV in 12 of the 14 tumor‑bearing rats. In the remaining two rats, the optimal CNR was achieved at 60 keV and 70 keV, although good tissue contrast was also obtained at 65 keV in both these animals. Therefore, 65 keV was selected for monoenergetic imaging, 3D reconstruction, and measurement of CT values (Fig. 1). The maximal tumor length (including both the tumor and surrounding regions of suspected invasion) was measured perpendicular to the middle sagittal line and the distance from the layer containing the maximal tumor length to the front of the brain was also determined. In the image layer (0.625 mm thick) containing the maximal tumor length, circular regions of interest (ROIs; diameter = 0.5 mm) were positioned at the following regions: the center of the solid tumor; a peripheral tumor region (note: the edge of the tumor is within 2.5 mm and avoids the liquefied necrotic area); and contralateral normal brain tissue (Fig. 2). Every region had three ROIs and the average values were calculated for these regions. Two specialists experienced in the analysis of spectral CT data recorded the tumor diameters, distances from the ROIs in the peritumoral area to the tumor center, CT values, and iodine concentrations in a blinded fashion.
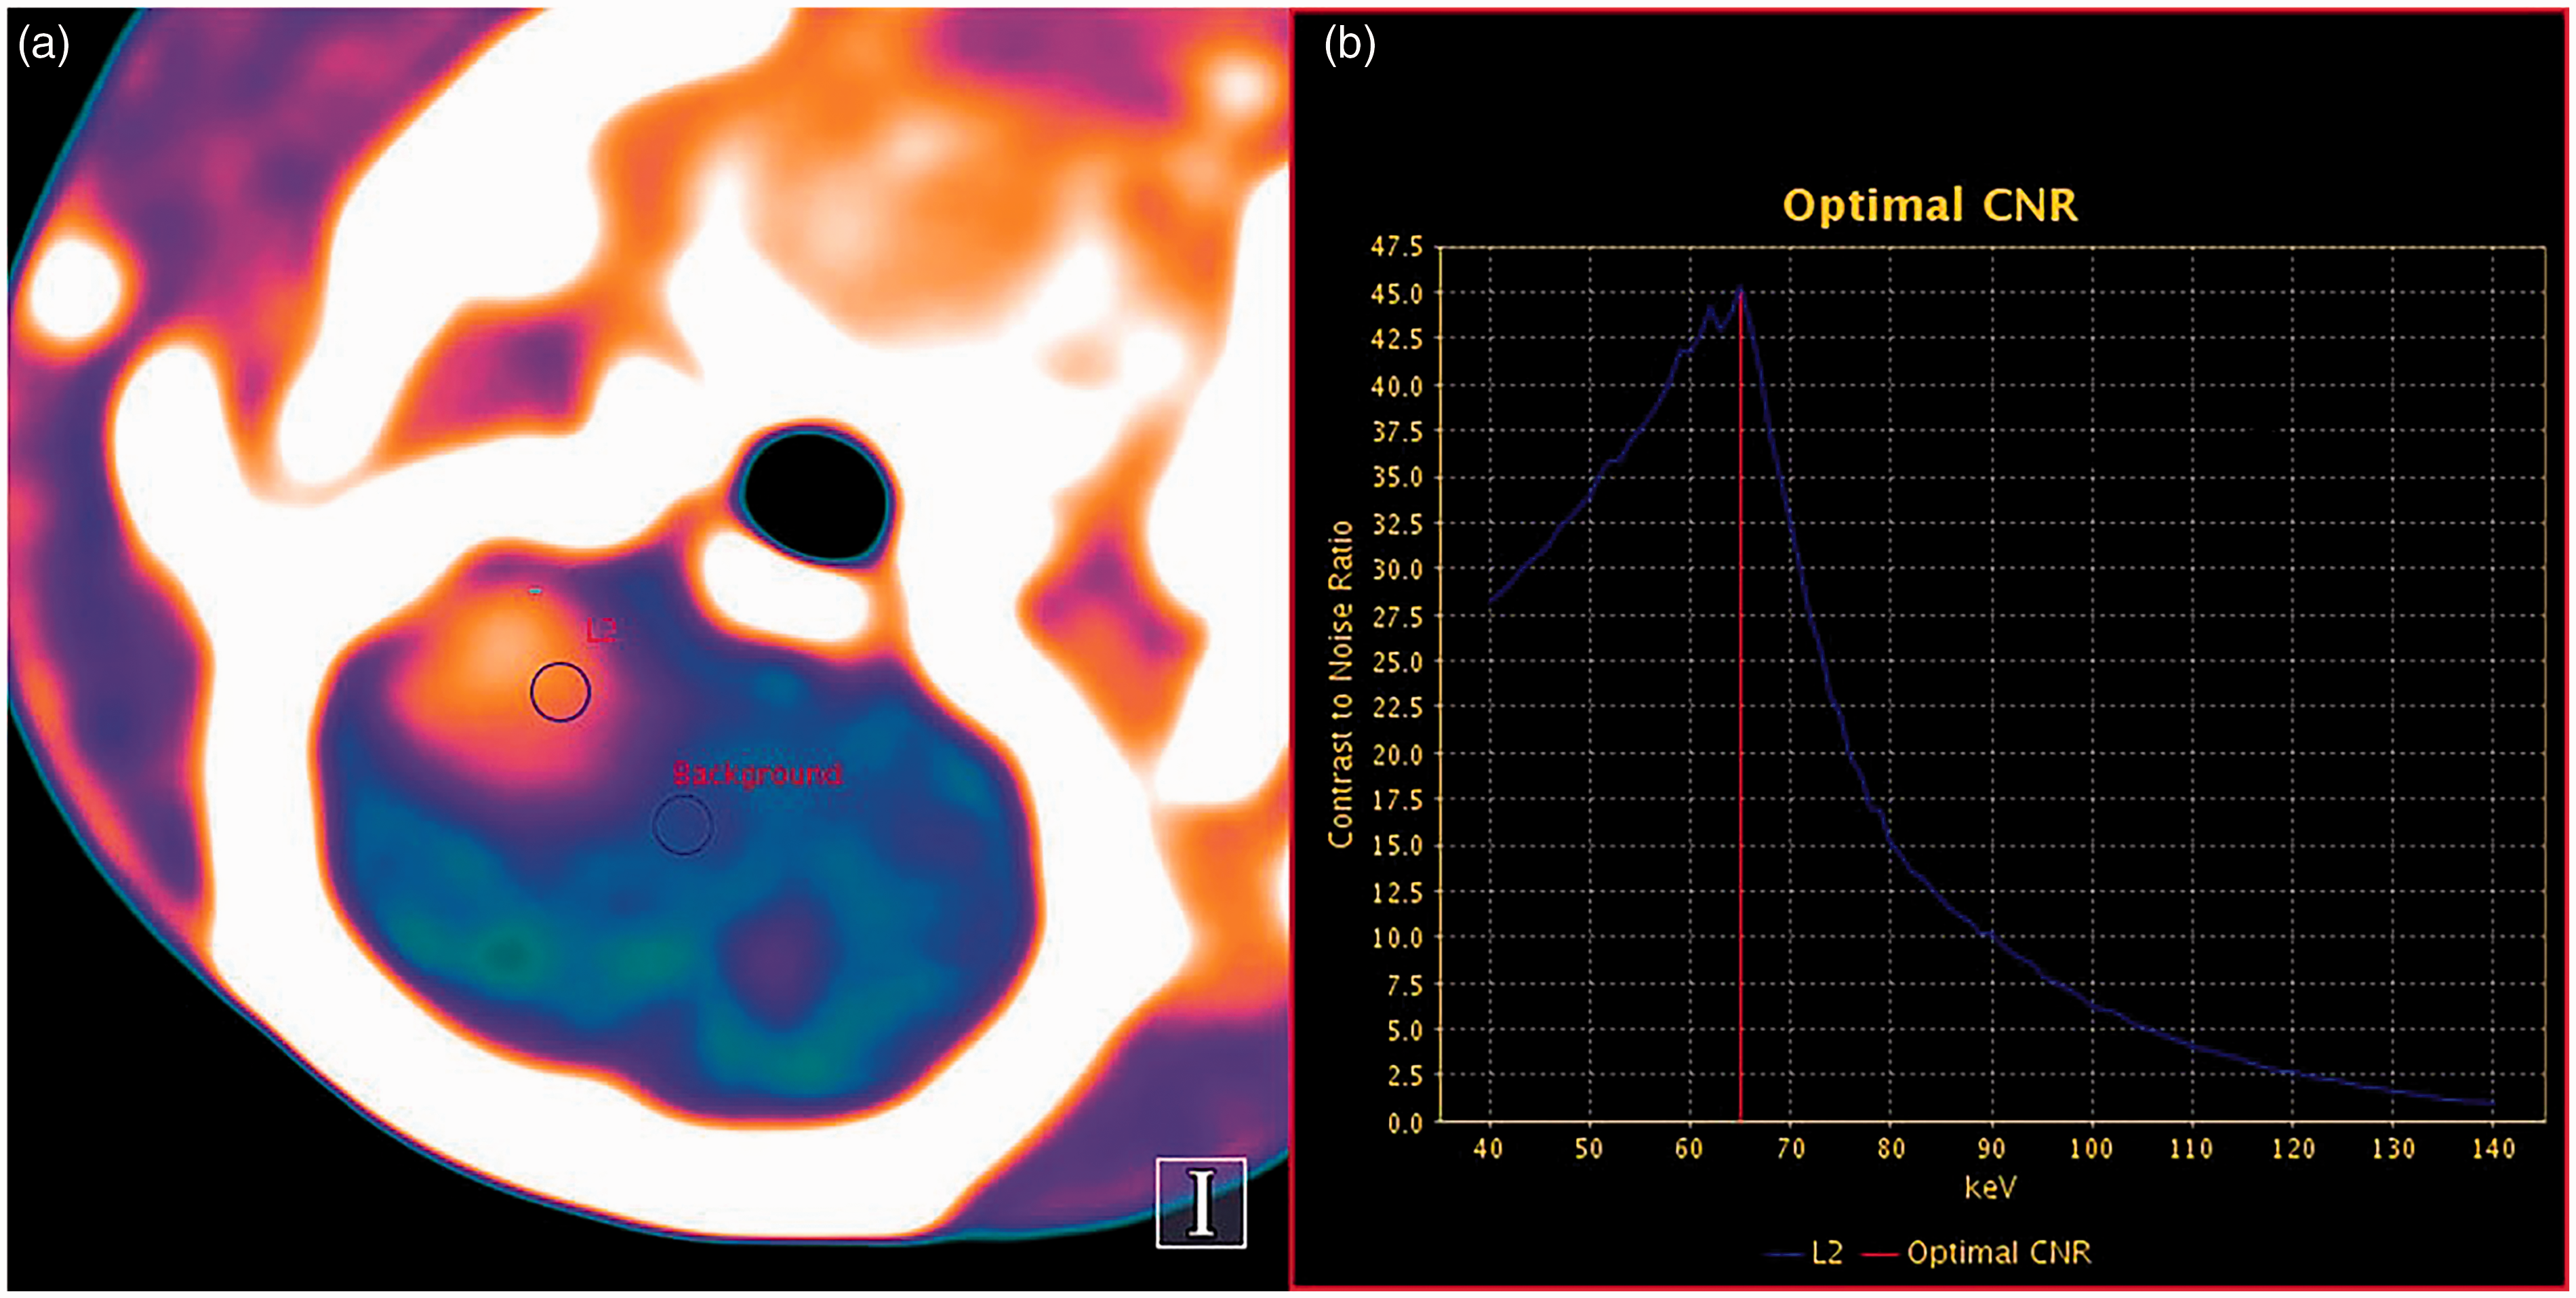
Selection of the best CNR for displaying the glioma in spectral CT images. (a) Sagittal monoenergetic pseudo‑color images showing the sizes and positions (i.e. tumor, labeled “22,” and adjacent brain tissue, labeled “Background”) of the ROIs used to determine the optimal CNR curve. (b) The optimal CNR curve. The best resolution between the tumor and adjacent brain tissues was achieved at a monochromatic energy of 65 keV.
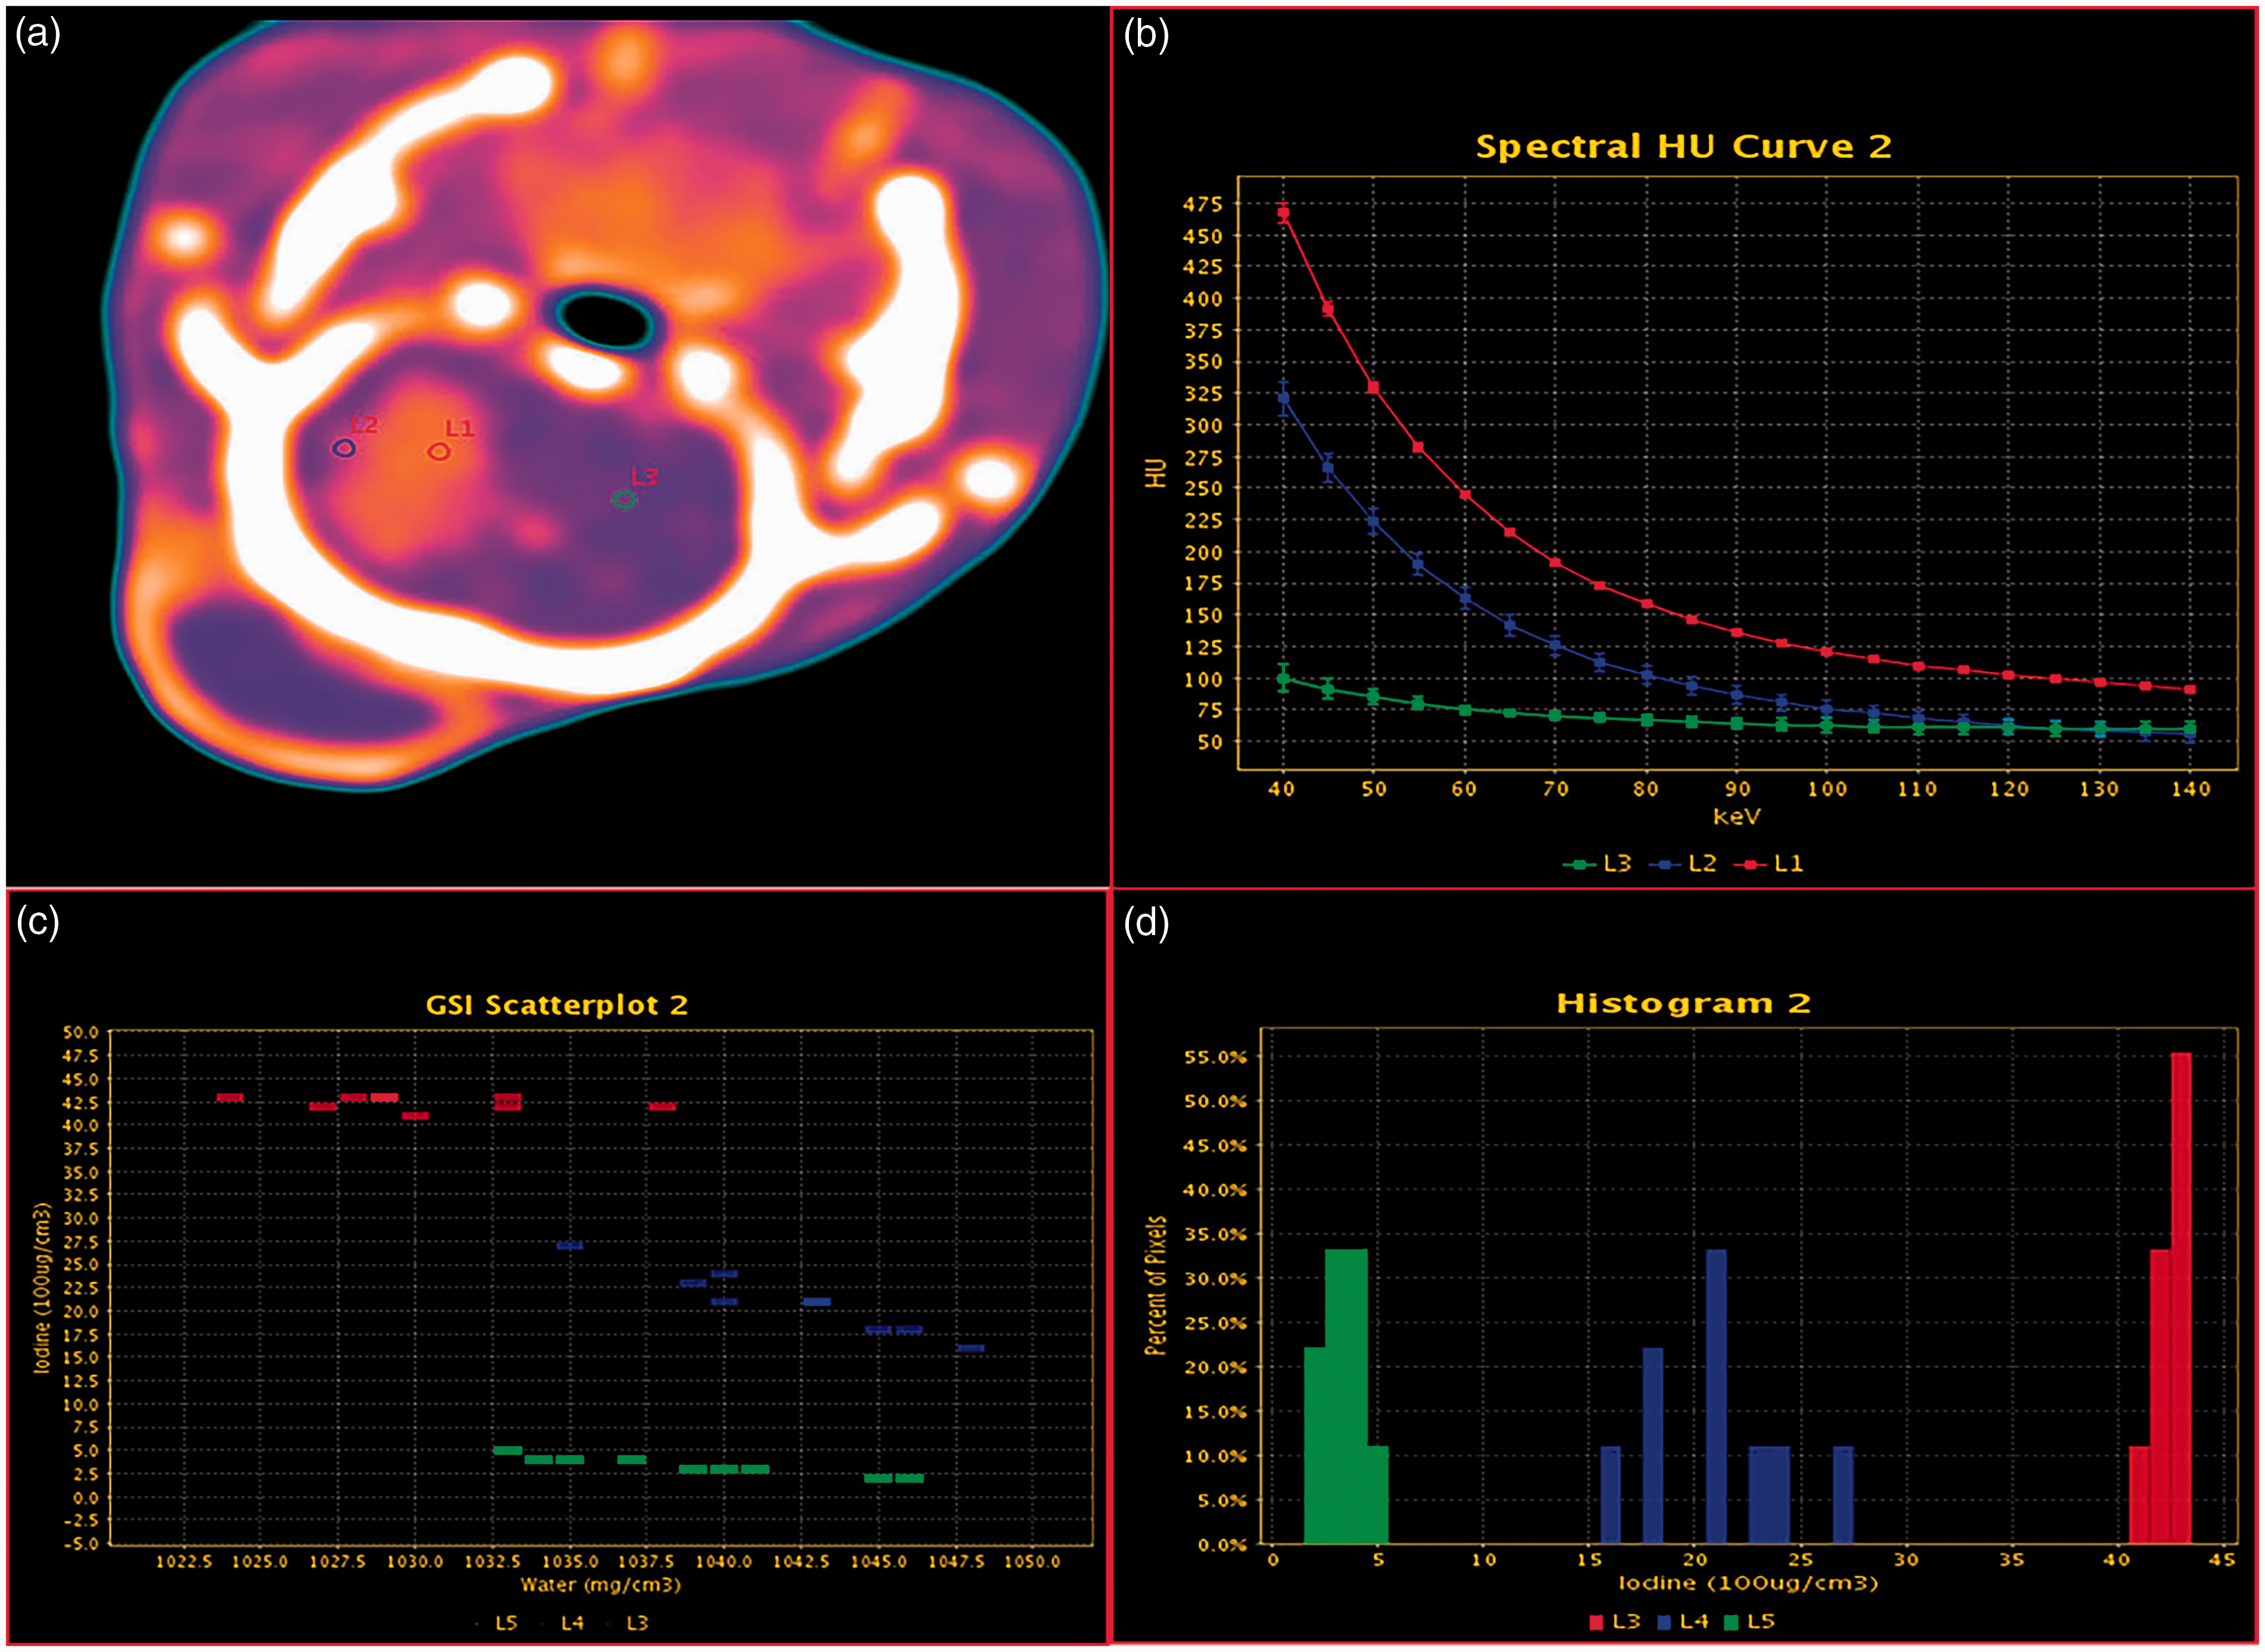
Enhanced spectral CT scanning of a rat C6 glioma with a diameter > 3.0 mm. (a) Representative axial monoenergetic pseudo color image at 65 keV. The solid tumor showed strong enhancement (black arrow), while the degree of enhancement decreased progressively from the central to the peritumoral regions. (b) There were clear differences between the standardized curves for the solid tumor (red), surrounding area of infiltration (blue), and normal rain tissue (green). (c) Scatter plot of the iodine water material decomposition. The differences between the iodine and water concentrations facilitated the distinction between the tumor center (red), peritumoral region (blue), and normal rain (green). (d) Histogram of the iodine concentration at different regions. There were clear differences in the iodine concentration between the tumor center (red), peritumoral region (blue), and contralateral brain tissue (green).
Histopathological analysis of tumor samples
After the completion of CT scanning, each rat was deeply anesthetized, fixed on a homemade surgical board, and placed on a dissection plate. The chest was opened, the abdominal aorta was clamped, and the heart was exposed and isolated. A perfusion needle was inserted into the left ventricular chamber and fixed in place using small‑animal‑specific forceps, and an incision was made in the right atrial appendage. The rat was first perfused with sterile saline (100 mL, 4°C) until the blood had been cleared (i.e. both lungs had turned white in color and the perfusate emerging from the right atrial appendage had become clear). Then, perfusion was continued with 4% paraformaldehyde (PFA; 100 mL, 4°C). The brain was collected by decapitation and fixed in PFA for 24 h.
Following fixation, the tumor section corresponding to the spectral CT layer was collected (tumor maximum diameter). The sample was dehydrated, embedded in paraffin, sectioned at 3–4 μm, and either stained with hematoxylin and eosin (H&E) (observe the difference in tissue morphology) or immunostained for CD105 using an anti-CD105 primary antibody and an EnVision system, in accordance with the manufacturer’s instructions (Dako, Agilent Technologies, Santa Clara, CA, USA). The samples were developed using 3,3‑diaminobenzidine (DAB) and re‑stained with H&E.
Two pathologists independently analyzed the pathological sections in a blinded manner. The tumor length was measured and the percentage of CD105-MVD in each high‑magnification field was calculated for regions corresponding to the ROIs selected in the CT scan. The tumor length included the tumor and surrounding area of infiltration (defined as the presence of a few tumor cells within normal brain tissue).
Statistical analysis
SPSS23.0 (SPSS Inc., Chicago, IL, USA) was used for the statistical analyses. The data are presented as the mean ± standard deviation (SD). The monoenergetic CT values, iodine concentration, spectral curve slope, and CD105-MVD in the various regions (the solid tumor, peritumoral area, and contralateral mirror area) were analyzed using one‑way analysis of variance (ANOVA) with a Brown–Forsythe test. The correlation between each spectral CT parameter and CD105-MVD was analyzed using Pearson correlation analysis. P < 0.05 was considered statistically significant.
Results
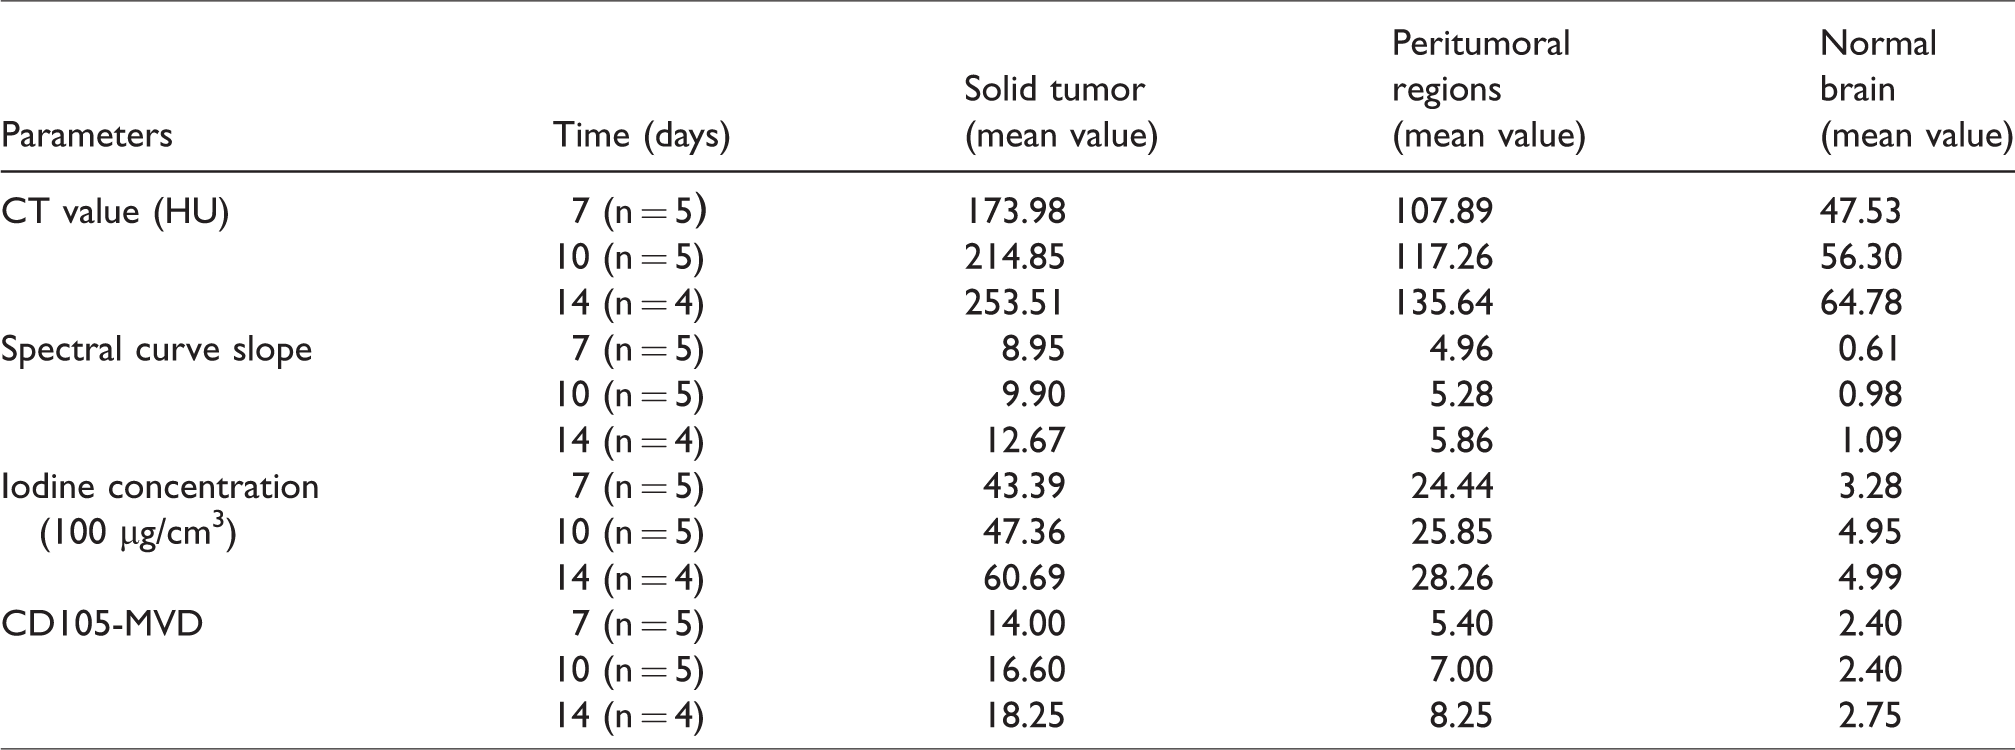
Different periods of the spectral CT parameter of solid tumor and peripheral tumor region and the CD105-MVD were increased overall (Table 1). On the seventh day, there were obvious tumor cells in the tumor and the peritumoral area, and no significant neovascularization was found. On the 10th day, a small amount of neovascularization was found in the tumor and the peripheral tumor region, and heteromorphic cells and neovascularization were not found in the normal brain tissue (Fig. 3). A large amount of neovascularization was found in the center of the tumor 14 days after seeding of C6 cells (Fig. 4). Compared with the tumor area, peripheral tumor region, and contralateral mirror area regarding the parameter spectral CT and CD105-MVD, there were significant differences in the monochromatic CT value, spectral curve slope, iodine (water) value, and CD105-MVD (P < 0.05) (Fig. 5).
The mean values of the different regions at different periods of time.

Histopathology of a rat C6 glioma: immunostained for CD105. (a) Day 7: A1–A3 = representative section of normal brain tissue, peritumoral region, and solid tumor (×200); A4 = representative iodine concentration of tumor was slightly higher than in normal brain. (b) Day 10: B1–B3 = representative section of normal brain tissue, peritumoral region, solid tumor (×200); B4 = representative iodine concentration of tumor was obviously higher than in normal brain. (c) Day 14: C1–C3 = representative section of normal brain tissue, peritumoral region, solid tumor (×200); C4 = representative iodine concentration of tumor was the highest of the three measurements. Blue arrows indicate neovascularization; yellow arrows indicate the tumor (images are representative of n = 14).
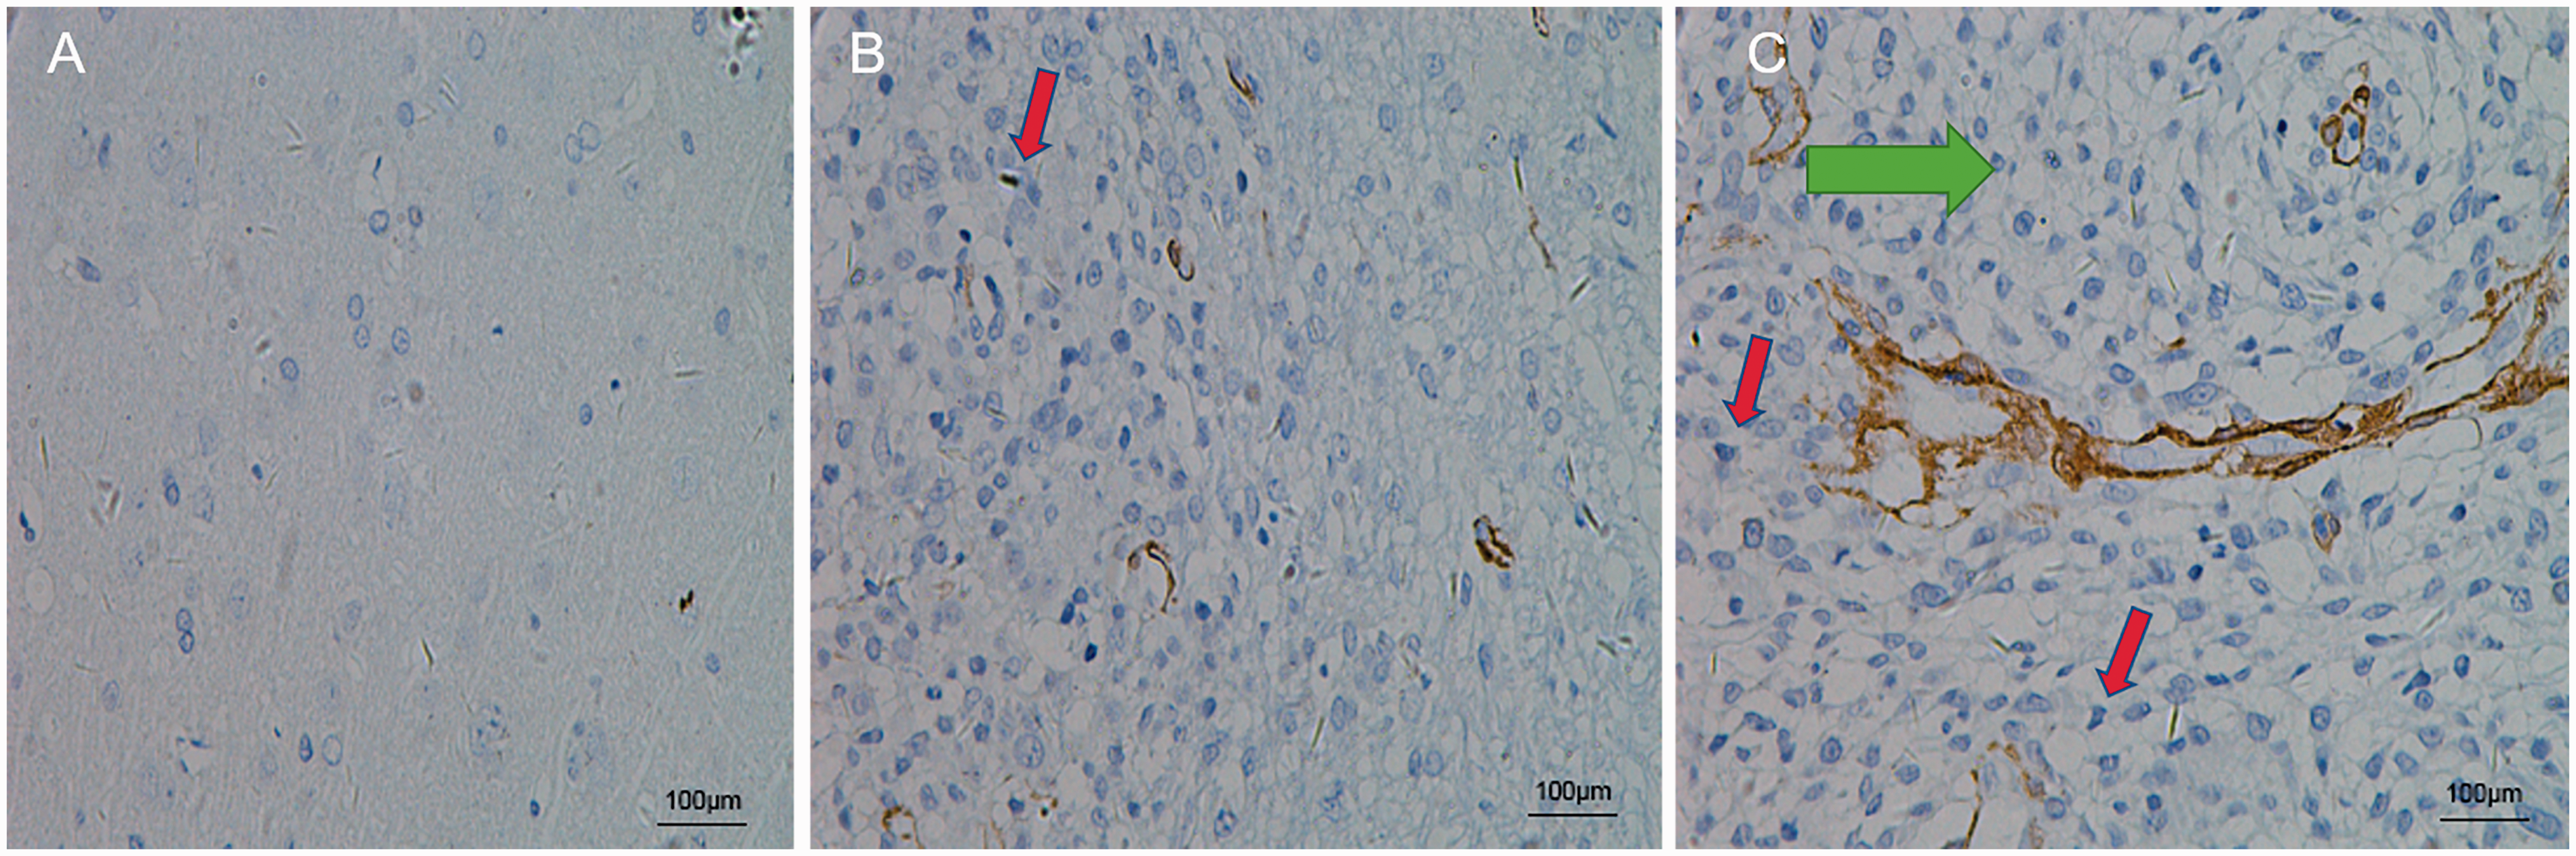
Histopathology of a rat C6 glioma: immunostained for CD105. (a–c) Representative section of normal brain tissue, peritumoral region, and solid tumor (×400). Red arrows indicate the area of tumor cells. Green arrows indicate the area of whirlpool arrangement of tumor cells.

Comparison of spectral CT parameters and CD105-MVD between normal brain tissue, peritumoral region, and solid tumor in a rat C6 malignant glioma model (mean ± standard deviation [SD]).The spectral CT parameters differences among different regions.K represents Spectral curves slope.
Correlation analysis of immunostained results and energy spectrum parameters of C6 glioma in rats
Pearson correlation analysis showed that CD105-MVD and 65 KeV monochromatic CT value, spectral curve slope, and iodine (water) value were positively correlated (r = 0.98, P < 0.01; r = 0.96, P < 0.01; r = 0.95, P < 0.01) (Fig. 6). No correlation between spectral CT parameters and CD105-MVD in normal brain tissue was found.
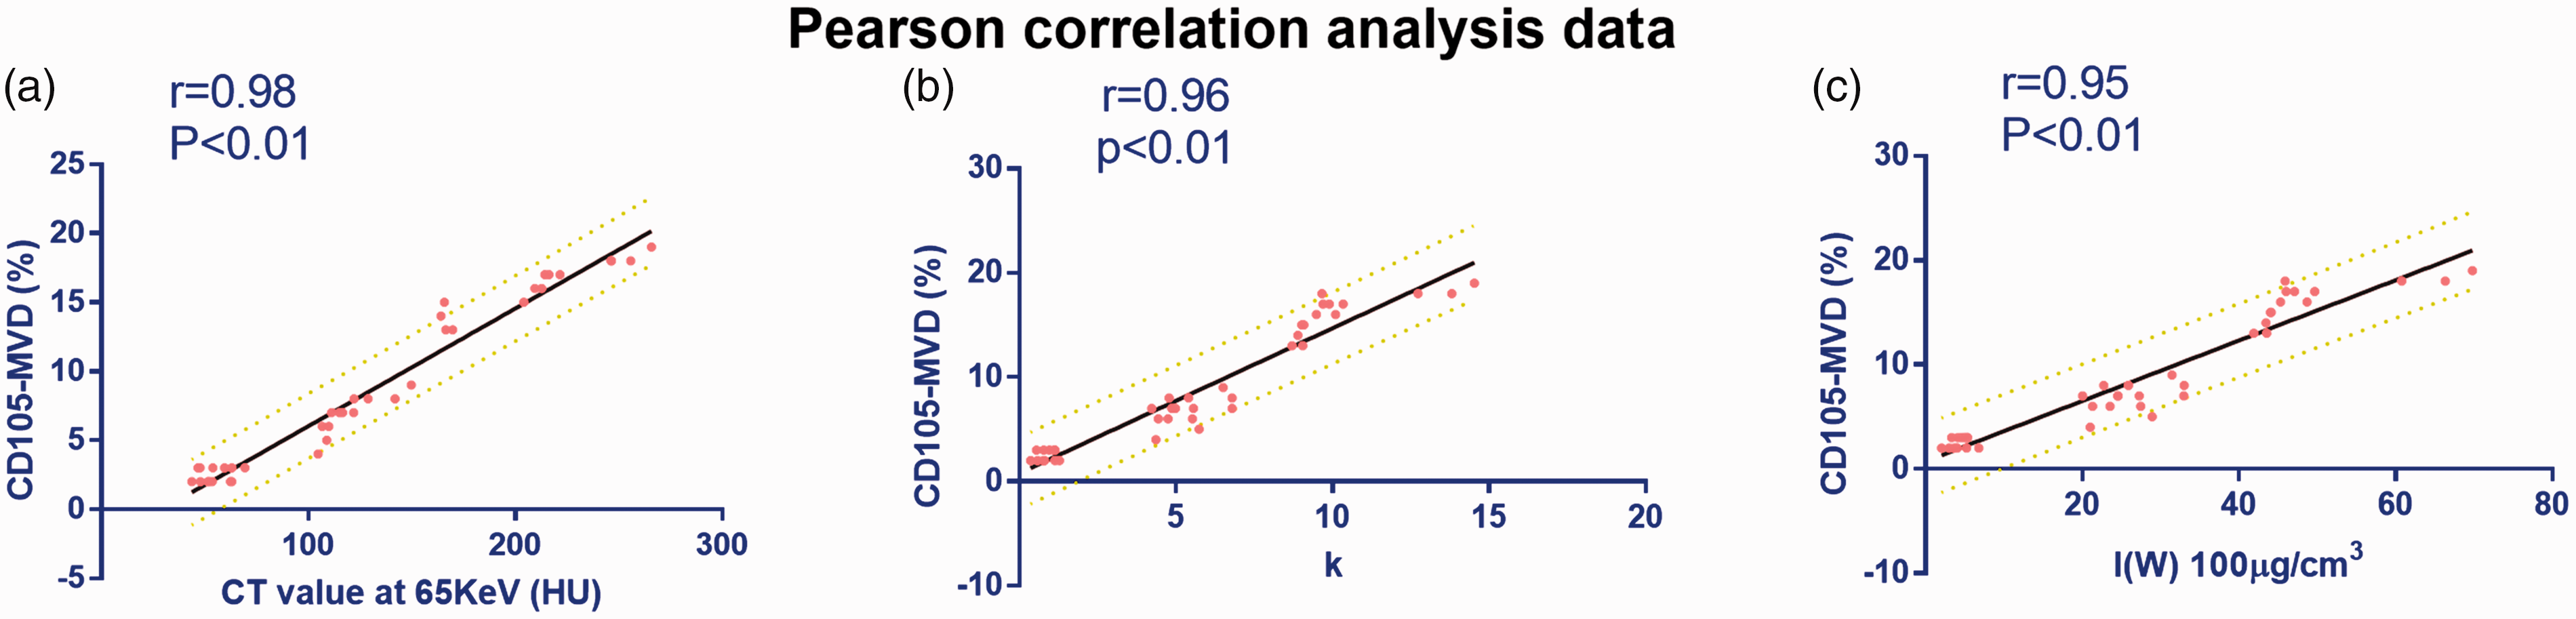
Analysis of the correlations between CD105 MVD expression and parameters measured using spectral CT. (a) Pearson correlation analysis of the association between CD105 MVD expression and the CT value at 65 keV (HU). (b) Pearson correlation analysis of the association between CD105 MVD expression and the slope of the spectral curve (K). (c) Pearson correlation analysis of the association between CD105 MVD expression and the iodine concentration.
Discussion
Glioma is the most common neoplasm that is neuroepithelial in nature and occurs in the central nervous system of adults. Epidemiological surveys show that the global incidence of cancer is approximately 30,000–80,000/100,000 (13). Genotyping was added to the new WHO classification of the central nervous system in 2016 (14), which makes accurate pathological grading as well as molecular and genotyping of glioma patients before surgery more urgent. In the treatment of glioma, conventional surgical excision plus radiotherapy can only prolong the average life span by 9–12 months (15) and does not effectively improve the prognosis of the patients. An important reason is the malignant biological behavior of gliomas, which includes the formation of neovascularization, malignant proliferation of cells, and invasive growth of the tumor. Tumor angiogenesis is a necessary condition for tumor proliferation, local recurrence, hematogenous dissemination, and distant metastasis, which are multi-factorial and dynamic process. Tumor angiogenesis is an important standard for the histological grading of glioma. Microvessel density (MVD) is currently widely used and is the gold standard for evaluating the angiogenesis of solid tumors (16,17). In recent years, CD105 has become one of the hotspots in the study of angiogenesis in glioma. Most of the studies suggest that CD105 is mainly expressed in immature vessels of the tumor area and active area of vascular proliferation, but with little or no expression in normal tissue (18–21). Three pathological analyses showed that there was no obvious neovascularization in normal brain tissue. Instead, there was a large amount of neovascularization in the tumor area and the peritumoral zone. The study by Miebach et al. showed that the CD105-MVD levels in glioma tissues increased with the pathological grading (22). C6 glioma cells are similar to human glioblastoma and their biological behavior is at least grade III. This is also confirmed by the obvious expression of CD105-MVD in the tissue of the rat glioma tissue in this study. For most solid tumors, there are fewer microvessels and ischemic necrosis in the center of the tumor occurs easily. There are more microvessels in the edge of tumor growth. Rogatsch et al. reported that the maximum microvessel density of solid tumors is 0.5–15 mm at the edge of the tumor (23). Mostly, the tumors maximum microvessel density is within 2.5 mm of the tumor margin. Therefore, the measurement range of the peritumoral area is < 2.5 mm.
As new technology has developed in recent years, spectral CT has been realized as the breakthrough of CT multi-parameters, and monochromatic CT value is one of the most commonly used quantitative parameters. The other landmark technological progress of spectral CT is material separation technology, which measures the absorption of substance X-rays by the density of two substances (water and iodine are usually used as base pairs), where this density value is independent of the energy of X-rays. In this study, it was found that the image noise of 65 KeV is low while the signal-to-noise ratio was high with good representation, which is in accordance with the results of the study by Liu et al. (24). The variance in the monochromatic CT values in the 40–65 KeV interval is more obvious, and so the correlation analysis was done with the 65 KeV single-energy CT value and the spectral curve slope in the 40–65 KeV interval. Spectral CT monochromatic value is the most direct reflection of changes in different cell-density reactions, while the variance of the spectral curve slope also reflects the difference in composition. The study found that, over time, the tumor and peritumoral region of the monochromatic CT value, along with the spectral curve slope and the iodine value, increased gradually. The molecular basis of this change may be due to tumor progression and an increasing amount of heterogeneity in the evolution process is caused as a result. In the process of tumor evolution, the composition of the tumor is constantly changing with the prolongation of the tumor growth time, and the density of the tumor cells increases with a change in “nourishment” source from the original host vessel to the formation of the tumor’s own microvasculature. During this dynamic change, it shows a change in X-ray absorption. In other words, with more time, the density of tumor cells, the number of new blood vessels, and the monochromatic CT value increases gradually. Tumor heterogeneity can exhibit different genes or other large molecular changes. In this study, we find that monochromatic CT value, spectral curve slope, and iodine (water) value were different in tumors and in normal brain and that they correlate to CD105 vascular staining. There were significant differences in the CT parameters among the three regions (the center of the solid tumor, a peripheral tumor region, and contralateral normal brain tissue). The difference is based on the different microvascular density and cell and molecular components among the three regions. There were obvious tumor cell proliferation and angiogenesis in the tumor area and peritumoral area, but there was no neovascularization in normal tissues. The correlation analysis shows that the 65 KeV monochromatic CT value and the spectral curve slope have an obvious positive correlation with CD105-MVD. This can prove that monochromatic CT value and the spectral curve slope can indirectly reflect the density of the neovascularization of the C6 glioma. C6 glioma is a tumor that has a rich blood supply. The basement membrane of the tumor neovasculature is incomplete and its vascular permeability is stronger (25). Therefore, there is an obvious iodine accumulation on CT enhancement. The pathological results showed a solid tumor and peritumoral region with prolonged time of tumor growth, along with gradual increases in both microvessel density and iodine value. Statistical results show that the iodine value and CD105-MVD showed a significant positive correlation, indicating there is dense neovascularization in the solid tumor area and the peritumoral region, while these vessels are not mature blood vessels. Thus, iodine value can evaluate the angiogenesis status of C6 glioma to a certain extent.
There are certain limitations in this study. First, the sample size was relatively small (n = 14), so there could be detection bias caused by the homogeneity of the sample. Second, no perfusion imaging was performed to compare the multimodal detection of the images.
In conclusion, the quantitative parameters of spectral CT, including 65 KeV monochromatic CT value, spectral curve slope, and iodine (water) value, can reflect angiogenesis of C6 glioma to a certain extent. Except for microvascular changes, there are complex gene and molecular changes in the process of tumor growth. Thus, it is possible to guess that spectral CT quantitative parameters may contain information of C6 glioma on the gene and molecular level. If this can be confirmed, it is possible that quantitative spectral CT parameters could provide more information about tumor heterogeneity and even the change in the tumor gene in clinical settings.
Footnotes
Declaration of Conflicting Interests
The author(s) declared no potential conflicts of interest with respect to the research, authorship, and/or publication of this article.
Funding
The author(s) disclosed receipt of the following financial support for the research, authorship, and/or publication of this article: This research was supported by the National Natural Science Foundation of China (No. 81772006).