
Abstract
Background
Although both 1.5-Tesla (T) and 3-T magnetic resonance imaging (MRI) are widely used for the diagnosis of cervical spondylotic myelopathy (CSM), there have been no comparative studies.
Purpose
This study compared the performance of both imaging modalities for diagnosing CSM among radiologists with varying experience levels.
Material and Methods
Four independent readers with different levels of experience reviewed 1.5-T and 3-T MR images of 79 patients with cervical spondylopathies. For both field strengths, images were evaluated for the depiction of intramedullary T2 hyperintensity of the cord according to disc level using a 5-point scale: –2 = definitely absent; –1 = probably absent; 0 = equivocally absent or present; 1 = probably present; and 2 = definitely present. The score was transformed into a 3-point certainty scale, which converted to absolute value (0 = equivocal, 1 = probable, 2 = definite lesion). Linear mixed model statistics were used to compare the depiction and certainty scale between 1.5-T and 3-T images. Inter-observer agreement was assessed by using Kendall’s W statistics.
Results
Inter-observer agreements among the four readers were 0.718 for 1.5-T and 0.784 for 3-T MR images. Diagnostic accuracy of each reader was slightly increased using 3-T and varied regardless of level of reader experience. The certainty of CSM diagnosis was significantly improved using 3-T field strength. Equivocal lesions were significantly decreased in 3-T MRI in all readers.
Conclusion
Compared with 1.5-T MRI, 3-T imaging increased the certainty of the lesion and decreased the number of equivocal lesions in patients with CSM. Diagnostic accuracy was not affected by levels of reader experience.
Introduction
Cervical spondylotic myelopathy (CSM) is a common and major cause of disability in the adult population and is caused by degenerative changes in the bone, disc, and ligament structures of the cervical spine (1). It results in cord compression and, ultimately, neurological deterioration in affected individuals (1). Magnetic resonance imaging (MRI) is indicated in patients with persistent neck or arm pain and those who exhibit neurological findings or progression of symptoms (2). It provides detailed information of the degree and extent of spinal degeneration and cord compression. The greatest strength of MRI is its ability to identify intramedullary changes in the spinal cord compared with other modalities, including computed tomography (CT), or electrodiagnostic techniques. In particular, the presence of intramedullary hyperintensity on T2-weighted (T2W) imaging indicates a poor prognosis for postoperative outcomes of patients with CSM (2–4).
Since its development in the early 1990s, high-field 3-T MRI has been widely used to demonstrate its superiority over 1.5-T imaging in whole body fields, such as the brain, musculoskeletal system, thorax, and abdomen (5). Owing to the increase in signal-to-noise ratio (SNR; theoretically up to twofold) and a smaller voxel size for a given acquisition time, 3-T MR is expected to improve contrast or spatial resolution, which reveals subtle structural and pathological details not easily detectable at a field strength of 1.5-T (6). However, this improvement using 3-T MRI is likely not identical for all types of disorders. The diagnostic performance of 1.5-T and 3-T MRI may differ among diseases (7–10). In a review of previous studies comparing 1.5-T and 3-T MRI of central nervous system diseases, Guo et al. (7) revealed that scoring of MR-based brain atrophy and lesion index was not different between 1.5-T and 3-T MRI in both aging individuals and patients with Alzheimer’s disease. Tselikas et al. (8) demonstrated that 1.5-T and 3-T MRI revealed similar features in the follow-up of World Health Organization (WHO) grade II and III gliomas. Mellerio et al. (11) and Zijlmans et al. (12) reported that 3-T MRI was superior in diagnosing focal cortical dysplasia of the brain. However, Hashiguchi et al. (9) and Chow et al. (10) reported no difference in the diagnosis of hippocampal sclerosis between 1.5-T and 3-T MRI.
To our knowledge, there have been no studies comparing 1.5-T with 3-T imaging in evaluating spinal cord pathology. The purpose of our study was to compare the performance of 1.5-T and 3-T MRI in diagnosing CSM and to determine whether it is affected by different levels of reader experience.
Material and Methods
Patient selection
This retrospective study was approved by the institutional review board of Seoul National University Bundang Hospital. Given the retrospective nature of the investigation and the use of anonymized patient data, requirements for informed consent were waived.
The authors’ hospital is a referral center in their country; therefore, most patients are referred from local hospitals with MRI data, which are usually acquired using MR scanners with field strengths ≤1.5-T. Because the surgeons in the institute prefer 3-T scanning data, most patients considered for surgery are scanned again using 3-T MR scanners, which in turn enables the comparison of MR images acquired using 1.5-T and 3-T MR scanners in the same patients.
Between July 2012 and September 2014, consecutive patients who underwent decompressive surgery at the author’s hospital for the diagnosis of cervical spondylopathy were retrospectively reviewed. Inclusion criteria were: patients who underwent both preoperative 1.5-T and 3-T cervical spine MR with two months or less and those with available medical records. Patients who experienced trauma, underwent previous surgery on the cervical spine, were aged <19 years, or those with unavailable medical records were excluded.
Image acquisition
The mean interval between 1.5-T and 3-T MR images was 26 days (range = 0–60 days). Scans were acquired using a 3-T MR instrument (Intera Achieva, Philips Healthcare, Best, The Netherlands) equipped with a 16-channel neurovascular coil, with all patients in the supine position. All MR scans acquired using diverse 1.5-T scanners were performed at various hospitals before the referral to the authors’ hospital and with different protocols. All 1.5-T MR images taken at various hospitals included T2-weighted (T2W) fast spin-echo sagittal images (TR/TE = 2500–6000/75–126 ms). For axial views, T2W fast spin-echo images (TR/TE = 2500–6000/75–126 ms) were available in most of patients (68/79 patients). In 11/79 patients, T2*-weighted (T2*W) gradient-echo axial images (TR/TE/flip angle [FA] = 450–800 ms/4–30 ms/20–30°) were only available. Other scan parameters of 1.5-T MR were as follows: slice thickness = 2–4 mm; field of view (FOV) = 140 × 140–170 × 170 for axial scans and 220 × 220–340 × 340 for sagittal scans; matrix = 256 × 212–320 × 320 for axial scans and 320 × 256–448 × 358 for sagittal scans; echo train length = 14–29; and number of excitations = 2–5.
The MR examination protocol for cervical spondylopathies at the authors’ institution consisted of T1-weighted (T1W) spin-echo axial and sagittal images (TR/TE = 500–550/8–15 ms for axial scan and TR/TE = 500–550/10–15 ms for sagittal scan) and T2W fast spin-echo axial and sagittal images (TR/TE = 4300–5000/100–120 ms for axial scan and TR/TE = 3000–3400/100–120 ms for sagittal scan). Other MRI scan parameters included: slice thickness = 3 mm; FOV = 150 × 150 for axial scan and 250 × 250 for sagittal scan; matrix = 256 × 216 for axial scan and 512 × 252 for sagittal scan; FA = 90°; echo train length = 18; and number of excitations = 3.
Image interpretation
Four radiologists (one resident with one year of experience, one resident with three years of experience, a board-certified radiologist with a second-year fellowship in musculoskeletal radiology, and a professor with 13 years of experience in musculoskeletal radiology) blinded to clinical information independently and separately reviewed cervical spine MR images acquired with both 1.5-T and 3-T scanners at a three-week interval to prevent the effect of memory on imaging interpretation of each scanner. The readers evaluated depiction of intramedullary hyperintensity at eight cervical disc levels per patient on axial and sagittal T2W MR images using the following scale: –2 = definite absence; –1 = probable absence; 0 = equivocal lesion; 1 = probable presence; 2 = definite presence. The scale was then transformed into an absolute value to score the certainty of the lesion as follows: 0 = equivocal lesion; 1 = probable absent or present lesion; and 2 = definitely absent or present lesion.
To determine a “gold standard” of intramedullary hyperintensity on T2W MRI, depiction scores of 1 and 2 were only considered as present disease. Scores of –2, –1, and 0 were considered absent disease in each reader. The “gold standard” for the depiction of intramedullary T2 hyperintensity was set at a value in which at least three of four readers evaluated them to be the same. If the agreement was less than three of four readers, T2 hyperintensity was determined by consensus discussion.
Statistical analysis
To compare the degree of depiction and the certainty scale of intramedullary T2 hyperintensity between 1.5-T and 3-T images, linear mixed model statistics were performed (for handling clustered data in each patient). The Wilcoxon signed rank test was used to compare 1.5-T and 3-T images in terms of the number of equivocal lesions. Sensitivity and specificity for MR images of each scanner were calculated using 2 × 2 tables. Inter-observer agreement among the four readers was assessed using Kendall’s W statistics. Statistical analyses were performed using SPSS version 20 (IBM Corporation, Armonk, NY, USA) and MedCalc version 16.4.1 (MedCalc Software, Belgium); P < 0.05 was considered to be statistically significant.
Results
A total of 79 patients were enrolled in this study (48 men, 31 women; mean age = 56.8 years; age range = 30–75 years). The cord was evaluated at a total of 632 cervical disc levels among the 79 patients (eight cervical disc levels per patient), 83 of which were rated as true intramedullary hyperintensity on T2W imaging after consensus readings of MR images. Inter-observer agreement among the four readers was 0.715 for 1.5-T and 0.784 for 3-T MR images.
Diagnostic performance of radiologists with varying experience levels
Reader assessments of the presence or absence of compressive myelopathy in 1.5-T and 3-T MR images are summarized in Table 1. The presence of compressive myelopathy was increased in 3-T MR images for readers 1, 3 and 4 (Fig. 1), whereas it was decreased in reader 2; from 68 to 73 in reader 1 (P = 0.043), from 76 to 84 in reader 3 (P = 0.096), and from 64 to 89 in reader 4 (P < 0.001), but from 143 to 135 in reader 2 (P = 0.341). The sensitivity of 3-T MRI was greater than that of 1.5-T MRI for all readers and statistically significant in readers 1, 3 and 4 (Table 2). However, specificity was not significantly different among the readers (Table 2). Diagnostic performance did not demonstrate any tendencies according to radiologist experience level.

MR images of a 67-year-old man who underwent 1.5-T and 3-T MRI to investigate tingling in both arms. Sagittal and axial images acquired at 1.5-T field strength (a, c) do not reveal cervical myelopathy, whereas intramedullary hyperintensity is evident on both sagittal and axial T2W images at 3-T (b, d, arrows).
Compressive myelopathy on both 1.5-T and 3-T MR images by four readers.
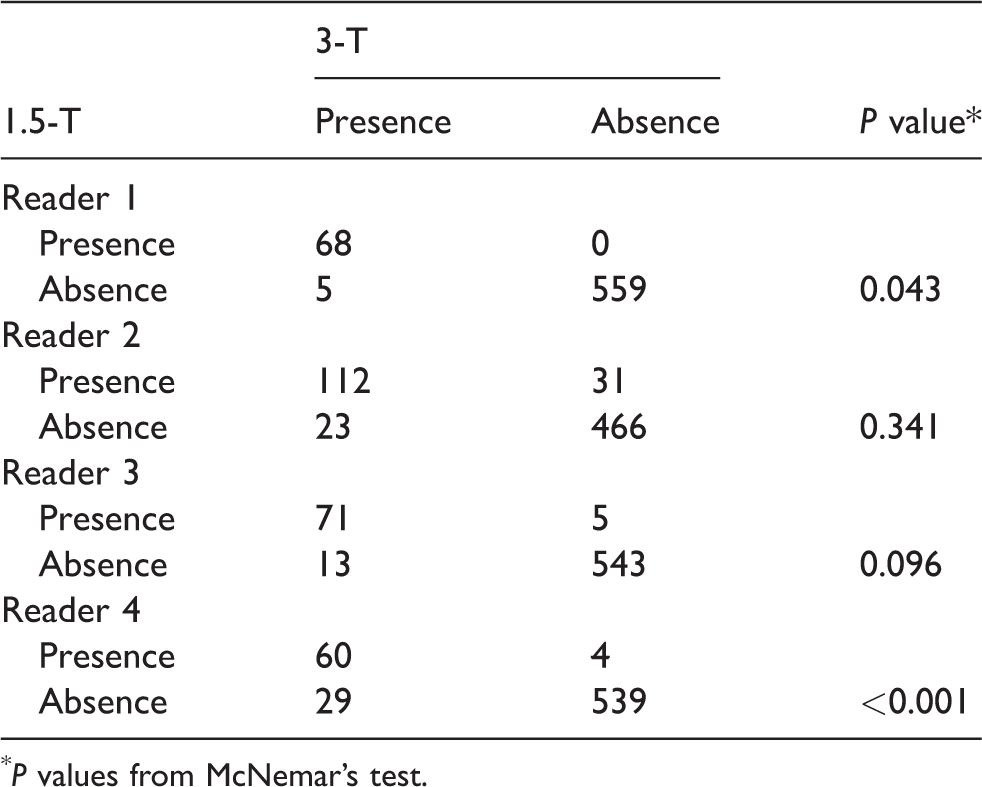
P values from McNemar’s test.
Diagnostic performance of 1.5-T and 3-T MR.
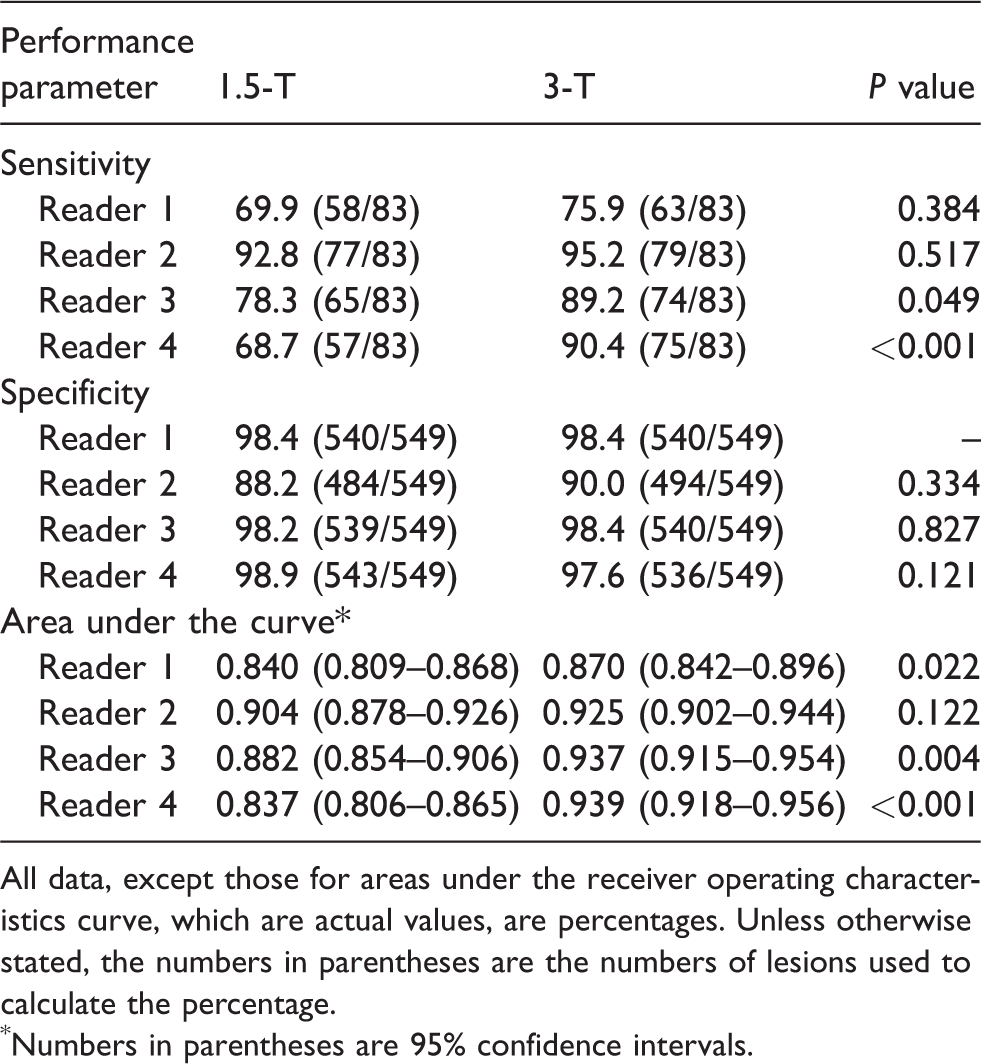
All data, except those for areas under the receiver operating characteristics curve, which are actual values, are percentages. Unless otherwise stated, the numbers in parentheses are the numbers of lesions used to calculate the percentage.
Numbers in parentheses are 95% confidence intervals.
Improved certainty of 3-T compared with 1.5-T MRI
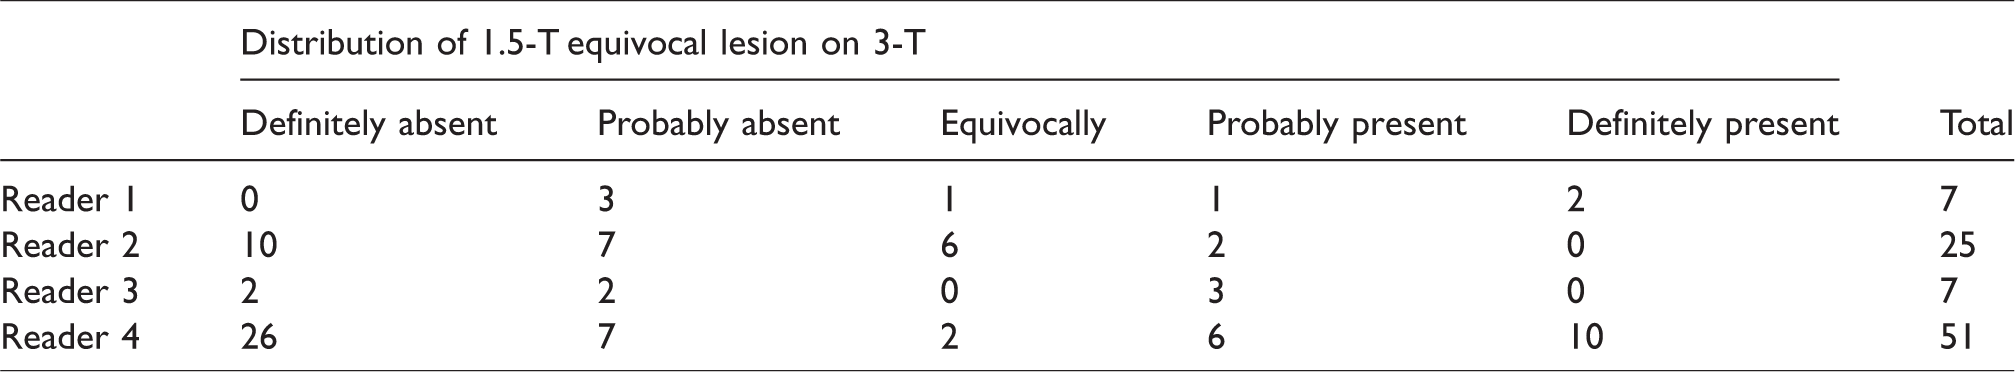
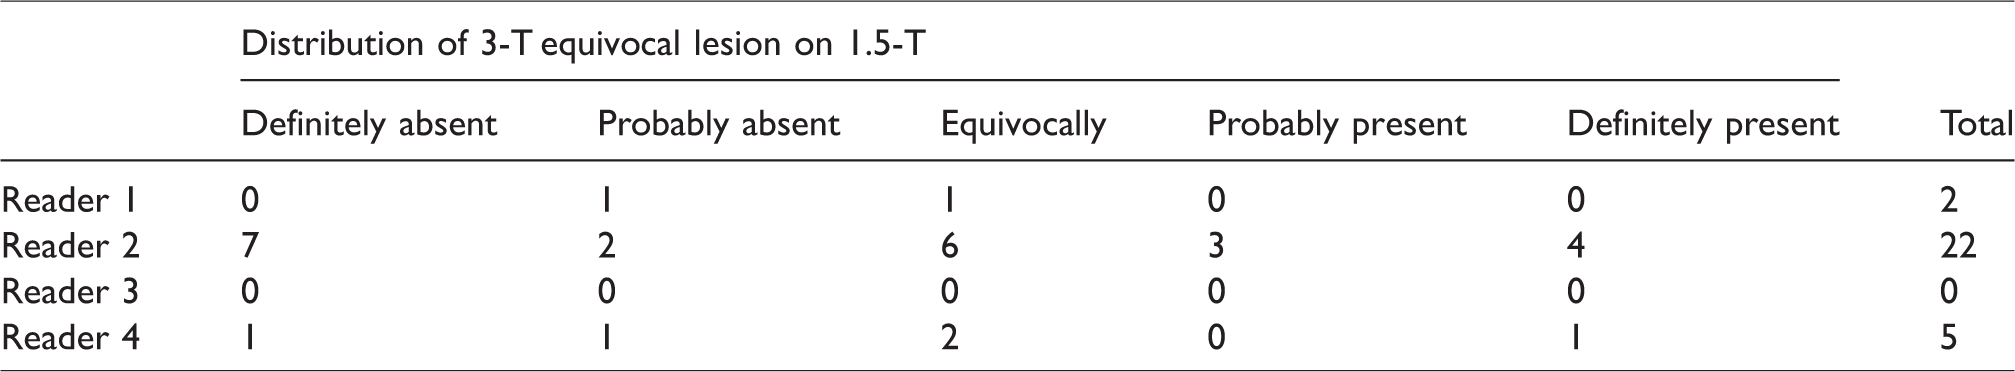
The certainty score of the lesion was increased in 3-T MR images for all readers and was statistically significant in readers 1, 3 and 4 (Table 3) (Fig. 2). In 3-T MRI, the number of definite lesions was increased and equivocal lesions were decreased for all readers compared with 1.5-T MRI (Table 3). In terms of distribution change of equivocal lesions from 1.5-T to 3-T MRI, equivocal 1.5-T lesions were likely to change toward the absence of cervical myelopathy in 3-T MRI (Table 4). Similarly, equivocal lesions on 3-T scanning exhibited the same tendency as 1.5-T MRI (Table 5).
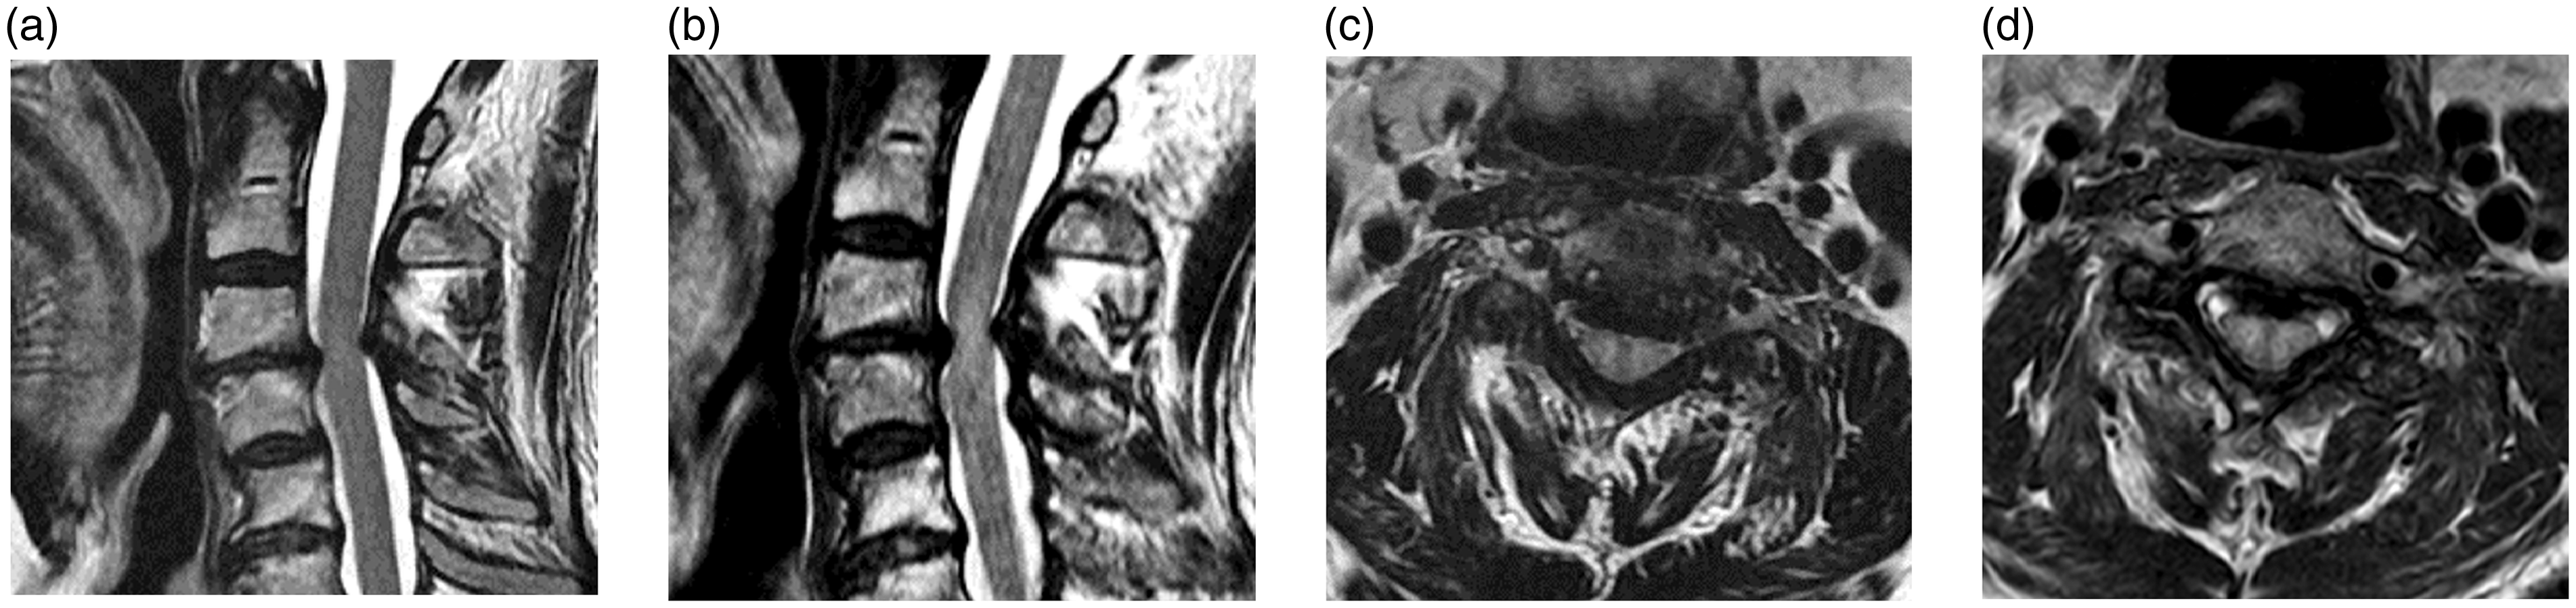
MR images acquired at field strengths of 1.5-T and 3-T in a 68-year-old man with complaints of neck pain. Cord signal change was scored as 0 (an equivocal lesion) on sagittal and axial images at 1.5-T (a, c), but changed to 1 (a probable presence) on sagittal and axial imaging at 3-T (b, d).
Comparison of 1.5-T and 3-T MR images in the certainty of cervical myelopathy by four readers.
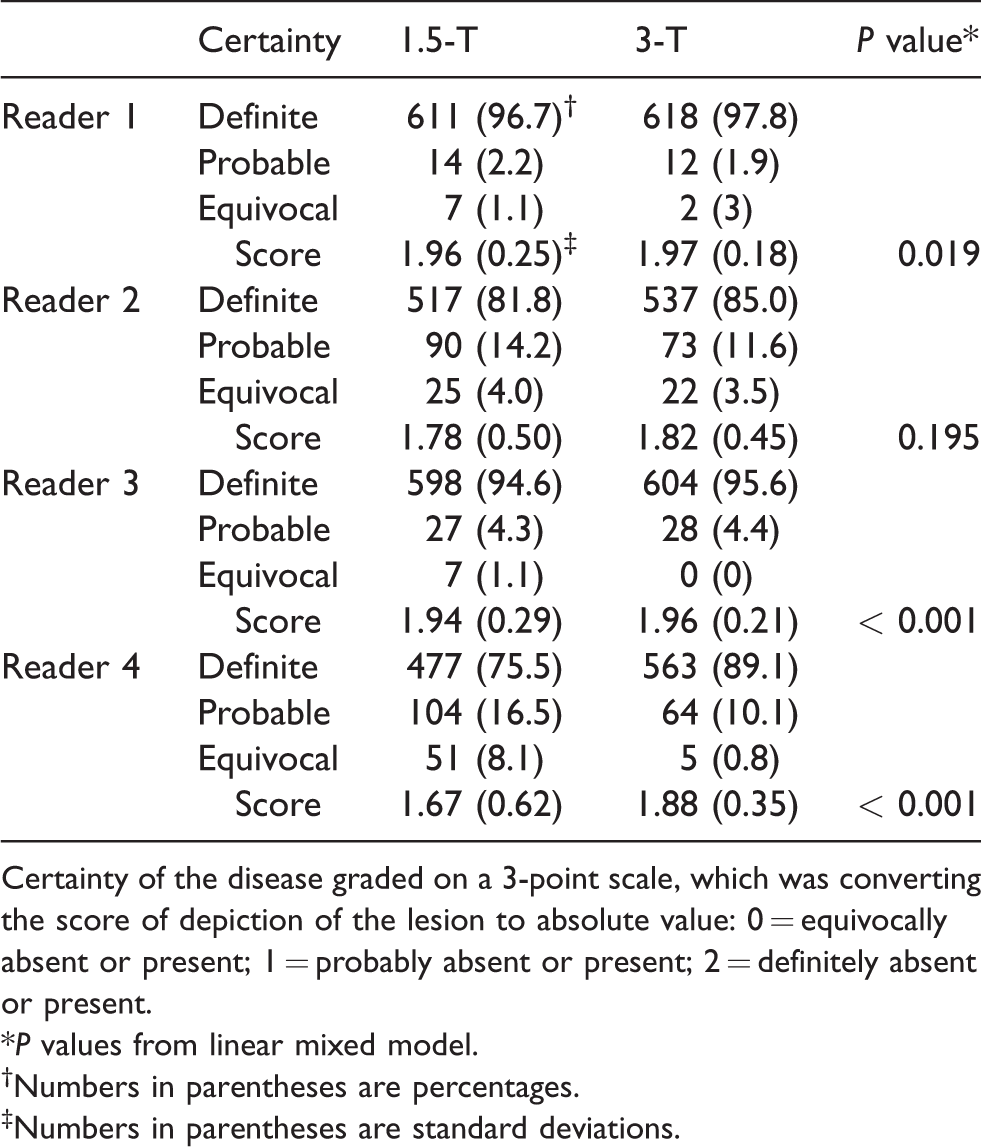
Certainty of the disease graded on a 3-point scale, which was converting the score of depiction of the lesion to absolute value: 0 = equivocally absent or present; 1 = probably absent or present; 2 = definitely absent or present.
*P values from linear mixed model.
Numbers in parentheses are percentages.
Numbers in parentheses are standard deviations.
Distribution of 1.5-T equivocal lesion on 3-T MR images.
Distribution of 3-T equivocal lesion on 1.5-T MR images.
Discussion
Intramedullary T2 hyperintensity is a sign of compressive myelopathy and an important prognostic factor in predicting postoperative outcomes (2–4,13). Signal changes in the cord on MRI may have an association with clinical symptoms such as muscle atrophy affected by nerve territories or upper motor neuron signs (14). Intramedullary T2 hyperintensity, which is a particularly discrete pattern of focal signal change on T2W imaging, may exhibit poor recovery after surgical decompression (15). It may reflect a variety of histological findings including edema, ischemia, gliosis, demyelination, and microcavities (3).
In the present study, 1.5-T and 3-T MRI demonstrated differences in detecting intramedullary T2 hyperintensity in patients with cervical spondylosis. 3-T MRI resulted in an increased detection rate, higher diagnostic certainty, and a reduced number of equivocal lesions. At higher MR field strengths, T2 relaxation times are generally decreased for any given tissue. There is an increase of approximately 20–40% in contrast to noise in gray-white matter (16). Spatial resolution is increased by the small voxel size in 3-T compared with 1.5-T MRI. These advantages may result in increased detection of cervical myelopathy and decreased lesion uncertainty on T2W 3-T MRI.
Although no studies have compared 1.5-T and 3-T MRI of spinal cord lesions, it may be possible to draw inferences from several comparative studies of 1.5-T and 3-T MRI in diagnosing central nervous system disorders (7,10–12). Based on the previous studies of brain disorders, 3-T was likely to be superior in detecting white matter signal changes in the central nervous system, but not for volume estimation or geometric evaluation (7,10–12). These are consistent with our study of CSM.
The inter-observer agreement among the four readers in the present study was 0.715 for 1.5-T and 0.784 for 3-T MRI in our study. 3-T scans demonstrated slightly higher inter-observer agreement, which probably resulted from higher resolution and better SNR. Although the agreement was substantial, the fact that the assessment of cord myelopathy was rather different among the readers and diagnostic performance was not associated with reader experience were quite striking. In fact, according to Karpova et al., inter-rater reliability among readers regarding spinal cord and canal deformities was in the range of 0.66–0.89 (17). This is a reflection of how subjective and difficult the interpretation of cervical myelopathy can be. It may be because the spinal cord is small (approximately only 12 mm in diameter), and sensitive to motion by the flow of cerebrospinal fluid, respiration, and swallowing (18). In our study, results from reviewer 2 showed much higher sensitivity and lower specificity when compared with those from other reviewers. We assumed that there would be a bias affected to reviewer 2 who had been considered as the main author in the planning stage of the study so he might have analyzed images too sensitively.
In the current study, T1W imaging was not used to assess cervical myelopathy and, moreover, is not included in 1.5-T MR scans from many outside hospitals. Early and intermediate-stage myelopathies tend to exhibit iso-intensity, which is not readily detectable on T1W images (14). Many studies investigating cervical myelopathy have been based on T2W imaging alone. The higher field strength of 3-T scanners yields longer T1 relaxation times, resulting in reduced T1 contrast, and the ability to delineate the spinal cord from CSF on 3-T T1W imaging remains inferior to that usually observed with 1.5-T imaging (6).
The present study has several limitations. First, the protocols used to acquire 1.5-T MRI data at outside hospitals were heterogeneous. Second, the gold standards of myelopathy were made by consensus readings owing to the nature of spinal cord lesions that could not be pathologically confirmative and no definite relationships with the clinical complaints such as neck pain (19). Third, the pattern of intramedullary T2 hyperintensity of the cord was not assessed. There are many studies that have reported a difference in the prognosis of patients according to the shape, margin, and degree of signal intensity of cervical myelopathy on T2W images (3,4,14,15). The agreement rate and diagnostic certainty of 3-T and 1.5-T MR images may be different depending on patterns of intramedullary T2 hyperintensity.
In conclusion, 3-T MRI had the advantages for the evaluation of intramedullary signal changes on T2W imaging, owing to increased detection rate and disease certainty. The use of 3-T MRI may be more helpful in diagnosing cervical myelopathy and establishing a treatment strategy than 1.5-T MRI.
Footnotes
Declaration of Conflicting Interests
The author(s) declared no potential conflicts of interest with respect to the research, authorship, and/or publication of this article.
Funding
The author(s) disclosed receipt of the following financial support for the research, authorship, and/or publication of this article: This work was supported by Mid-career Researcher Program through NRF grant funded by the Republic of Korea government (MSIP) (no. NRF-2016R1A2B4010992).