
Abstract
Background
The diagnostic efficacy of mono- and bi-exponential diffusion models are controversial in prostate cancer (PCa) aggressiveness evaluation. Whole-tumor histogram analysis may have the potential to improve their efficacy.
Purpose
To compare the efficacy of mono- and bi-exponential diffusion models for evaluating PCa aggressiveness using whole-tumor histogram analysis.
Material and Methods
In this retrospective study, 72 patients with PCa confirmed by radical prostatectomy were included. All patients underwent multi-b-value diffusion-weighted imaging (DWI). The mono-exponential model parameter (apparent diffusion coefficient [ADC]) and bi-exponential model parameters (D, D*, and f ) were calculated and whole-tumor histogram analysis was performed. Tumor lesions were classified into low-grade (LG) and high-grade (HG) Gleason grade groups. Spearman analysis was used to evaluate the correlations between the histogram metrics and Gleason score (GS). The area under the receiver operating characteristic curve (AUC) was used to assess the discriminatory capacity of each parameter in distinguishing LG from HG PCa.
Results
Most histogram metrics of ADC and D showed significant correlations with the GS. None of the histogram metrics of D* and only the maximum value and skewness of f showed significant correlations with GS. The 90th percentile ADC and 90th and 75th percentile D showed relatively higher efficacies than other histogram metrics. However, their AUCs were not significantly higher than that of mean ADC.
Conclusion
The bi-exponential model was not superior to the mono-exponential diffusion model for evaluating PCa aggressiveness. The histogram metrics did not outperform the conventional mean value.
Keywords
Introduction
Prostate cancer (PCa) is the second leading cause of cancer-related death in males in the United States (1). Assessing PCa aggressiveness is key in determining appropriate treatments for PCa patients (2,3). Multi-parametric magnetic resonance imaging (Mp-MRI) has been considered the best imaging technique for PCa detection and evaluation (4–6). Diffusion-weighted imaging (DWI) is an important component of Mp-MRI for characterizing PCa aggressiveness non-invasively (7,8).
The apparent diffusion coefficient (ADC) obtained from the conventional mono-exponential diffusion model has been used in many previous studies to evaluate PCa aggressiveness (4,9). The conventional mono-exponential model assumes that water molecules in biological tissues obey free Gaussian diffusion. However, the water molecules in biological tissues do not diffuse freely because they face many obstructions (6,10). The bi-exponential model is a new non-Gaussian diffusion model that can describe the complicated diffusion behavior of water molecules. The bi-exponential diffusion model may provide complementary information for PCa evaluation (11,12). Previous studies have applied the bi-exponential diffusion model to characterize PCa aggressiveness (11,13,14). However, whether parameters calculated from bi-exponential model outperform the ADC calculated from mono-exponential model in evaluating PCa aggressiveness remains controversial.
Whole-tumor histogram analysis is a more advanced and sophisticated imaging analysis method than the conventionally used mean value. Previous studies have shown a promising role of whole-tumor histogram analysis in evaluating PCa aggressiveness (2,14). However, a comparison of the whole-tumor histogram analysis and the conventional mean value in evaluating PCa aggressiveness has not been fully performed.
The purpose of our study was to compare the efficacy of mono- and bi-exponential diffusion models for evaluating PCa aggressiveness using whole-tumor histogram analysis. Since mean ADC is the most commonly used parameter in clinical practice, we explored whether histogram metrics can provide greater diagnostic value with reference to mean ADC.
Material and Methods
Patient information
Our institutional review board approved this retrospective study. Between October 2015 and January 2017, patients who met the following inclusion criteria were included: Mp-MRI examination including a DWI sequence with 14 b-values (0–1500 s/mm2) followed by a radical prostatectomy (RP). The exclusion criteria were as follows: (i) prior therapy for PCa; (ii) poor DWI image quality due to magnetic susceptibility artifacts, movement artifacts, or the presence of hip implants; (iii) previous biopsy performed within six weeks before the Mp-MRI examination; or (iv) a tumor lesion not clearly visible on DWI. Ultimately, 72 patients with PCa confirmed by RP were included (Fig. 1). The histopathologic analysis of the prostate after RP was performed by an experienced pathologist.
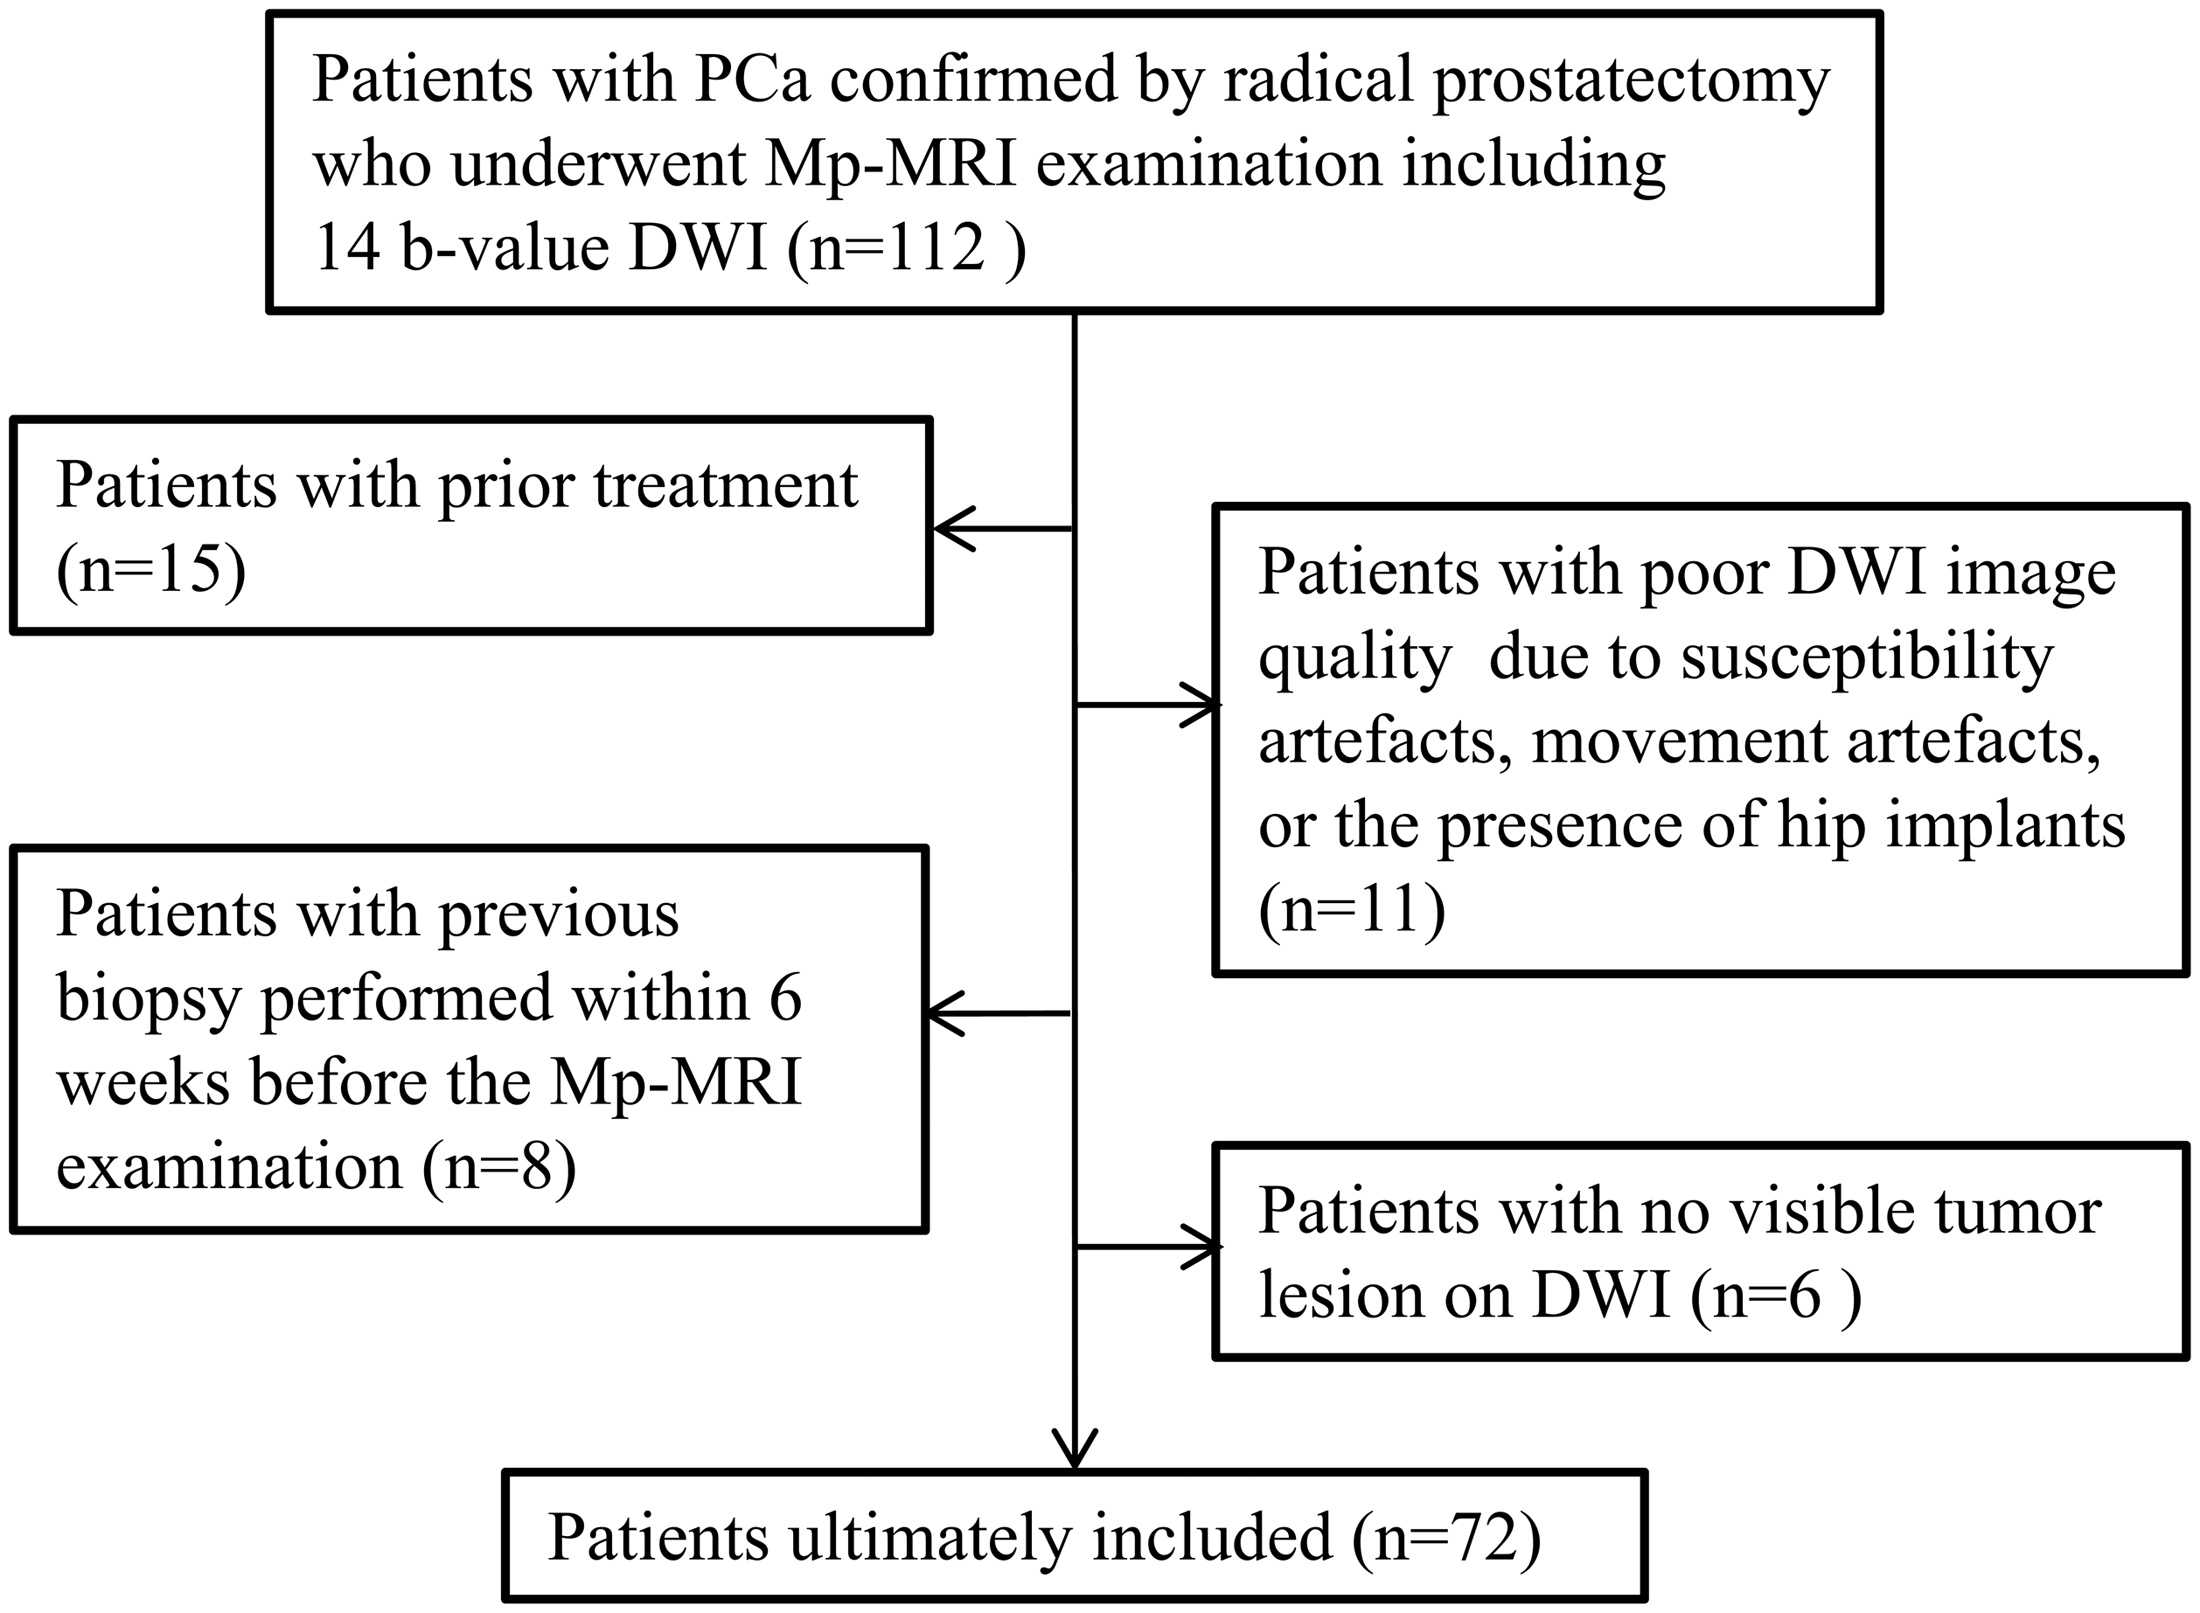
Flowchart of patient selection. PCa, prostate cancer; Mp-MRI, multi-parametric magnetic resonance imaging; DWI, diffusion-weighted imaging.
MRI examination
All patients were examined on a 3-T MRI scanner (Magnetom Skyra, Siemens Medical Solutions, Erlangen, Germany) with an 18-channel body coil and a built-in 32-channel spine phased-array coil. Our MRI protocol for prostate examination is summarized in Table 1.
Mp-MRI protocol for prostate examination.

T1W, T1-weighted; T2W, T2-weighted; DWI, diffusion-weighted imaging; DCE-MRI, dynamic contrast enhanced-MRI; NA, not applicable.
Image interpretation and data analysis
Post-processing of multi-b-value DWI was performed using in-house developed software based on MATLAB (Mathworks, Natick, MA, USA). The DWI data were fitted with the following two models:
Mono-exponential model
Bi-exponential model


where S(b) is the signal intensity at a particular b-value and S0 is the signal intensity at b = 0 s/mm2. ADC is the diffusion coefficient of the conventional mono-exponential model. D, D*, and f are three quantitative parameters calculated from the bi-exponential model. Among them, D is the pure molecular diffusion coefficient, D* is the perfusion-related diffusion coefficient, and f is the perfusion fraction.
Tumor lesions were manually outlined around the whole lesion on all slices by two radiologists (with three and four years of experience with prostate MRI) in consensus on the DWI images (b = 1500 s/mm2) using T2-weighted (T2W) imaging and ADC map as references (Fig. 2); both radiologists were blinded to the RP results. For patients with more than one lesion, the index lesion was selected for analysis (15,16). According to T2W imaging, high b-value DWI (b = 1500 s/mm2), and ADC maps, the largest suspicious tumor was defined as the index lesion (16). The histogram metrics including the 10th, 25th, 50th, 75th, and 90th percentiles and mean value, minimum value, kurtosis, and skewness of ADC, D, D*, and f of each lesion were calculated.

Post-processing of multi-b-value DWI. (a) The corresponding T2W imaging and ADC low-signal areas were used as references. (b) Two radiologists together manually outlined the ROIs around the whole lesion on all slices on DWI sequences (b = 1500 s/mm2). (c) The ROIs were automatically copied to the four parameter maps. (d) The histograms of ADC, D, D*, and f for each lesion were generated. DWI, diffusion-weighted imaging; T2W, T2-weighted; ADC, apparent diffusion coefficient; ROI, region of interest.
According to previous studies, all patients were divided into low-grade (LG, Gleason score [GS] ≤3 + 4) and high-grade (HG, GS ≥ 4 + 3) groups (17–19).
Statistical analysis
Spearman correlation analysis was used to evaluate the relationship between each histogram metric and GS. An independent-samples t-test was used to compare the differences in parameters between the LG and HG groups. Receiver operating characteristic (ROC) curve analysis was applied to evaluate the diagnostic performance of each parameter for distinguishing between LG and HG PCa. Diagnostic performance was expressed by the area under the ROC curve (AUC). Differences in AUCs were assessed using the method of DeLong et al. (20).
SPSS 19.0 (Chicago, IL, USA) was used for statistical analysis. The ROC analysis was performed with MedCalc 13.0 (Mariakerke, Belgium). The significance level was set at P < 0.05 for all analyses.
Results
Among the 72 included patients, 29 patients (40.28%) had LG PCa and 43 patients (59.72%) had HG PCa. The patients’ characteristics are summarized in Table 2.
Clinical characteristics of the study population.

PSA, prostate-specific antigen; quartile indicates the 25th to 75th percentile; RP, radical prostatectomy.
Spearman’s correlation coefficients for the histogram metrics of ADC, D, D*, and f with Gleason scores.

*P < 0.05, which was considered a statistically significant correlation.
ADC, apparent diffusion coefficient.
The comparisons of the histogram metrics between the HG and LG groups are summarized in Table 4 and Fig. 3. Two representative cases are shown in Figs. 4 and 5. The independent-samples t-test showed that the histogram metrics including 10th, 25th, 50th, 75th, and 90th percentiles and mean and minimum values of ADC and D were significantly lower in the HG group than those in the LG group (all P < 0.05). The kurtosis of D was significantly higher in the HG group than that in the LG group (P = 0.025). All the histogram metrics of D* did not show statistically significant differences between LG and HG PCa groups (all P > 0.05). The skewness and maximum value of f showed statistically significant differences between the LG and HG groups (P < 0.05 for both).
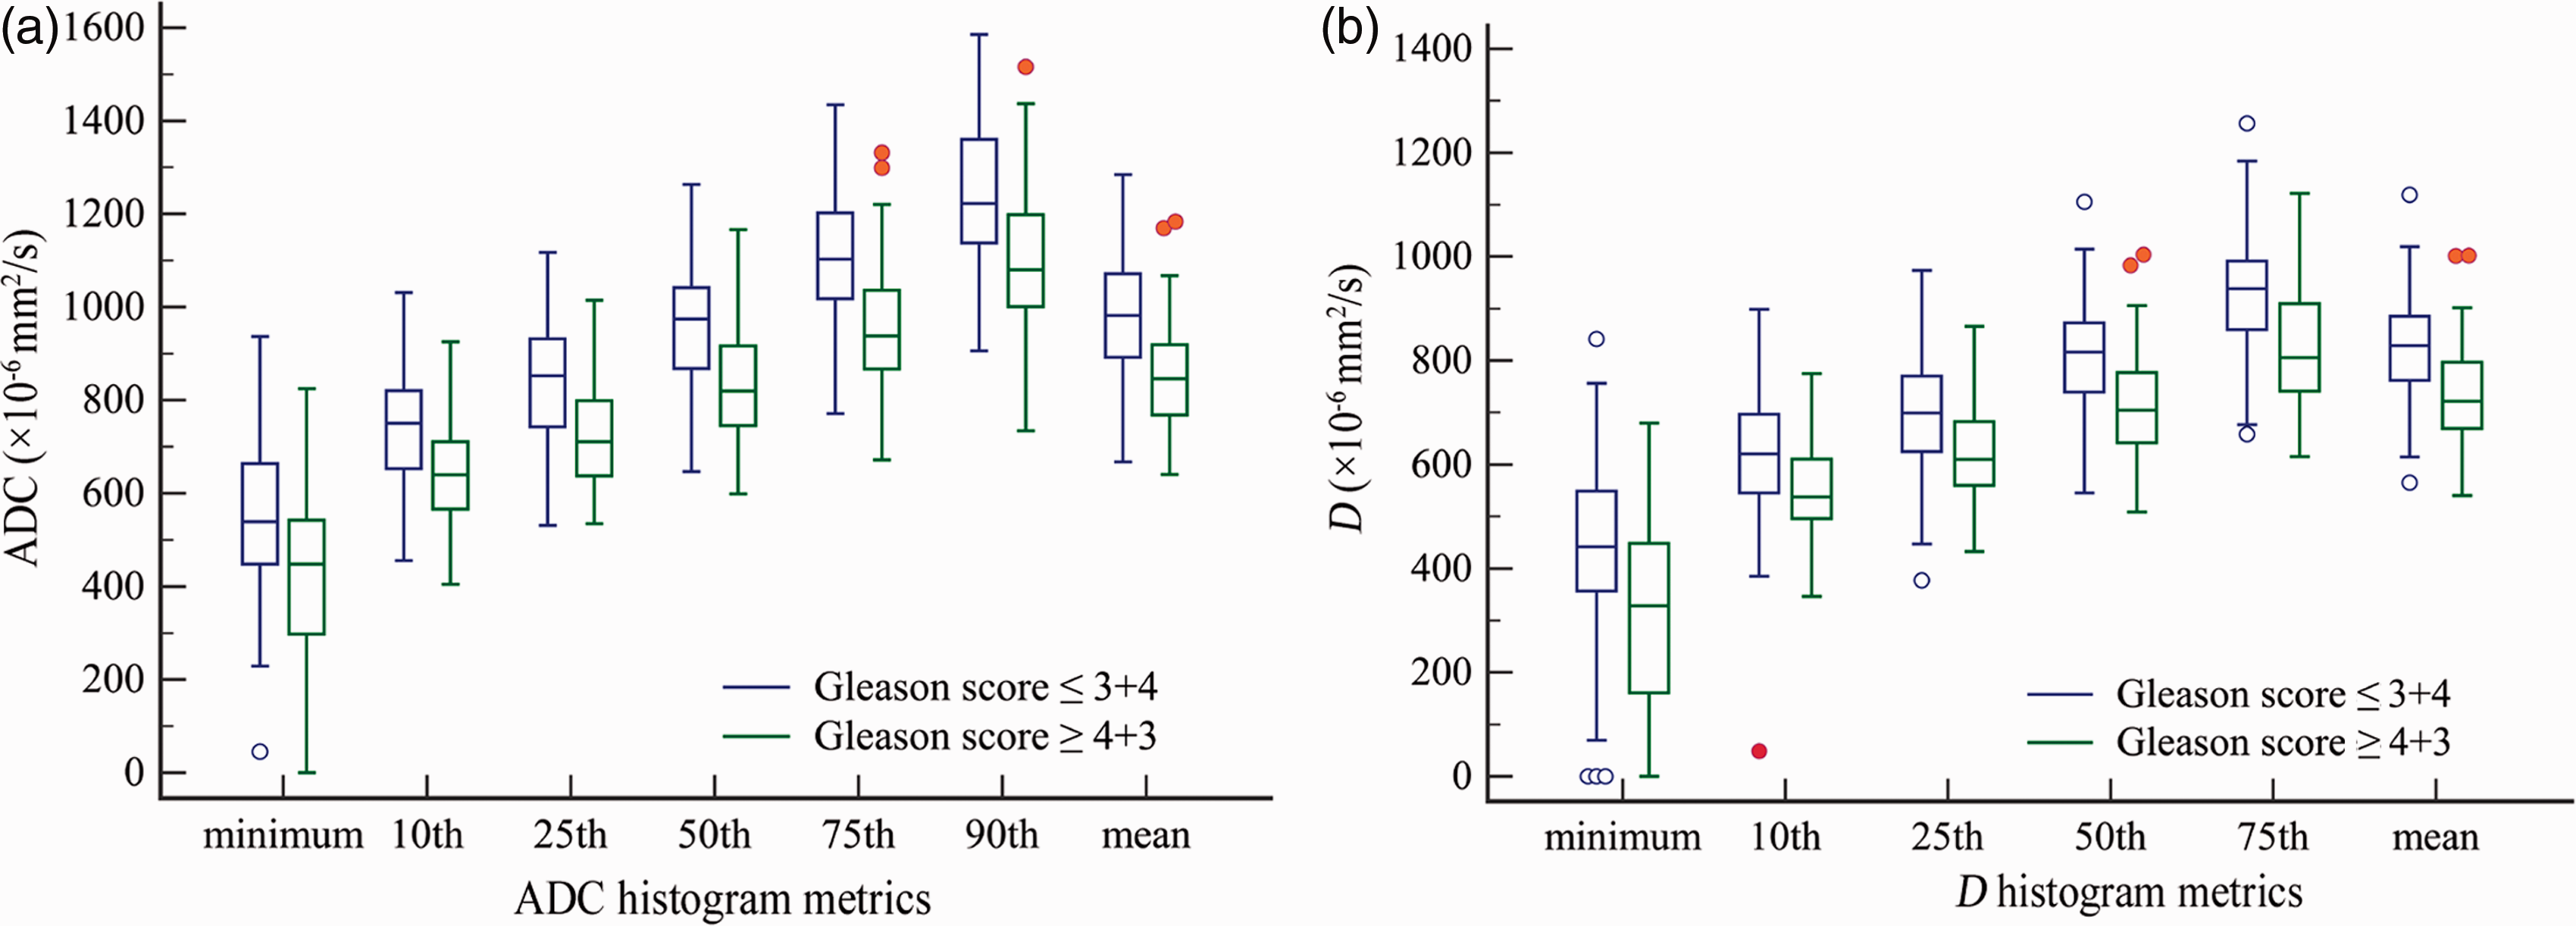
(a) The 10th, 25th, 50th, 75th, and 90th percentiles, minimum value, and mean value of ADC were significantly different between GS ≤ 3 + 4 and GS ≥ 4 + 3 PCa (P < 0.05). (b) The 10th, 25th, 50th, 75th, and 90th percentiles, minimum value, and mean value of D were significantly different between GS ≤ 3 + 4 and GS ≥ 4 + 3 PCa (P < 0.05). ADC, apparent diffusion coefficient; GS, Gleason score; PCa, prostate cancer.
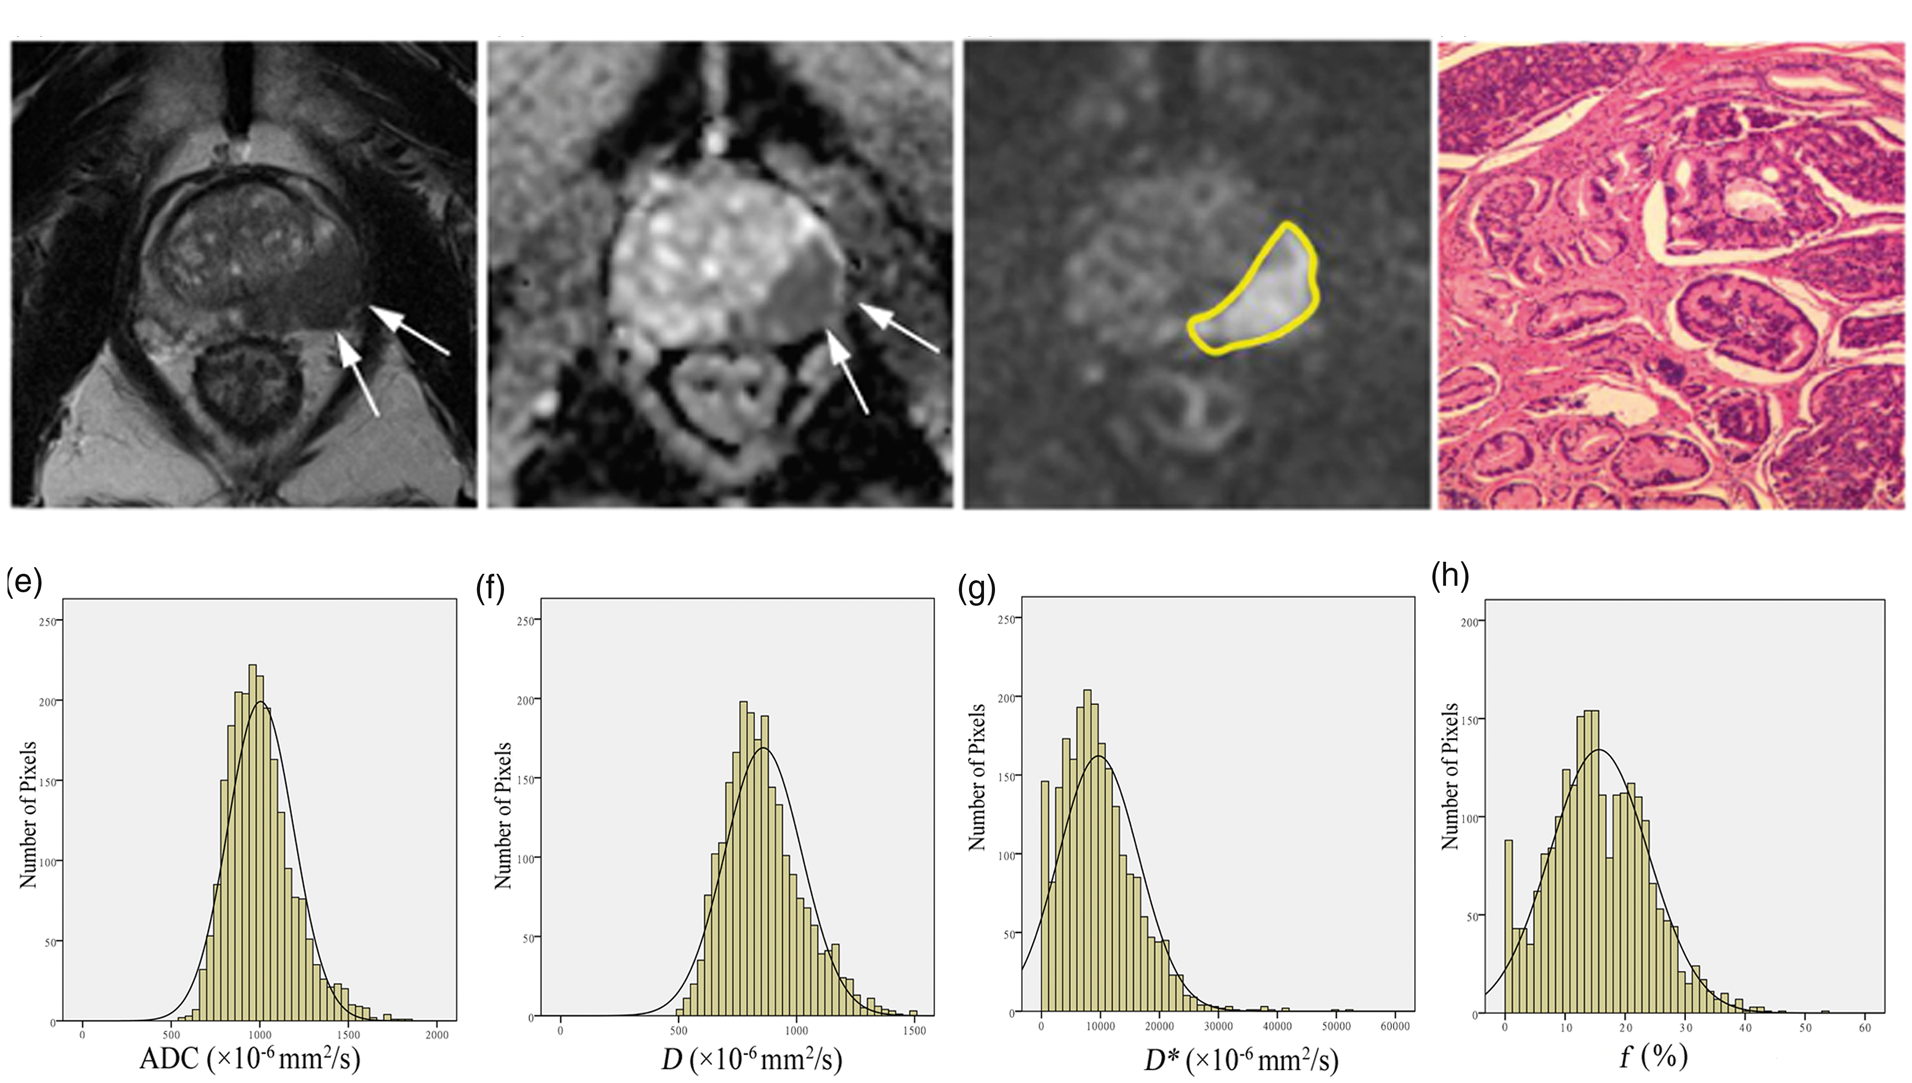
A 63-year-old patient with a PSA level of 34.58 ng/mL. (a) T2W imaging and (b) ADC show the tumor (white arrow) in the left peripheral zone. (c) Manually outlined ROIs (yellow line) around the whole lesion on DWI (b = 1500 s/mm2). (d) The GS was confirmed to be 3 + 4 by pathology. (e–h) Four histograms of ADC, D, D*, and f were generated. PSA, prostate-specific antigen; T2W, T2-weighted; ADC, apparent diffusion coefficient; ROI, region of interest; DWI, diffusion-weighted imaging; GS, Gleason score.
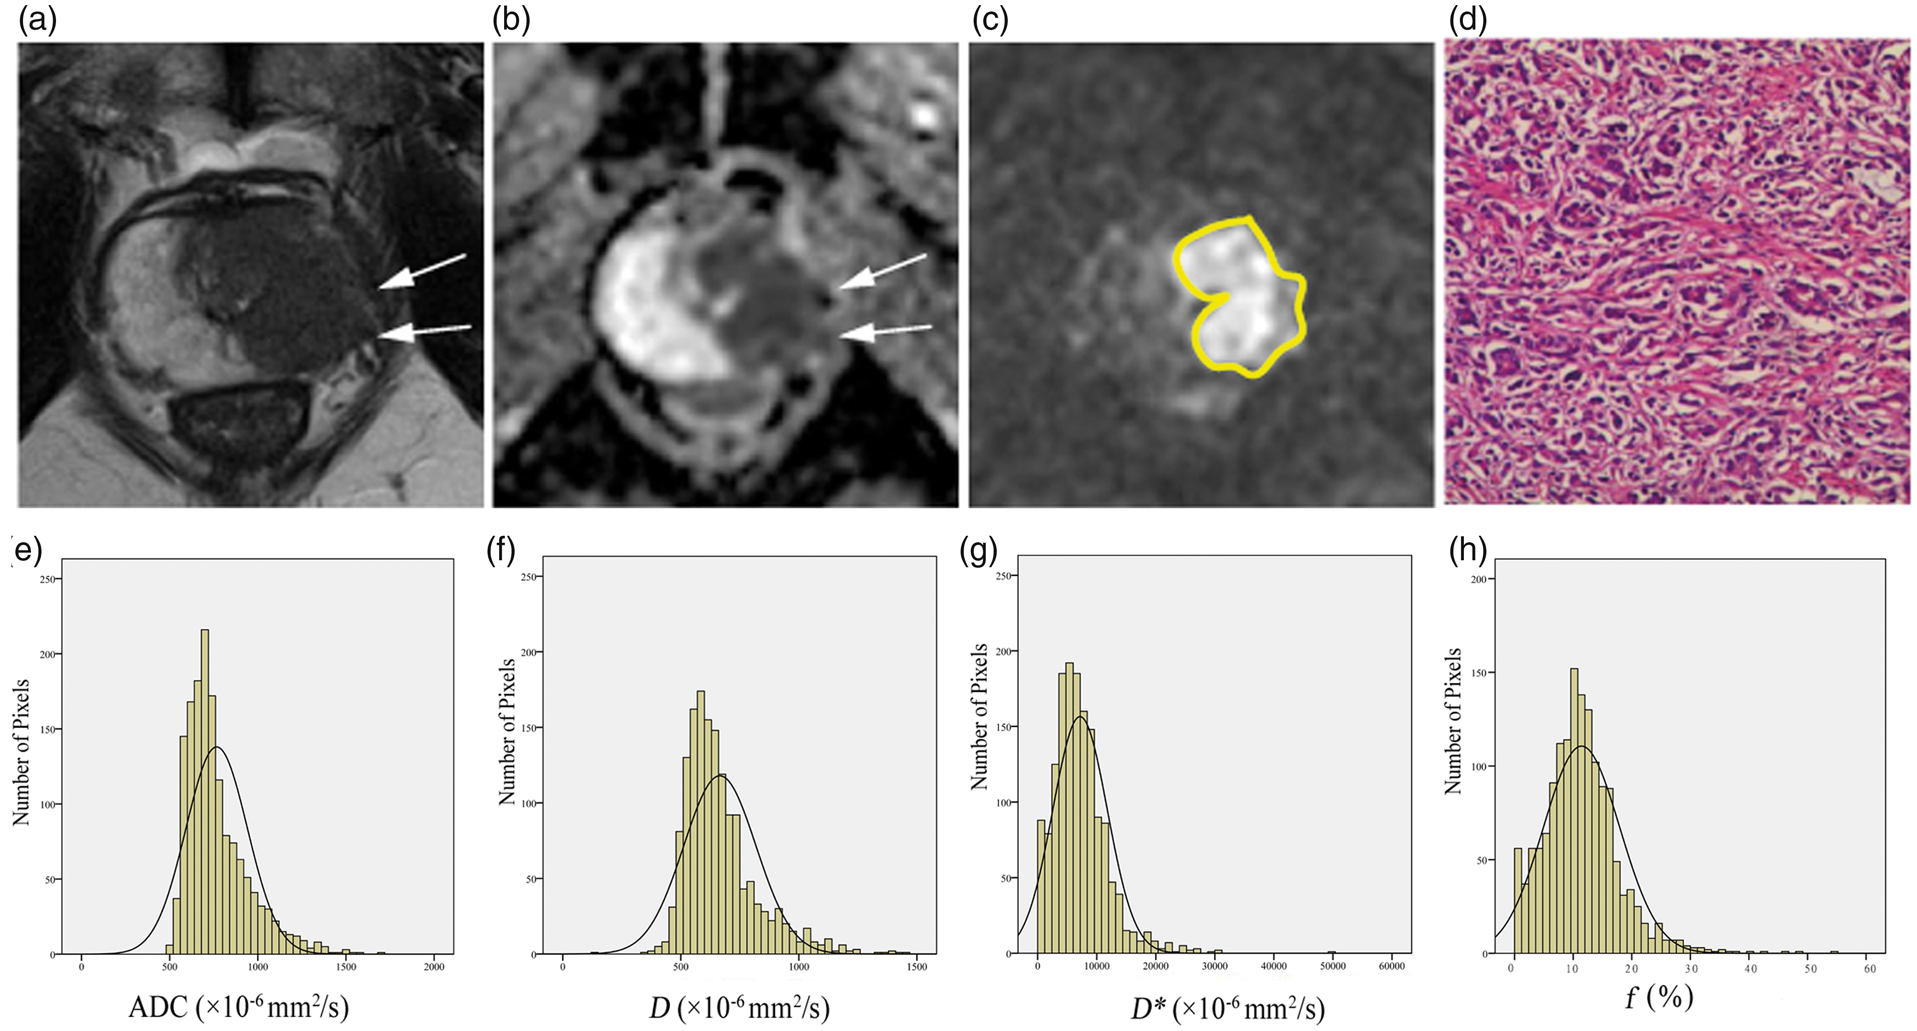
A 59-year-old patient with a PSA level of 92.49 ng/mL. (a) T2W imaging and (b) ADC show the tumor (white arrow) in the left peripheral zone and left transition zone. (c) Manually outlined ROIs (yellow line) around the whole lesion on DWI (b = 1500 s/mm2). (d) The GS was confirmed to be 4 + 5 by pathology. (e–h) Four histograms of ADC, D, D*, and f were generated. PSA, prostate-specific antigen; T2W, T2-weighted; ADC, apparent diffusion coefficient; ROI, region of interest; DWI, diffusion-weighted imaging; GS, Gleason score.
Comparison of the histogram metrics of ADC, D, D*, and f between GS ≤ 3 + 4 and GS ≥ 4 + 3 prostate cancers (mean ± SD).
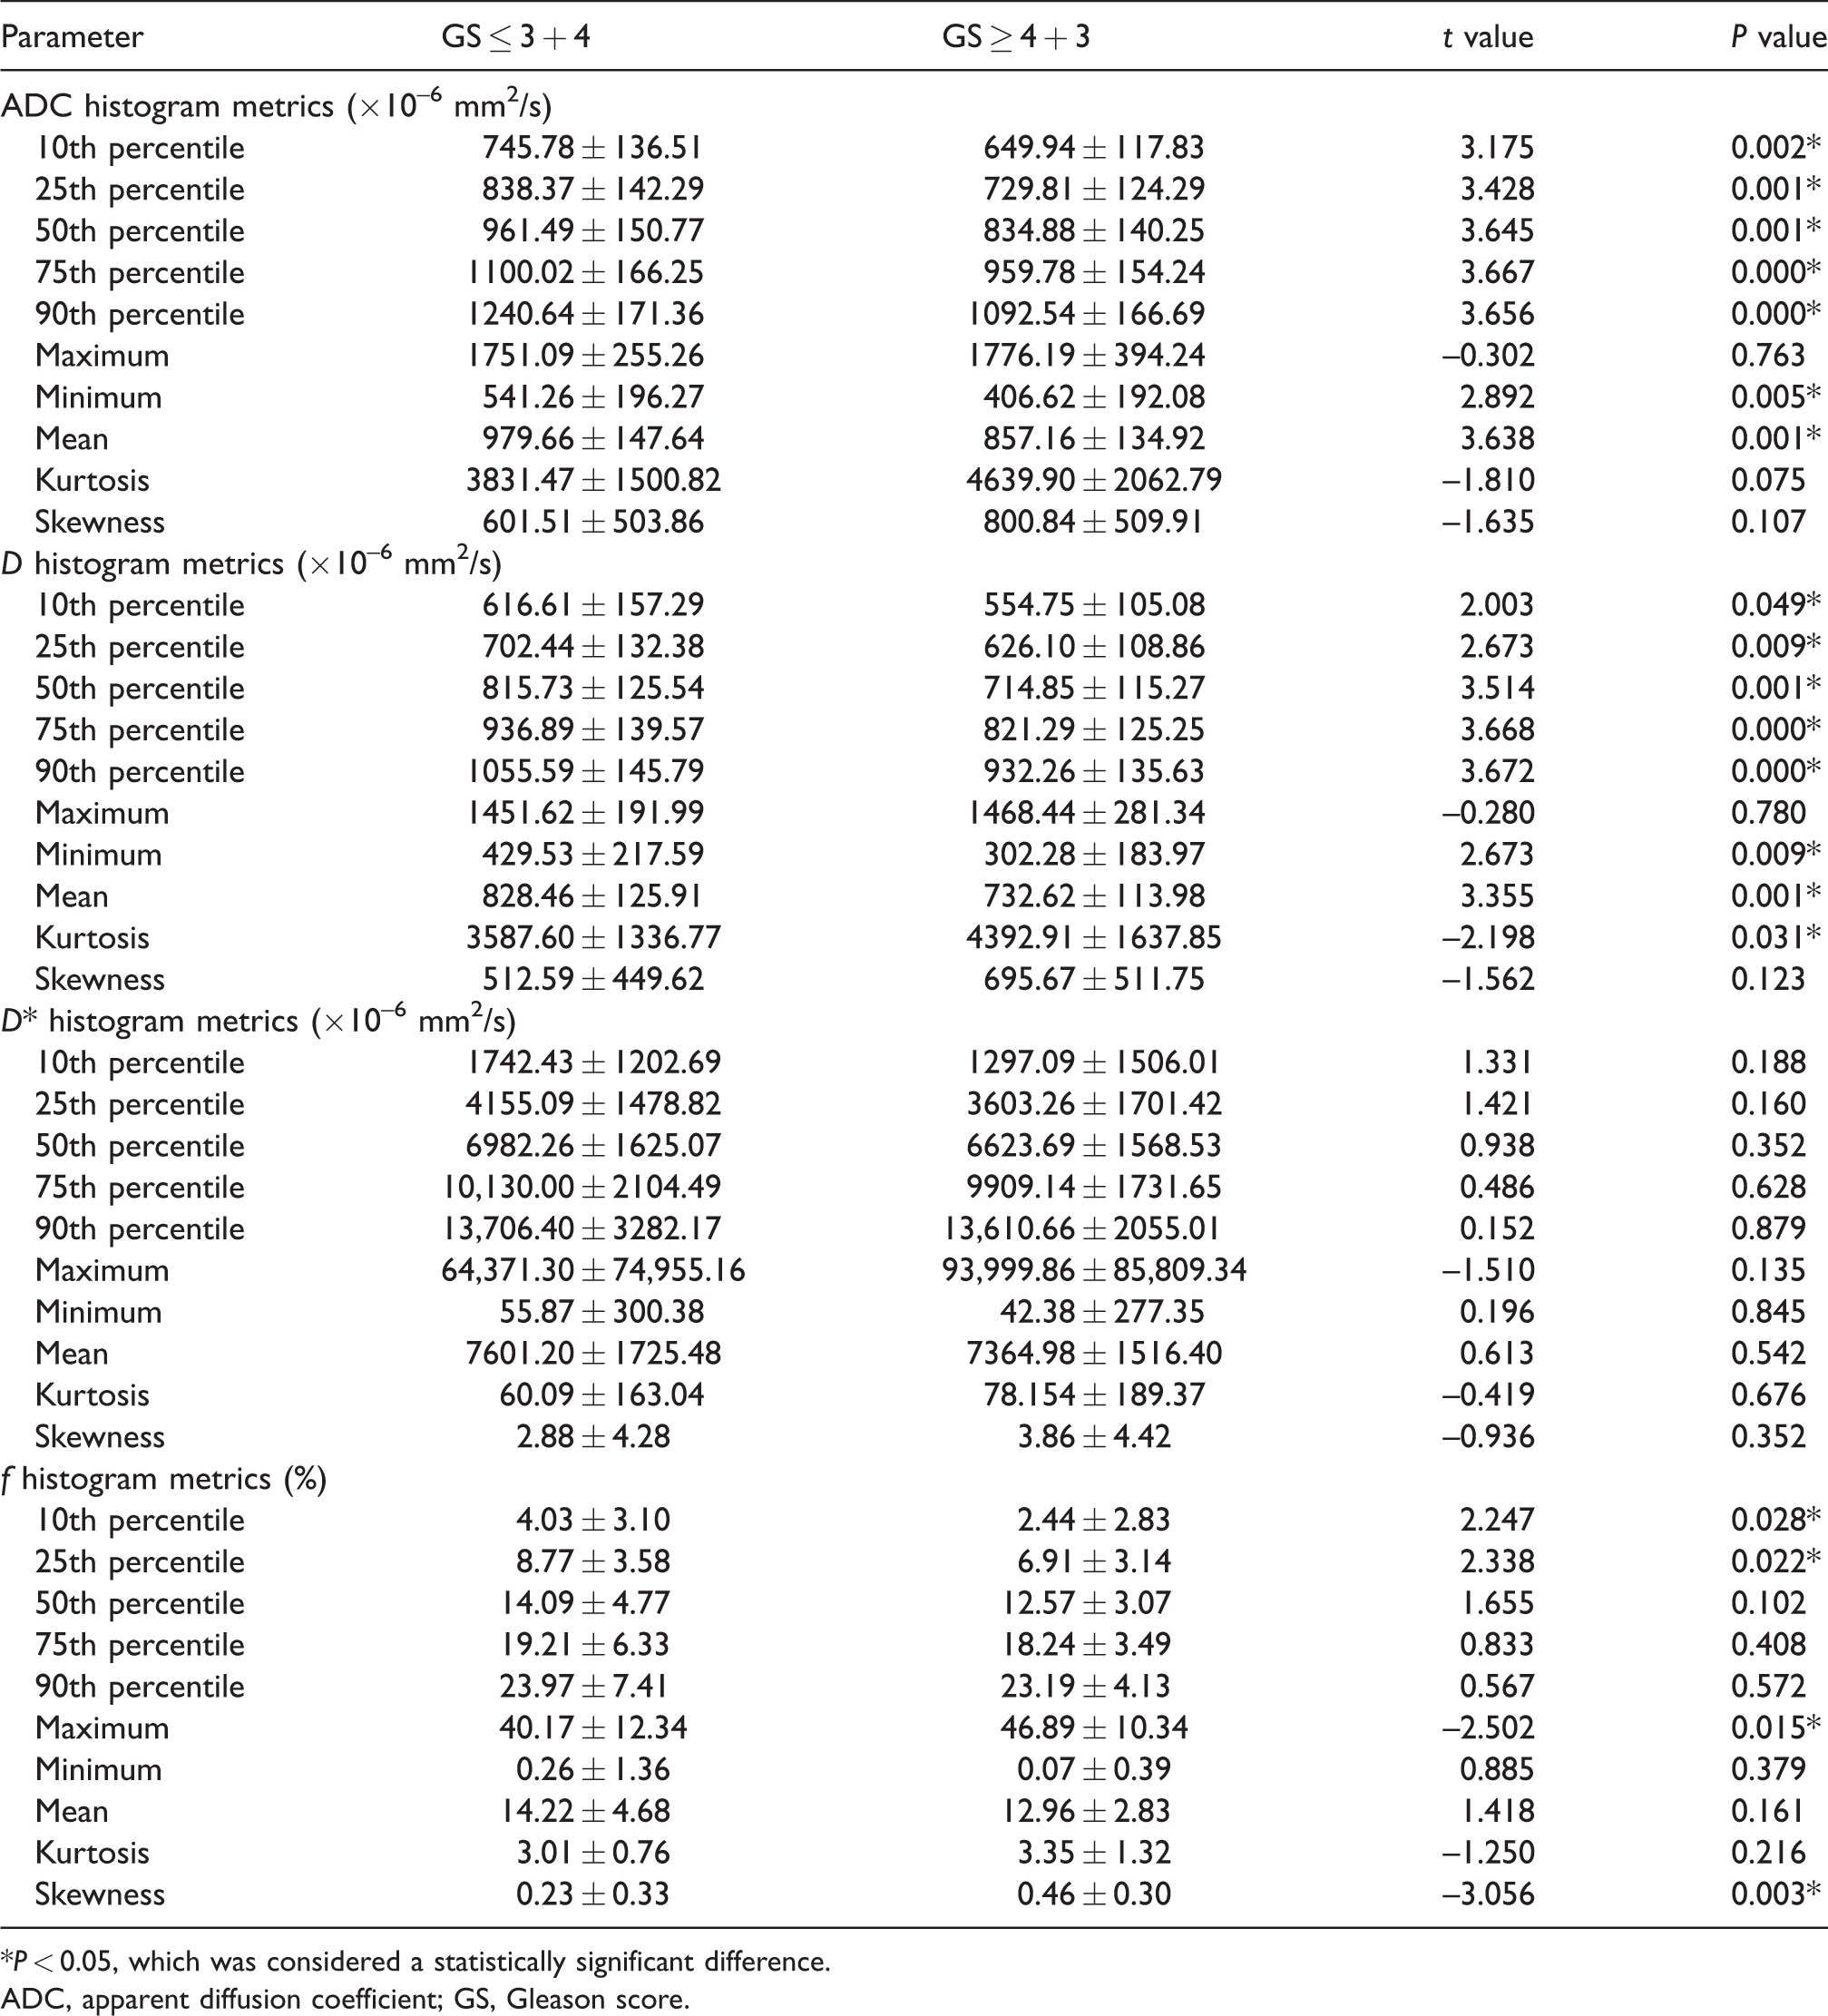
*P < 0.05, which was considered a statistically significant difference.
ADC, apparent diffusion coefficient; GS, Gleason score.
The results of the ROC curve analyses of the histogram metrics are reported in Table 5 and Fig. 6. Among the histogram metrics of mono-exponential model parameters, the 90th percentile ADC provided relatively higher AUCs in differentiating LG from HG PCa. Among the histogram metrics of bi-exponential model parameters, the 90th and 75th percentiles of D showed higher AUCs than other metrics. While the AUCs of the 90th and 75th percentiles of D showed no significant difference compared to that of mean D. The AUCs of the 90th percentile ADC and 90th and 75th percentile D were not significantly higher than that of mean ADC (P > 0.05 for all comparisons).
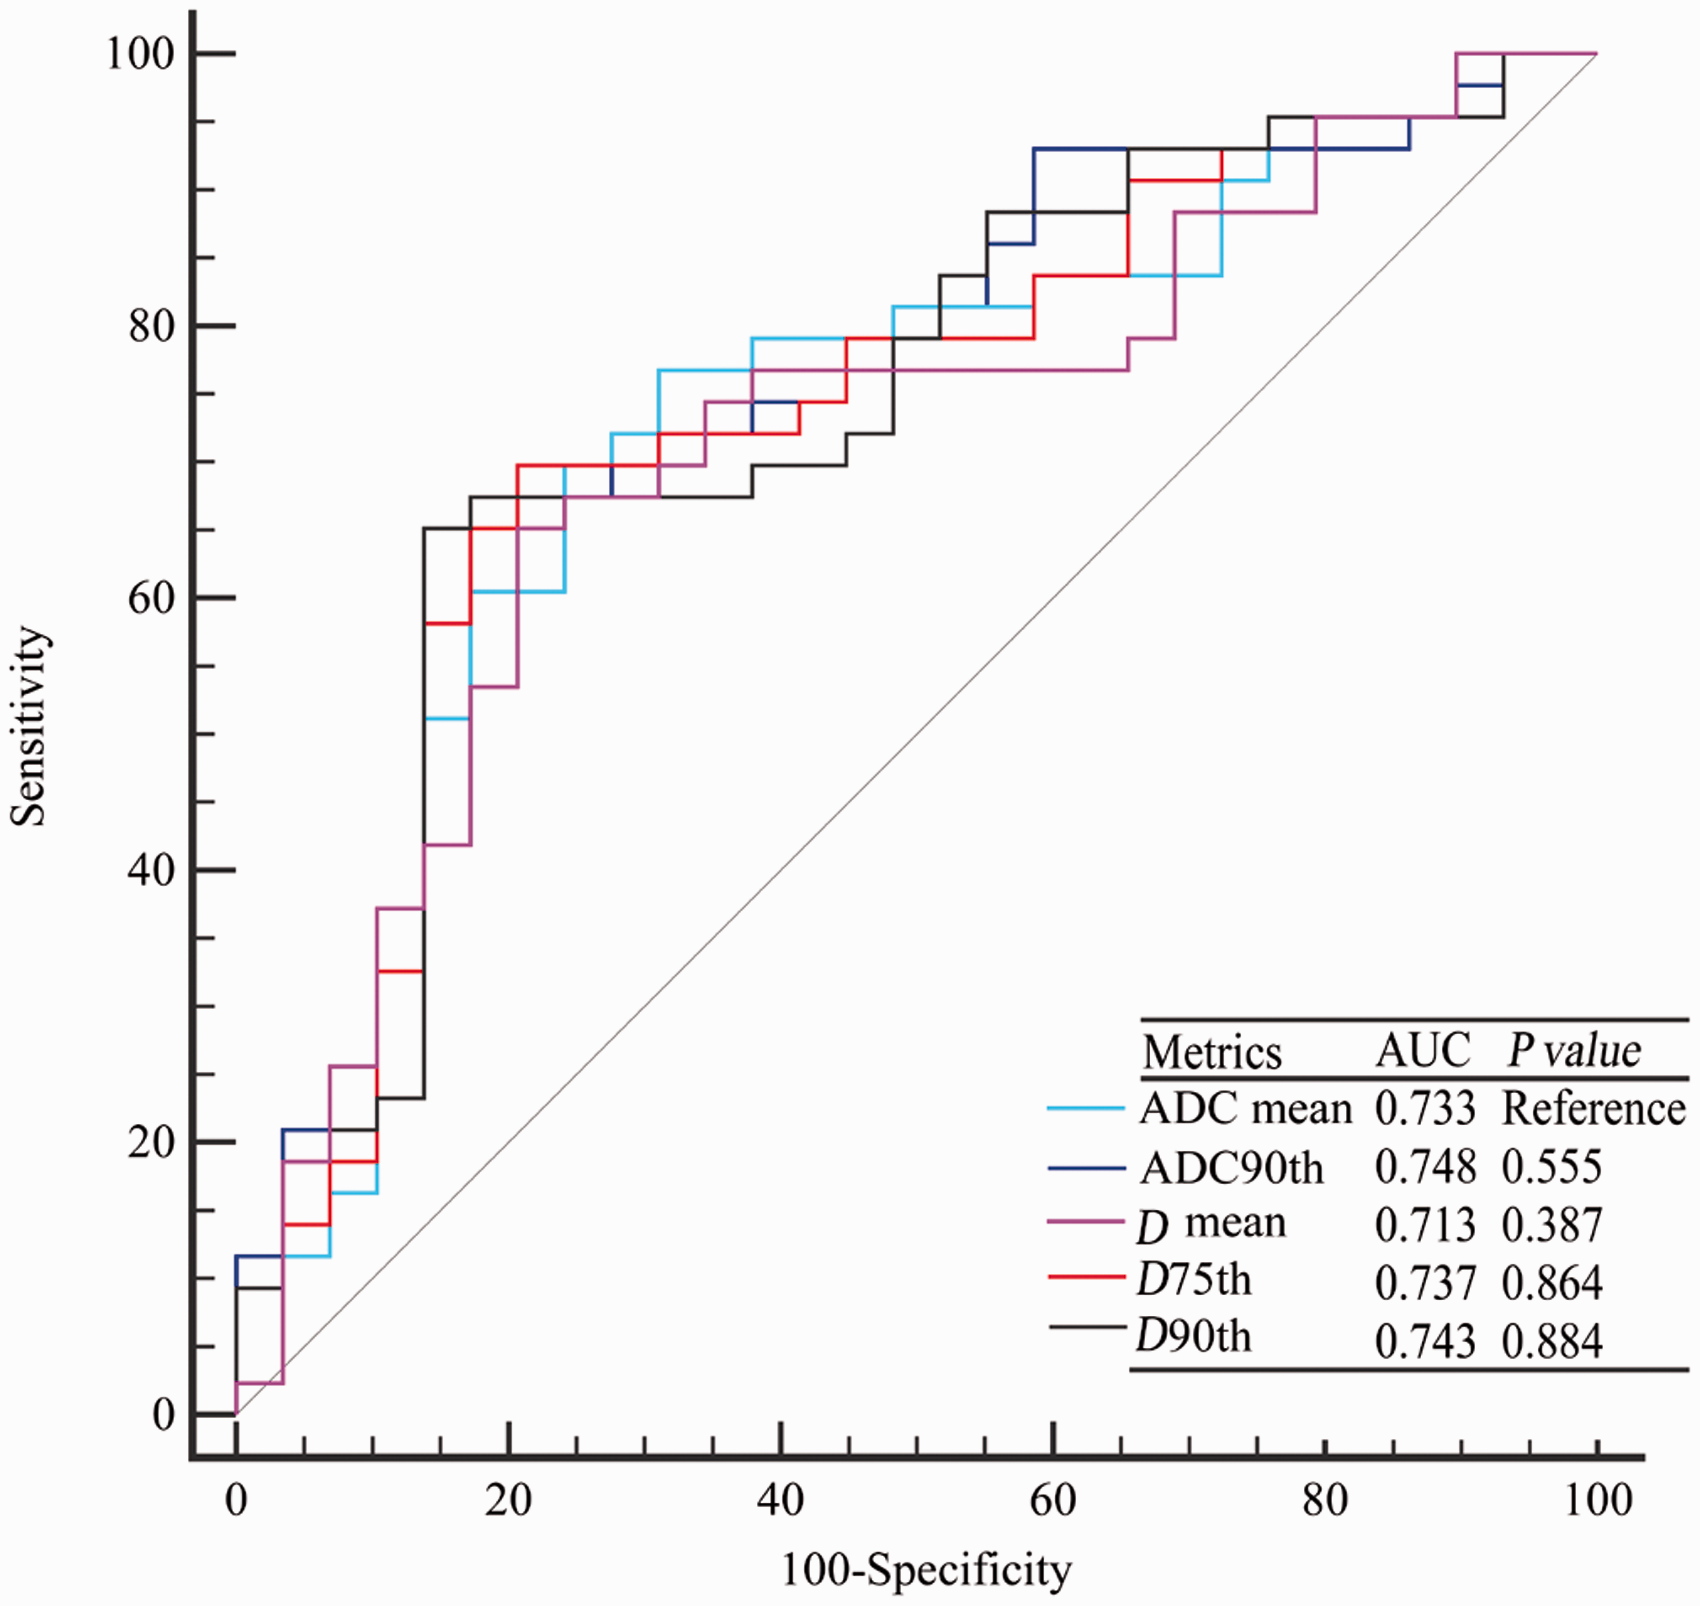
Comparisons by ROC analysis of mean ADC, 90th percentile ADC, mean D, 75th percentile D, and 90th percentile D in differentiating GS ≤ 3 + 4 and GS ≥ 4 + 3 PCa. ROC, receiver operating characteristic curve; ADC, apparent diffusion coefficient; GS, Gleason score; PCa, prostate cancer.
ROC analysis of ADC and D histogram metrics for differentiating between GS ≤ 3 + 4 and GS ≥ 4 + 3 prostate cancers.
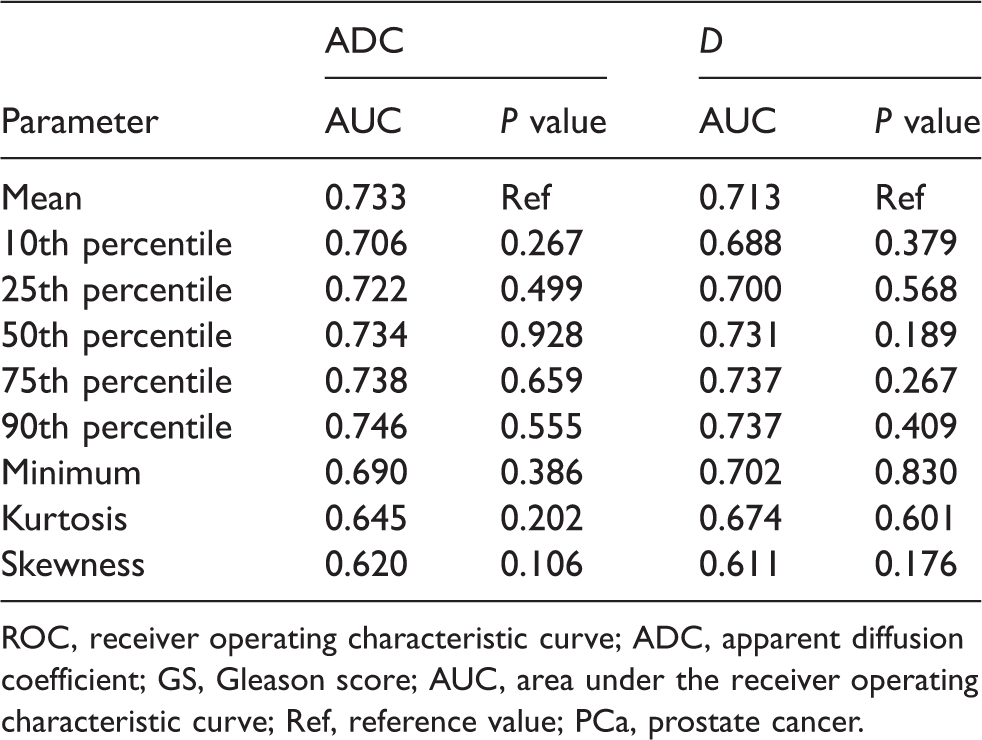
ROC, receiver operating characteristic curve; ADC, apparent diffusion coefficient; GS, Gleason score; AUC, area under the receiver operating characteristic curve; Ref, reference value; PCa, prostate cancer.
Discussion
DWI has been regarded as a crucial sequence of Mp-MRI for characterizing PCa aggressiveness non-invasively (7,8). The bi-exponential model provides more quantitative parameters to describe the complicated diffusion behavior of water molecules. Although some researchers favor the bi-exponential model for PCa aggressiveness evaluation (11,14), others insist that the mono-exponential model is sufficient (13,15). Additionally, whole-tumor histogram analysis may have the potential to improve the diagnostic efficacy of DWI in PCa aggressiveness evaluation. Therefore, we performed this study to compare the performance of mono-exponential and bi-exponential diffusion models for evaluating PCa aggressiveness using whole-tumor histogram analysis.
Whole-tumor histogram analysis can generate many quantitative parameters and may show superior strength in differentiating LG tumors from HG tumors compared with the mean value. Our study showed that most of the histogram metrics of ADC and D were significantly correlated with GS. Hence, these metrics have the potential to stratify the GSs of PCa. The 90th percentile ADC and 90th and 75th percentile D showed relatively higher AUCs among all the histogram metrics of both mono- and bi-exponential model parameters in differentiating LG from HG PCa. However, the AUCs of these three metrics were not significantly different from those of their respective mean values, which indicated no superiority of the whole-tumor histogram metrics. In another study, Park et al. evaluated the performance of whole-tumor histogram analysis of ADC in invasive ductal breast cancer and ductal carcinoma in situ (21). Similar to our study, their results showed no increased diagnostic performance of the histogram analysis. In other studies, however, the 10th percentile of ADC performed significantly better than other histogram metrics for predicting PCa aggressiveness (2,22). The discrepancy of these findings may be related to differences in the definitions of LG and HG PCa and differences in patient cohorts. The definition of the GS cut-off value for LG and HG PCa varies from study to study (23). We defined GS ≥ 4 + 3 as HG PCa rather than GS ≥ 3 + 4, which was used in Liu’s study (22). Many studies support that differentiating PCa patients with GS ≥ 4 + 3 from those with GS ≤ 3 + 4 is key for assessing patient prognosis and selecting appropriate treatments (24–27). Additionally, only five patients had GS < 3 + 4 in the current study, which prevented us from classifying the patients into GS < 3 + 4 and GS ≥ 3 + 4 groups. Given the importance of differentiating GS ≥ 4 + 3 from GS ≤ 3 + 4 PCa and referring to previous studies (23–27), we defined GS ≥ 4 + 3 as HG PCa.
The bi-exponential diffusion model has been proven to describe the complicated diffusion behavior of water molecules. Based on the theory of the bi-exponential model, the signal acquired by DWI includes two forms of microscopic motion, namely, pure water molecular diffusion (D) and microcirculation of blood in the capillary network (D*) (28). In our study, the ADC values were significantly higher than D values, verifying the existence of two different diffusion forms (13). However, none of the histogram metrics of the bi-exponential model showed significantly higher AUCs than the mean ADC. That is, the bi-exponential model was not superior to the mono-exponential model in evaluating PCa aggressiveness, which is consistent with Barbieri’s findings (15). Furthermore, Pesapane et al. found that ADC could identify different GSs of PCa, while bi-exponential model parameters could not (13). According to previous studies, we consider that the poor repeatability may be a dominant factor that limits the diagnostic performance of the bi-exponential diffusion model (29). However, other studies argued that the bi-exponential model outperforms the mono-exponential model in the detection and stratification of PCa (11,14). In view of this apparent contradiction, a meta-analysis is warranted to compare the performance of the bi-exponential and mono-exponential diffusion models for evaluating PCa aggressiveness. Based on the evidence of our study, we recommend that the widely applied and easily calculated mean ADC value derived from the mono-exponential model evaluate PCa aggressiveness.
The bi-exponential diffusion model has two more parameters (D* and f) than the conventional mono-exponential model. Our study showed that all the histogram metrics of D* had no correlations with GS of PCa. In addition, among the histogram metrics of f, only the maximum value and skewness were significantly correlated with GS. However, their diagnostic efficacies were lower than those of the 90th and 75th percentiles of D in differentiating LG from HG PCa. Similarly, Zhang et al. reported that all the histogram metrics of D* and f showed no statistically significant correlations with GS (14). We speculate that their inherent measurement error and poor repeatability limited the diagnostic performance of D* and f (30,31). In our study, all skewness and kurtosis values of ADC, D, D*, and f had rather low correlation coefficients and did not show significant differences between LG and HG PCa. This variation in skewness and kurtosis values is in agreement with the studies performed by Donati et al. (2) and Liu et al. (24) but inconsistent with that of Zhang et al. (14). A recent study by Tristan Barrett et al. found that advanced measures of heterogeneity such as histogram skewness had poor repeatability (32). Their results may explain the limited diagnostic performance of skewness and kurtosis values in our study. Thus, further investigations or large-sample studies are warranted.
This study has certain limitations. First, we only included patients who had undergone RP, which may cause selection bias, and this small sample cannot represent the characteristics of all PCa patients. Second, regions of interest (ROIs) were drawn manually; thus, the accuracy is largely related to the observers’ personal experience and may lead to measurement error. In this study, the ROIs were confirmed by two experienced observers in consensus, which may decrease the experience dependence. Third, we did not separately evaluate peripheral-zone PCa and transitional-zone PCa due to the small number of cases of transitional-zone PCa. Fourth, a small number of GS ≤ 3 + 3 tumors were included, which may bias the results. The incidence of GS ≤ 3 + 3 tumors is normally much higher. However, most GS ≤ 3 + 3 tumors belong to the low-risk or very-low-risk category and cannot be diagnosed at this stage because prostate-specific antigen screening is not very common in our country. This limitation was also illustrated in a previous study by Zhang et al., in which only 5/59 patients were GS ≤ 3 + 3 (33). Finally, the ADC maps were generated from multi-b-value data rather than two b-values. Although additional b-values may provide more accurate ADC calculations, the multi-b-value protocol is time-consuming.
In conclusion, the bi-exponential model was not superior to the mono-exponential diffusion model for evaluating PCa aggressiveness. The histogram metrics did not outperform the conventional mean value. The widely applied and easily calculated mean ADC value derived from mono-exponential model is recommended to evaluate PCa aggressiveness.
Footnotes
Declaration of conflicting interests
The author(s) declared no potential conflicts of interest with respect to the research, authorship, and/or publication of this article.
Funding
The author(s) disclosed receipt of the following financial support for the research, authorship, and/or publication of this article: This study was supported by the National Natural Science Foundation of China (Grant Nos. 81671656 and 81801668).