



Abstract
Background
T2 mapping has been proven to be useful in tumor characterization. As to orbital masses, its diagnostic value needs to be investigated.
Purpose
To evaluate the usefulness of T2 mapping in orbital masses and the ability of T2 relaxation time in differentiating malignant from benign orbital masses.
Material and Methods
Forty-seven patients with solid orbital masses (33 benign and 14 malignant) who underwent T2 mapping examination for preoperative assessment were enrolled in the current study. T2 mapping was acquired using 16 TE values (range 12–192 ms; delta TE 12 ms). Mean T2 relaxation time was calculated based on the whole mass region of interest and compared between the malignant and benign groups using the unpaired t-test. Receiver operating characteristic curve analysis was adopted to calculate its diagnostic value.
Results
Malignant orbital masses showed significantly lower T2 relaxation time than benign masses (76.4 ± 13.0 ms vs. 119.1 ± 20.4 ms; P < 0.001). If setting a T2 relaxation time of 89.5 ms as the threshold value, optimal differentiating performance could be achieved (area under the curve 0.936; sensitivity 100.0%; specificity 87.9%; accuracy 91.5%; positive predictive value 77.8%; negative predictive value 100%).
Conclusion
T2 mapping and its derived T2 relaxation time could provide quantitative information and serve as a supplementary imaging marker for differentiating malignant from benign orbital masses.
Introduction
A wide spectrum of benign and malignant masses can be seen in the orbit. Accurate differentiation of orbital malignant from benign tumors is an important determinant of clinical decision-making (1,2). Conventional structural computed tomography (CT) and magnetic resonance imaging (MRI) mainly evaluate the morphological properties of orbital masses. Although some imaging features on structural CT and MRI—such as bone destruction, tumor margin, tumor shape, T2 signal intensity, and T2 homogeneity—are reported to be useful to predict orbital malignancy, they are limited by the subjectivity and consequent unsatisfactory reproducibility of the observer (3,4). Therefore, an objective and functional MRI technique is needed for evaluating the biological properties of orbital masses and improving the differentiating performance.
Recently, T2 mapping, which is obtained by acquiring images of the same slice at multiple echo times with a pixel-by-pixel fitting of the T2 relaxation curve, has been attracting more and more attention (5–9). Tissue composition of investigated structures, particularly the water content, can be characterized by T2 relaxation times without application of intravenous contrast material (5–7). Quantification of T2 relaxation times has been proven to be useful in the tumor characterization of prostate, breast, and liver lesions (7–10). With regard to the orbit, Xian et al. (3) reported that iso-intense on T2-weighted (T2W) imaging was the most predictive characteristic of orbital malignancy; however, it was a semi-quantitative approach based on visual interpretation. To the best of our knowledge, no study has reported the application of T2 mapping in orbital masses till now.
Therefore, the purpose of this study is to evaluate the diagnostic ability of T2 mapping and derived T2 relaxation time in differentiating malignant from benign orbital masses.
Material and Methods
Patients
This retrospective study was approved by the institutional review board in our hospital and written informed consent was waived. Between February 2018 and December 2018, 56 consecutive patients with orbital masses who underwent orbital MRI for pre-treatment assessment were identified by the retrospective review of our hospital database. We excluded nine patients in accordance with the following inclusion criteria: (i) completely cystic lesions (n = 6); (ii) lack of T2 mapping (n = 2); and (iii) inadequate image quality (n = 1). Finally, 47 patients (20 men, 27 women; mean age = 51.8 ± 11.9 years; age range = 25–82 years) were enrolled in the study. All the diagnoses were made based on surgical histopathology.
Image technique
A MAGNETOM Skyra 3-T MR scanner (Siemens, Erlangen, Germany) with a 12-channel head and neck coil was used for MRI scan. Routine orbital MRI protocols included: T1-weighted (T1W) imaging in transverse plane; T2W imaging in transverse, coronal, and sagittal planes; and contrast-enhanced T1W imaging in transverse, coronal, and sagittal planes. T2 mapping was acquired using the modified multi-echo spin-echo sequence that implements both model-based accelerated relaxometry by iterative non-linear inversion (MARTINI) (11) and generalized autocalibrating partial parallel acquisition (GRAPPA) (12). This technique was named GRAPPATINI (13). The parameters were as follows: TR/TE = 2020/12–192 ms; delta TE = 12 ms; slice thickness = 3 mm without gap; slice number = 20; field of view = 200 × 200 mm; matrix = 240 × 240; in-plane voxel size = 0.6 × 0.6 mm; GRAPPA acceleration factor = 2; and MARTINI acceleration factor = 5. Scan duration for T2 mapping was 4 min 40 s.
Image analysis
Imaging data were processed using a workstation (Syngo, Siemens Healthcare, Erlangen, Germany). Standard equation for signal intensity was as follows:
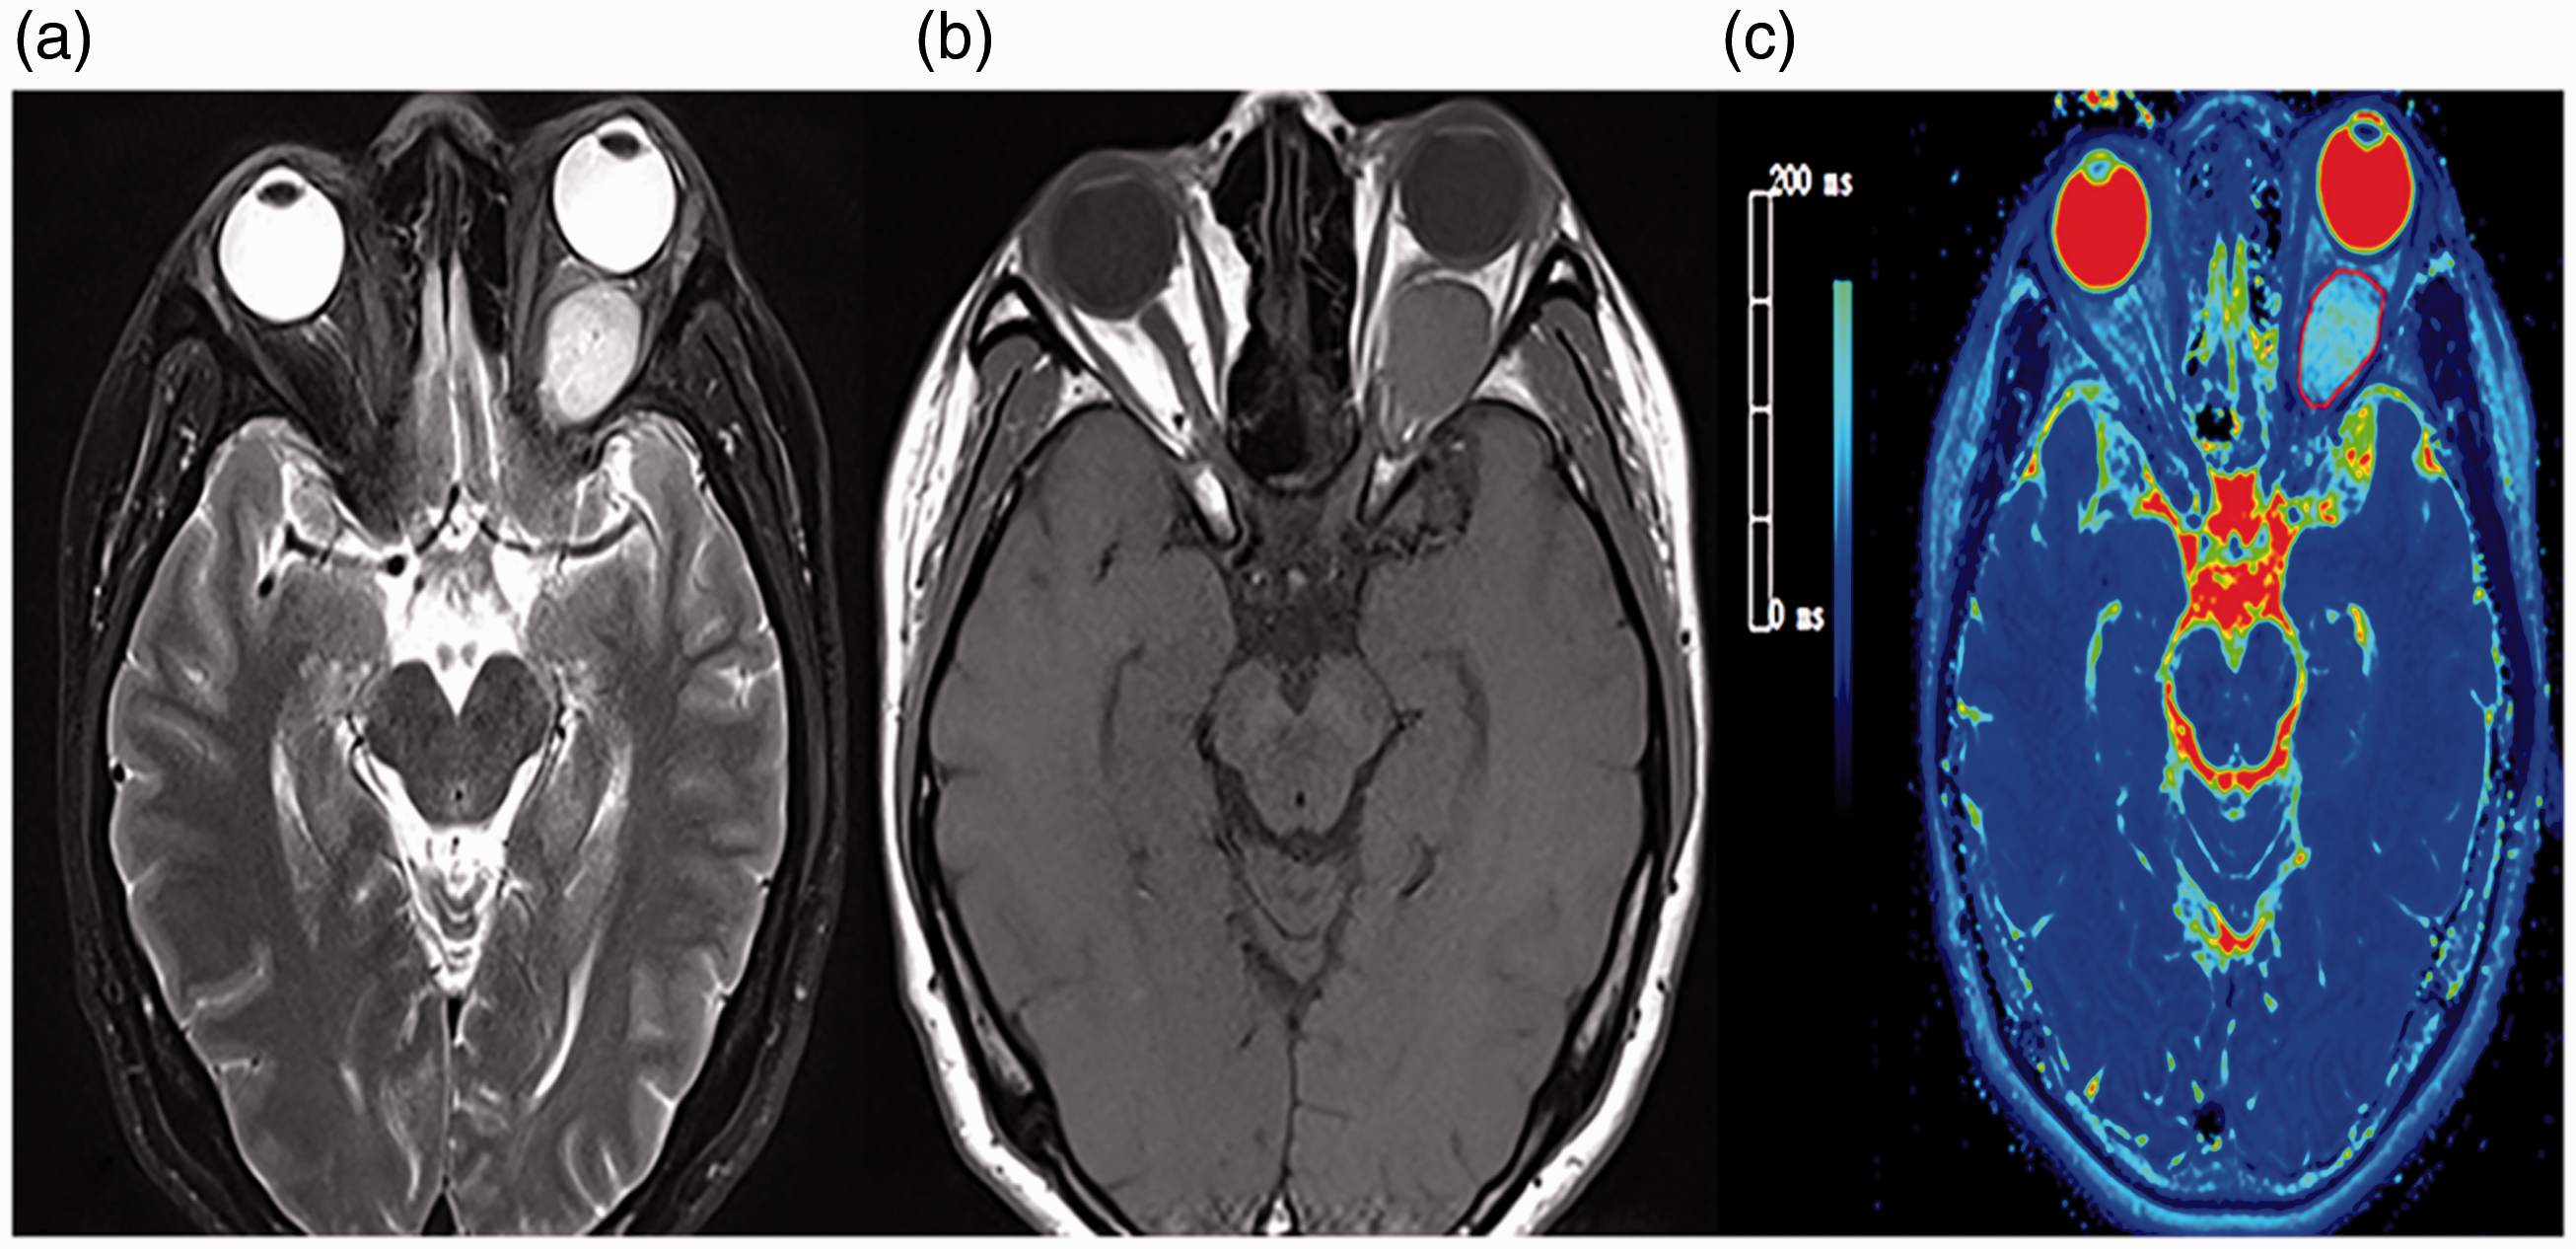
Schematic diagram of the placement of ROIs. With reference to the T2-weighted image (a) and contrast-enhanced T1-weighted image (b), ROIs were manually drawn in all T2 mapping slices covering the whole mass (c). ROI, region of interest.
Statistical analysis
Continuous variables were expressed as mean ± SD. The normality of continuous variable was assessed using Kolmogorov–Smirnov test. For normally distributed variables, unpaired t-test was employed to compare the differences between benign and malignant group; otherwise, the Mann–Whitney test was used. The distinction in gender between the two groups was evaluated using the chi-square test. Receiver operating characteristic (ROC) curve analysis was implemented to evaluate the diagnostic value of derived T2 relaxation time measurements in predicting orbital malignancy. Cut-off value for the optimal differentiation was determined by maximizing the Youden index (sensitivity + specificity – 1). Inter-reader reproducibility of quantitative measurement was evaluated using the intraclass correlation coefficient (ICC) with 95% confidence interval (CI). ICC was interpreted as follows: <0.40 = poor; 0.41–0.60 = moderate; 0.61–0.80 = good; ≥0.81 = excellent (14). All statistical analyses were performed using two statistical packages (SPSS v.23.0, SPSS, Chicago, IL, USA; MedCalc v.15.0, MedCalc, Mariakerke, Belgium). P < 0.05 was considered statistically significant.
Results
The 47 patients included 33 patients with benign lesions (10 men, 23 women; mean age = 49.7 ± 10.5 years; age range = 25–68 years) and 14 patients with malignant lesions (10 men, 4 women; mean age = 56.8 ± 13.8 years; age range = 38–82 years). There was no significant difference in patient age between the benign and malignant groups (P = 0.059), while the malignant group showed a significant male propensity (P = 0.009). Detailed demographics and final diagnoses of our study cohort are summarized in Table 1.
Demographic and final diagnoses of our study population
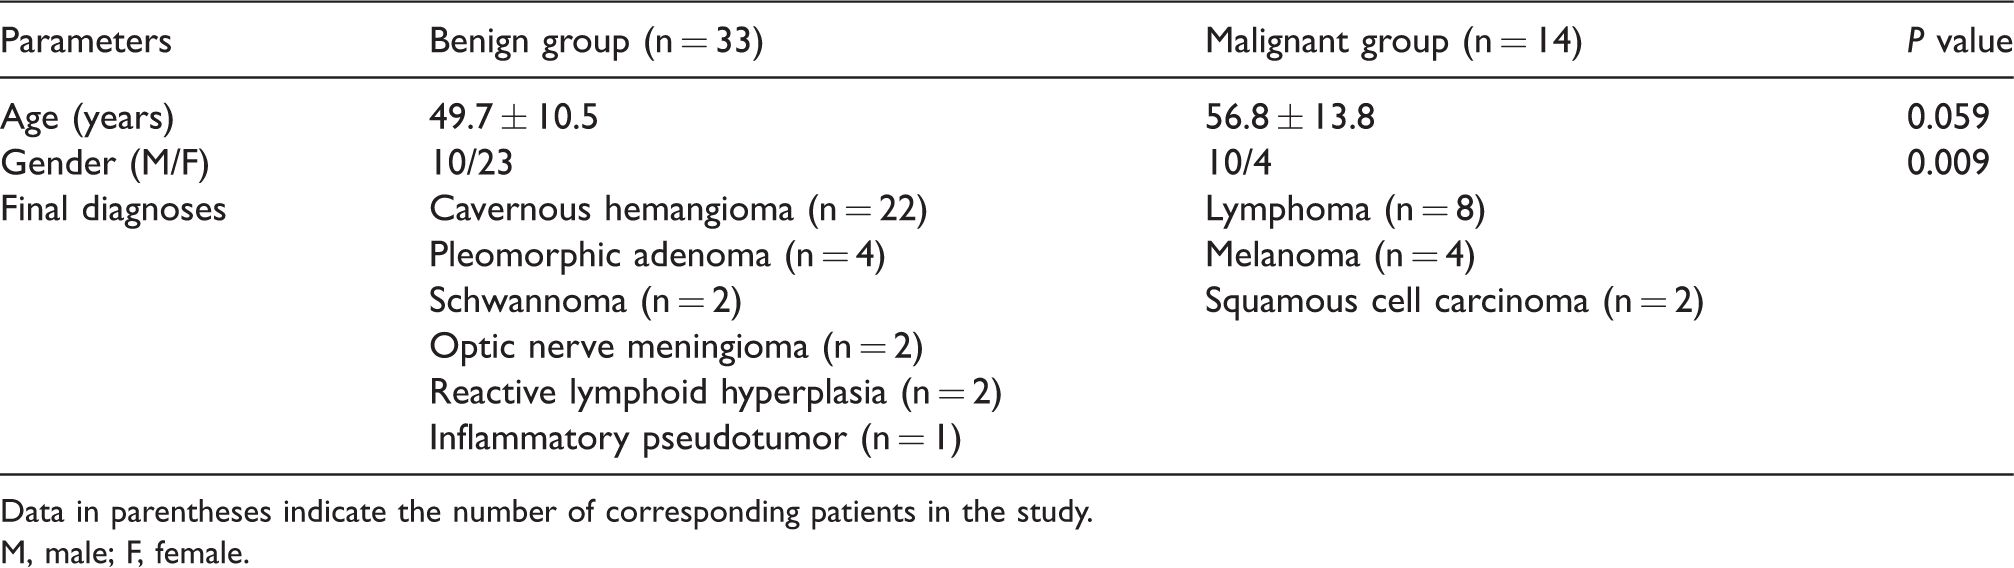
Data in parentheses indicate the number of corresponding patients in the study.
M, male; F, female.
The mean T2 relaxation time of malignant orbital tumors was 76.4 ± 13.0 ms, which was significantly lower than benign tumors (119.1 ± 20.4 ms) (P < 0.001). Detailed T2 relaxation times of the orbital tumors within each type are displayed in Table 2. ROC curve analysis yielded a cut-off T2 relaxation time value of 89.5 ms for differentiating malignant from benign orbital masses, with an area under the curve (AUC) of 0.936, a sensitivity of 100.0%, a specificity of 87.9%, and an accuracy of 91.5% (Fig. 2). Representative images of orbital pleomorphic adenoma, lymphoma, inflammatory pseudotumor, reactive lymphoid hyperplasia, and optic nerve meningioma are shown in Fig. 3.
Detailed T2 relaxation times of the orbital tumors within each type.

Data in parentheses indicate the number of corresponding patients.

ROC curve of the T2 relaxation time for discriminating malignant from benign orbital masses. The AUC was 0.936, with a sensitivity of 100.0% and a specificity of 87.9% when setting the threshold value of 89.5 ms. ROC, receiver operating characteristic; AUC, area under ROC curve.
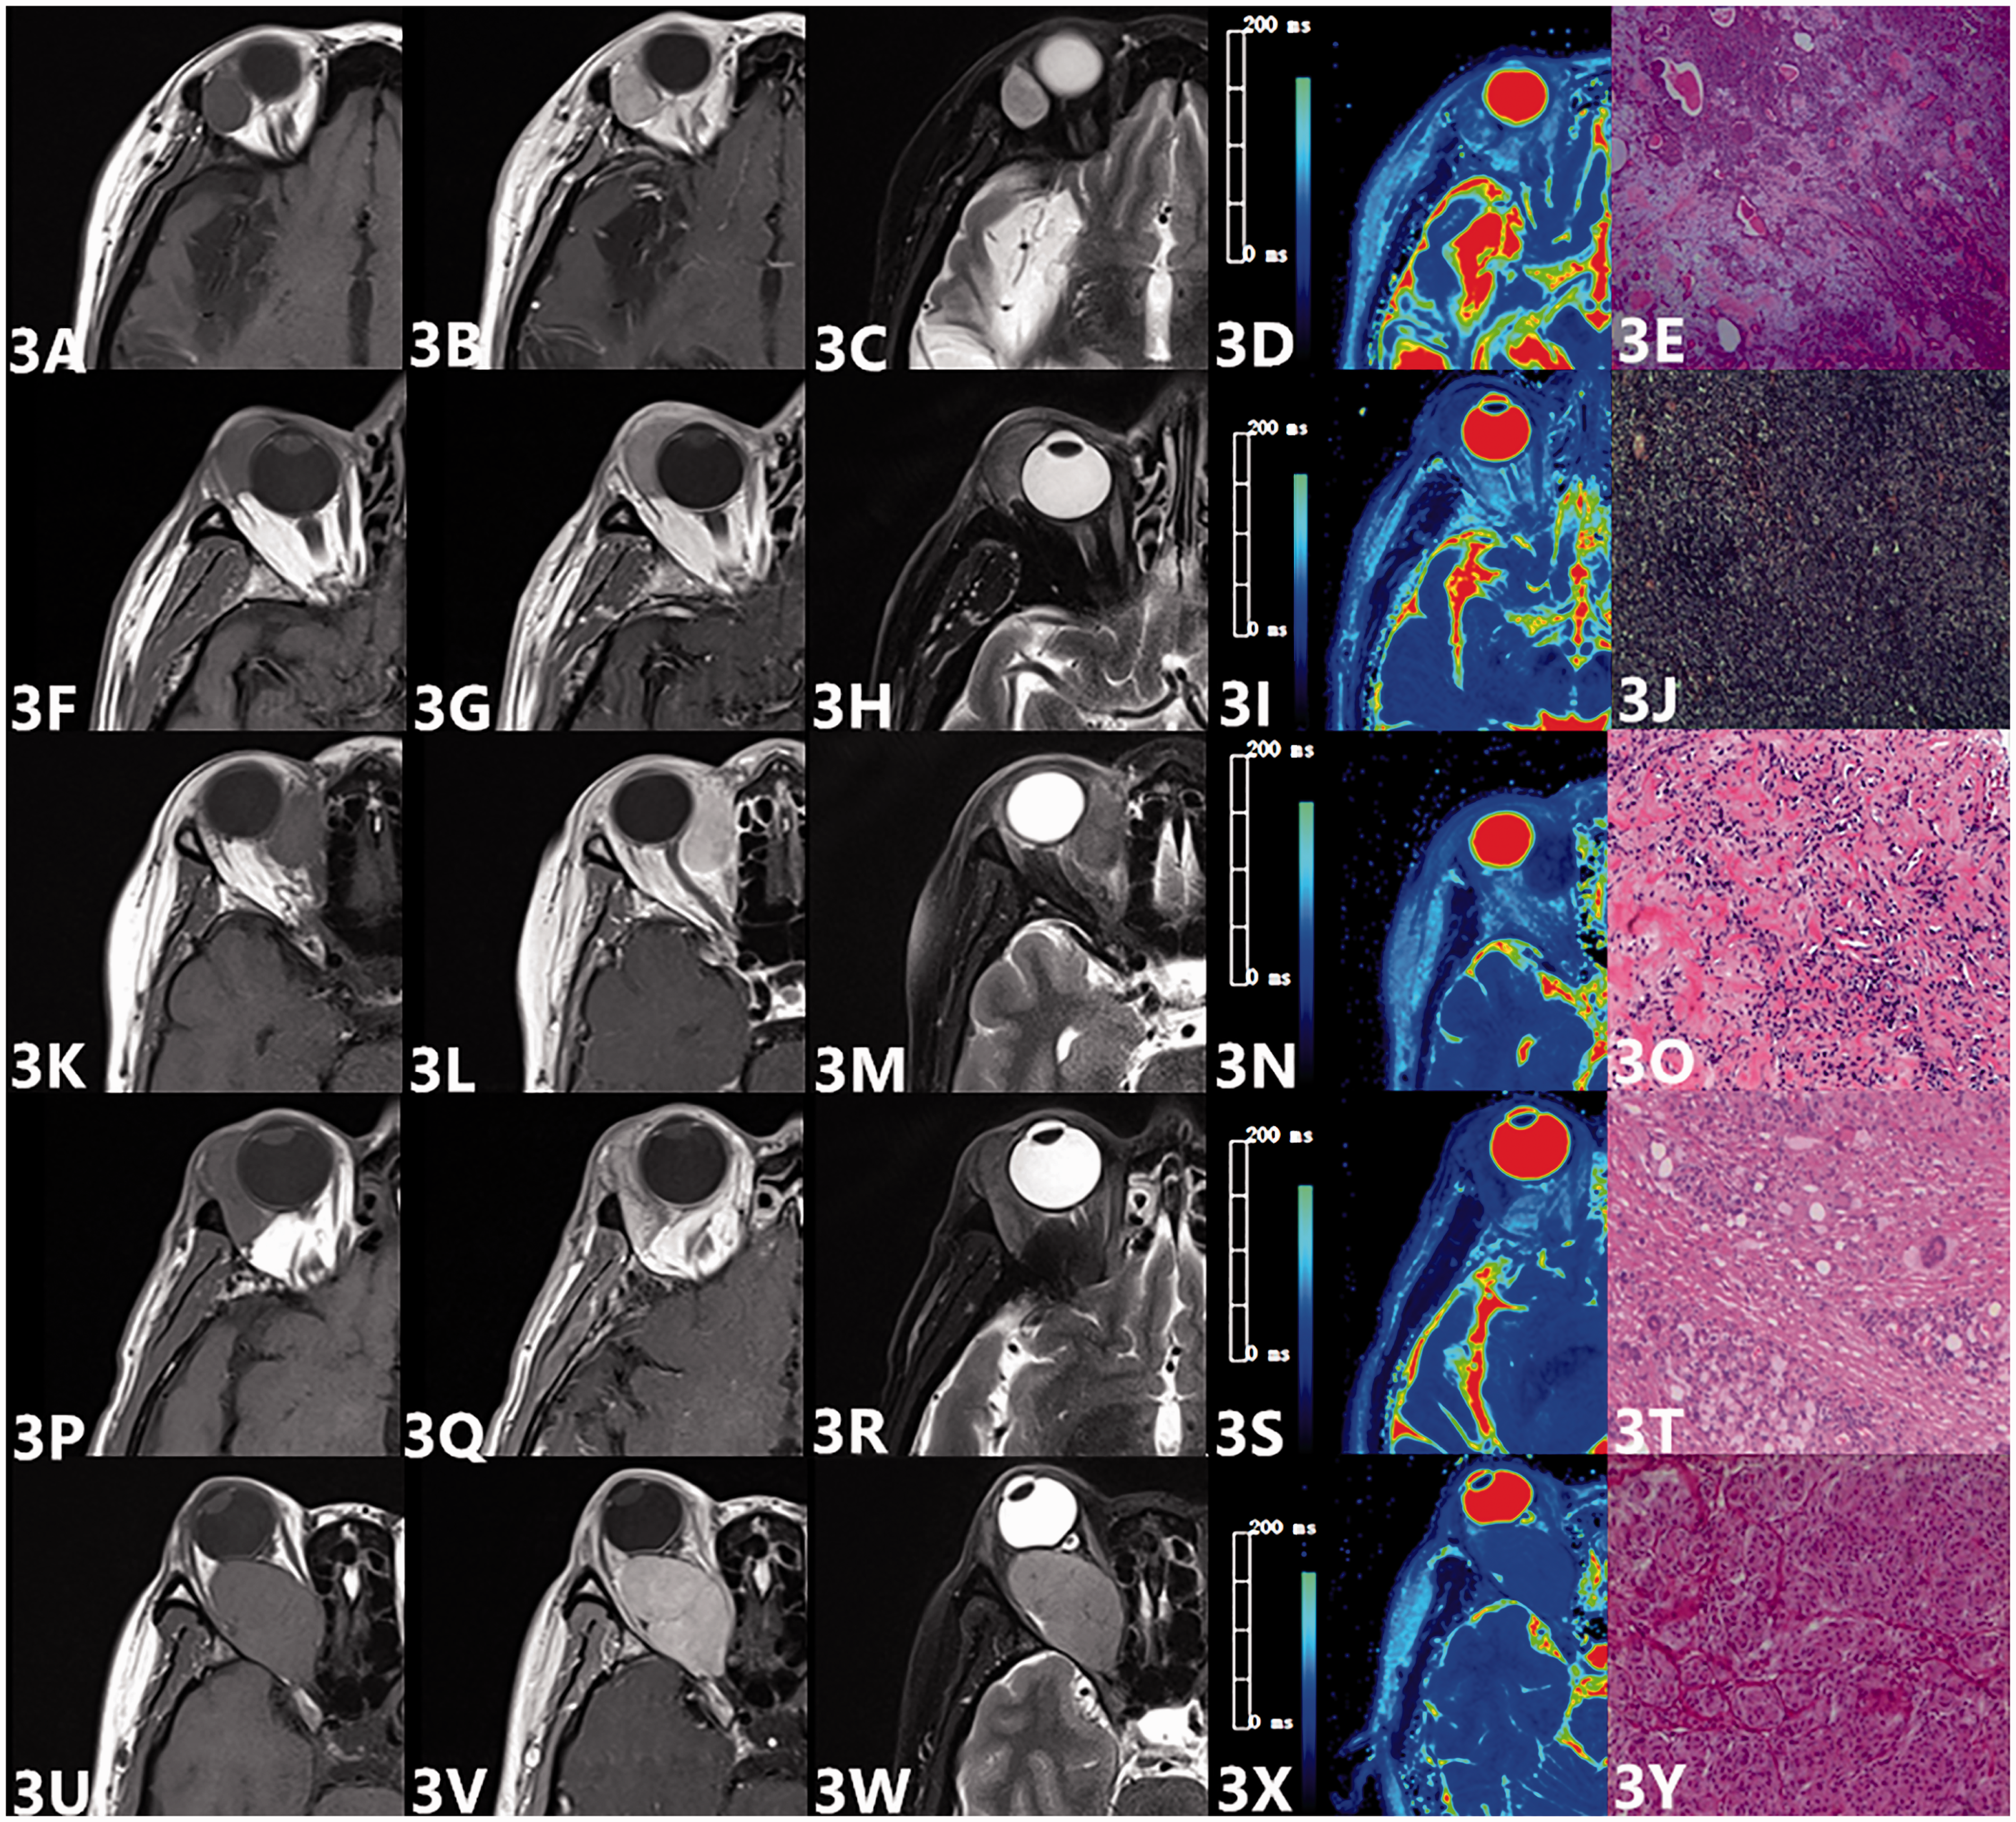
Representative images of a 41-year-old woman with orbital pleomorphic adenoma (a–d), a 65-year-old man with orbital lymphoma (f–i), a 52-year-old woman with orbital pseudotumor (k–n), a 67-year-old man with reactive lymphoid hyperplasia (p–s), and a 51-year-old woman with optic nerve meningioma (u–x). The first, second, third, and fourth column is the T1-weighted, contrast-enhanced T1-weighted, T2-weighted, and T2 mapping, respectively. T2 relaxation time was 112.1, 77.9, 64.5, 69.6, and 86.3ms, respectively. All the diagnoses were confirmed by pathological examination (HE×100) (e, j, o, t, y).
There was excellent inter-reader agreement in the measurement of T2 relaxation time (ICC = 0.979; 95% CI = 0.962–0.988). The Bland–Altman plot for the measurement of the T2 relaxation time is shown in Fig. 4.
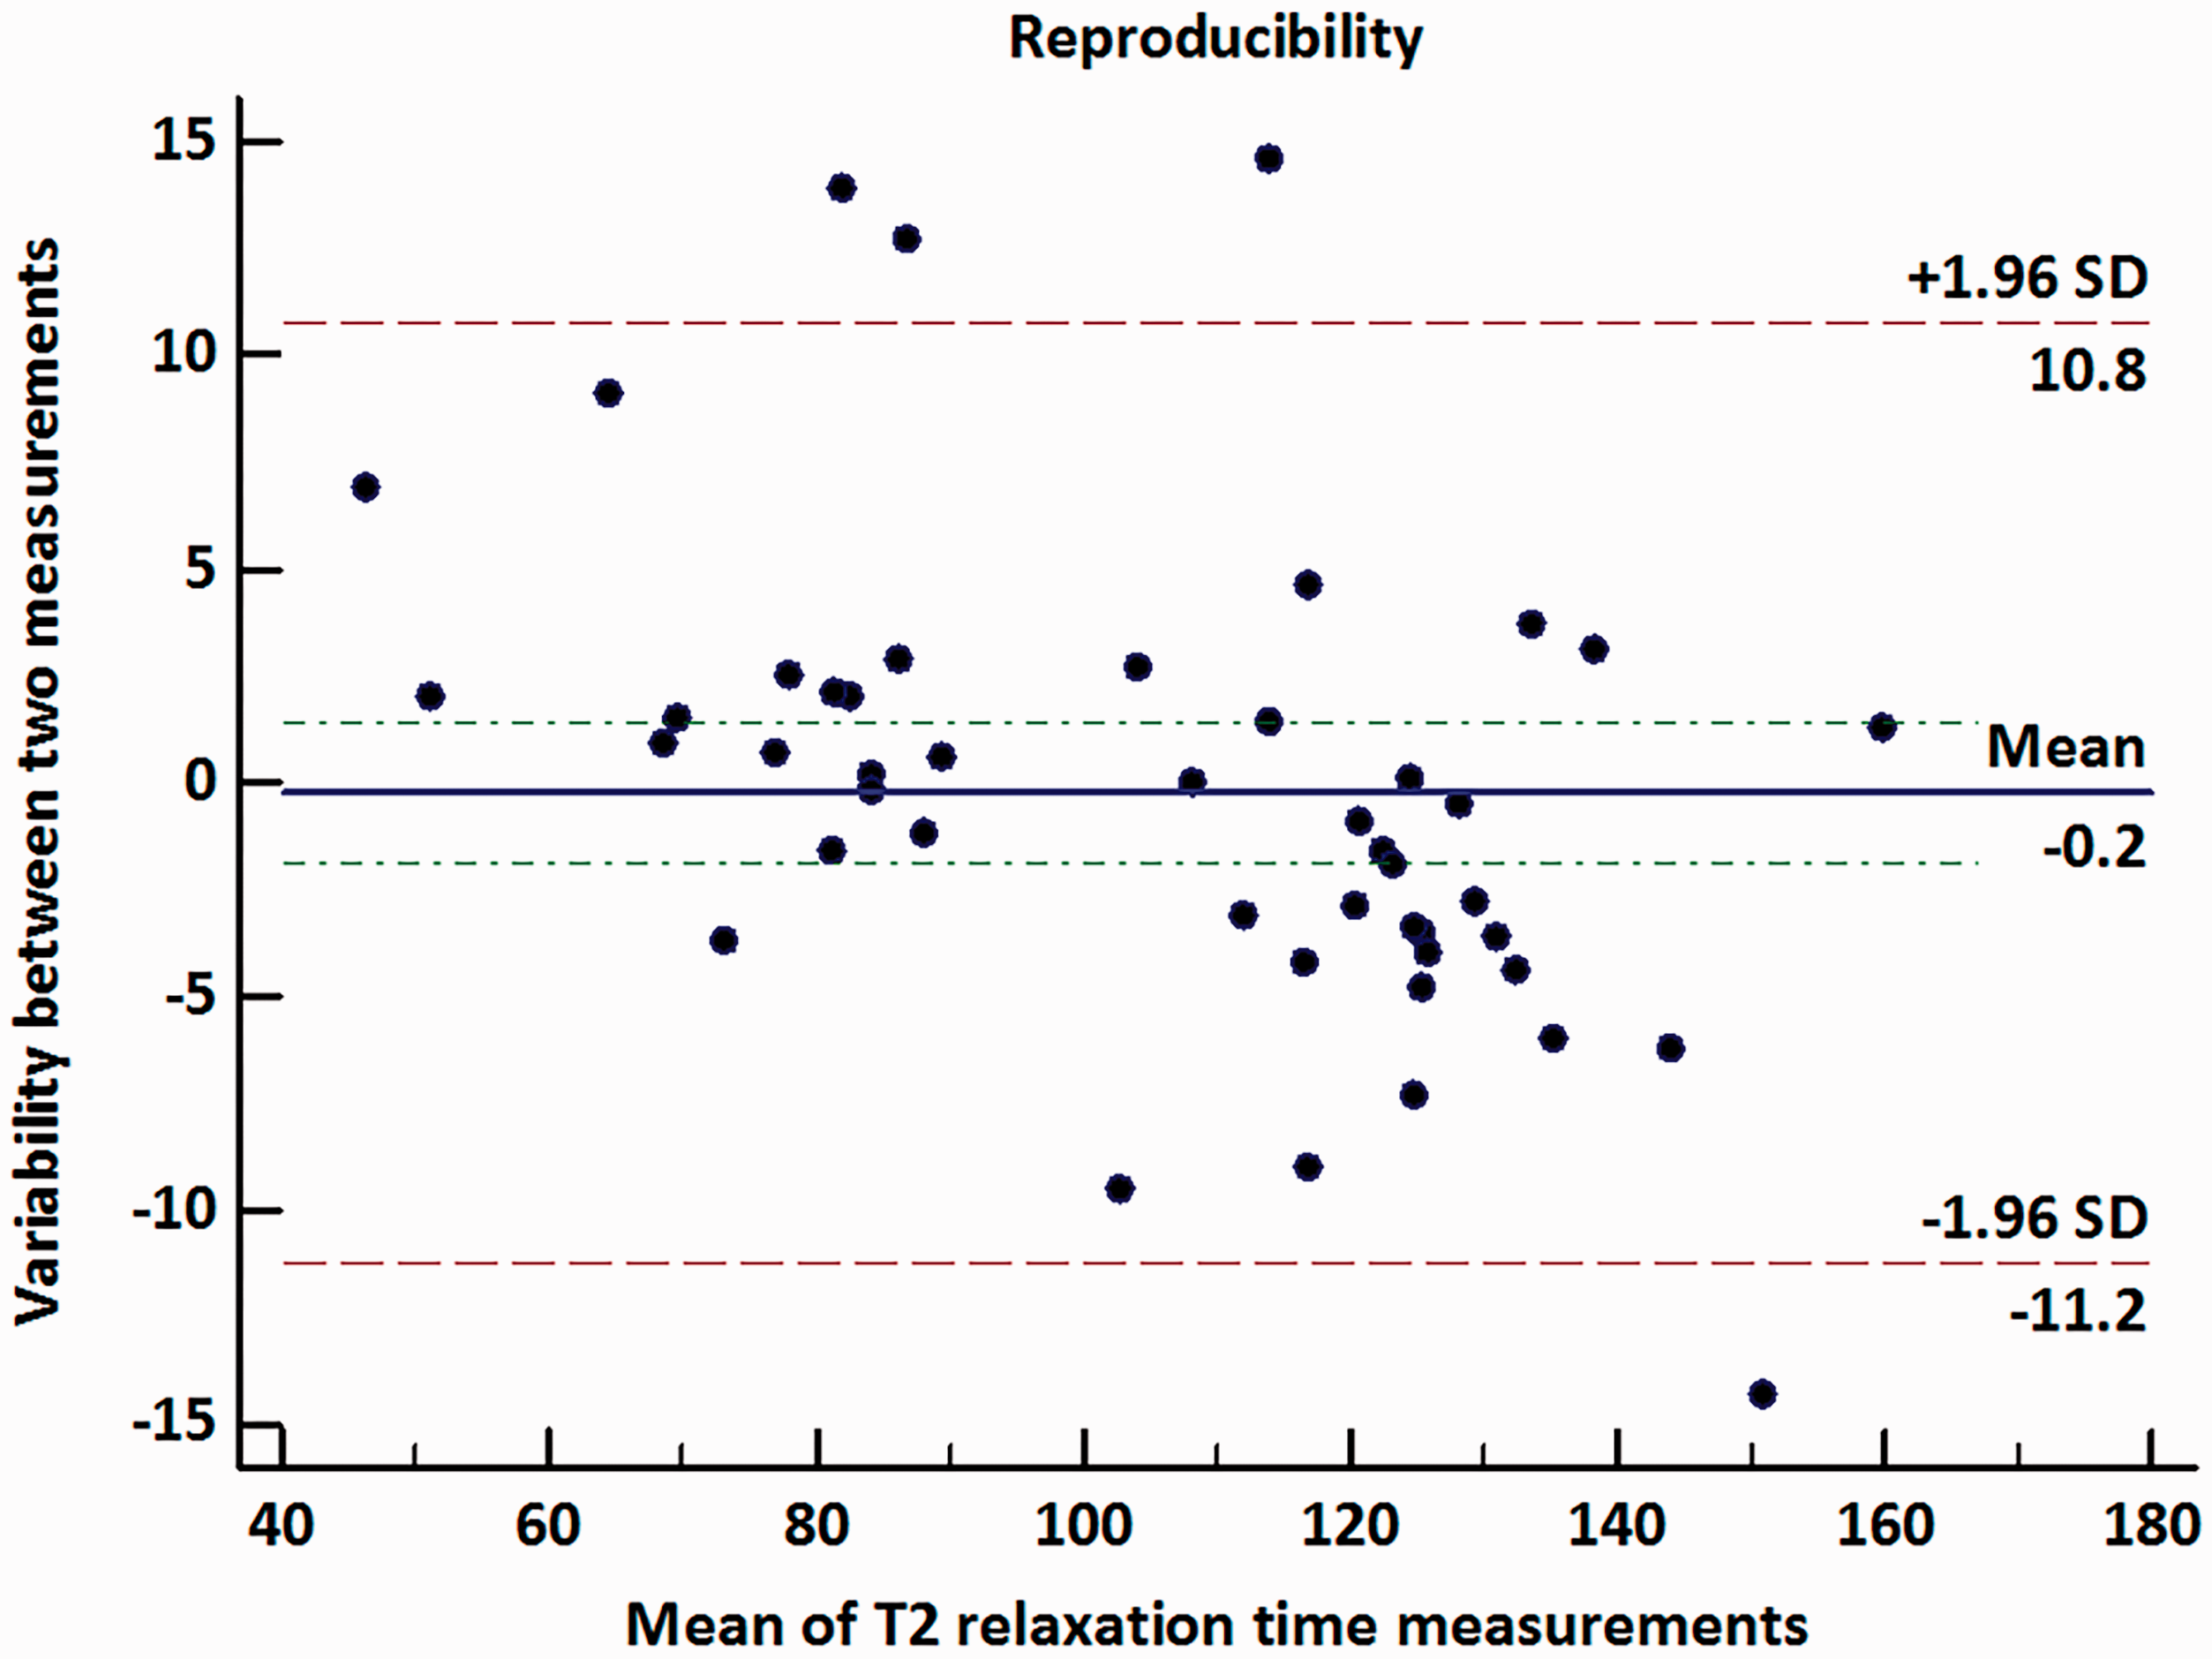
Bland–Altman plot showed reproducibility of measurements for T2 relaxation time. Blue line stands for mean absolute difference. Green lines mean confidence interval of mean difference. Red lines represent 95% confidence interval of mean difference.
Discussion
Our study investigated the T2 relaxation times of different types of orbital masses and revealed that orbital malignancy possessed lower T2 relaxation times than benignancy. Satisfactory differential diagnostic ability of T2 relaxation time in orbital masses can be seen in this preliminary study through ROC curve analysis.
As a quantitative MRI technology, T2 mapping can assess the microenvironment of investigated tissues through T2 decay curve and specific T2 relaxation time, which is measured at different echo times in an echo train. T2 relaxation time can be affected by many factors including tissue water content, macromolecules, tissue fat content, iron, and the existence of paramagnetic particles. Among these factors, water content plays the most important role (6,15). There are two states of water molecule existing in the body, including free and bound water. As is well-known, free water molecules move more freely leading to faster rotational motion; therefore, the increase of tissue free water molecules can result in the obvious prolongation of T2 relaxation time (15–17).
Previously, T2 mapping was widely used in detecting and evaluating the degree of tissue edema in inflammatory and ischemic processes as well as degeneration of bones and joints (18–20). In terms of differentiating malignant from benign lesions, studies had examined its potential value on the tumors involved prostate, breast, and liver, and positive results were obtained (7–10). In agreement with previous studies, our study also found that orbital malignancy manifested lower T2 relaxation time than benignancy. The malignancy tend to have more compacted cells and higher ratio of nucleus to cytoplasm (N/C); thus, the intracellular and extracellular water would be certain to decrease. It was not surprising then that malignancy would show a lower T2 relaxation time than benign tumors.
In our study, all malignant lesions showed low T2 relaxation times; however, not all benign lesions had high T2 relaxation times. Three lymphoproliferative disorders (one inflammatory pseudotumor and two reactive lymphoid hyperplasias) demonstrated relatively low T2 relaxation times, which were 64.5 ms, 69.6 ms, and 84.2 ms, respectively. Similarly, Haradome et al. (21) reported that two benign orbital lymphoproliferative disorders showed hypo-intensity on T2W imaging. We speculated that proliferation of fibrous tissues characterized in the chronic process of lymphoproliferative disorders led to the absolute amount of free water decreased; therefore, T2 relaxation time would naturally decrease (21,22). In addition, our study cohort included two cases of optic nerve meningioma and their T2 relaxation times were 116.6 ms and 86.3 ms, respectively. Previous studies reported that optic nerve meningioma usually showed iso-intensity or hyper-intensity on T2W imaging (1,23). Then, it was not difficult to understand that the T2 relaxation time of a meningioma could be 116.6 ms. However, the T2 relaxation time of another meningioma was 86.3 ms, which was different from our expectation. We speculated that the compacted cells arranged in tumor nests, especially the epithelial type, may account for the relatively low T2 relaxation time in the later case (24).
The present study had some limitations. First, some lesions with typical MRI features (e.g. cavernous hemangioma and melanoma) were not excluded. Second, we did not correspond all our results with the pathological examination. Third, some other functional MRI techniques, such as diffusion-weighted imaging and dynamic contrast-enhanced MRI, were not investigated simultaneously. Forth, the overestimation of T2 relaxation time caused by the radio frequency field imperfections on account of the usage of the multi-echo spin-echo sequence could not be ignored (13). Further investigations focused on the radiological indeterminate orbital masses using multiple functional MRI techniques within a larger study population are needed to confirm our study results.
In conclusion, T2 mapping and its derived T2 relaxation time showed excellent diagnostic value in differentiating malignant from benign orbital masses. It could provide more added information in microcosmic constitution of orbital lesions and serve as a supplementary imaging marker for the tumor differentiation.
Footnotes
Acknowledgements
The authors acknowledge members of the Siemens group, Tobias Kober, Yi-Cheng Hsu, and Yi Sun, for their advice and expertise in T2 mapping technology.
Declaration of conflicting interests
The author(s) declared no potential conflicts of interest with respect to the research, authorship, and/or publication of this article.
Funding
The author(s) received no financial support for the research, authorship, and/or publication of this article.