




Abstract
Background
It has been demonstrated that the number of metastatic axillary lymph nodes (mALNs) influence disease-free and overall survival in patients with breast cancer.
Purpose
To determine if the ALN size is more accurate than the ALN apparent diffusion coefficient (ADC) value to predict metastatic involvement in newly diagnosed breast cancer.
Material and Methods
A total of 44 patients with breast cancer were included. Magnetic resonance imaging (MRI) examinations were performed on a 1.5-T system with sagittal T1-weighted fast spin-echo non-fat saturated, sagittal T2-weighted fast spin-echo non-fat saturated, axial diffusion-weighted imaging echo-planar (b values of 0 and 700 s/mm2), and non-contrast axial VIBRANT sequences. The size and the ADC value were obtained for ALN ipsilateral and contralateral to breast cancer. The reference standard was the histopathologic lymph node status.
Results
mALN had a greater cortical thickness compared to contralateral non-mALN (10.3 ± 5.32 mm vs. 4 ± 1.17 mm, P ≤ 0.001). The threshold of ≥6.7 mm for predicting axillary metastatic involvement had a sensitivity and a specificity of 80.0% and 97.7%, respectively. The ADC value of mALN was significantly higher than the contralateral non-mALN (0.90 ± 0.12 × 10⁻³mm2/s vs. 0.78 ± 0.12 × 10⁻³mm2/s; P = 0.001). The threshold of ≥0.86 × 10⁻³mm2/s had a sensitivity and a specificity of 66.7% and 76.7%, respectively.
Conclusion
Our results indicate that the cortical thickness has a better diagnostic performance in the differentiation of metastatic and non-metastatic lymph nodes than the lymph node ADC.
Keywords
Introduction
Since the 1980s, it has been demonstrated that the number of metastatic axillary lymph nodes (mALN) influence disease-free and overall survival in patients with early breast cancer (1). For many years, the axillary lymph node dissection (ALND) was the gold standard procedure for both LN staging and local disease control (2). However, the evolution of axillary surgery has been modified to a staging role, leaving radical axillary surgical dissection in cases with locally advanced breast cancer or bulky disease (3). The sentinel lymph node biopsy (SLNB) is the accepted procedure for accurate LN staging, leaving radical ALND for patients with confirmed LN metastasis (4–6).
For a long time, the preoperative evaluation of the ALN was based on clinical examination; however, the accuracy of this method was low, since up to 40% of the patients with negative clinical examination have metastases (7, 8) and 30% of the patients with palpable nodes have a result of negative LN (7). Metastatic cancer cells reach the LN by afferent lymphatic channels that drain into subcapsular space and cortical sinusoids (9). Metastatic cell growth produces cortex thickening and eventually progresses to complete obliteration of the hilum. In addition, metastatic involvement tends to increase disproportionately to the minor axis of the LN, producing a spherical morphology (10). These changes can be evaluated by imaging. Ultrasound is the most common method used for axillary evaluation in breast cancer. However, it is an operator-dependent evaluation with a diagnostic accuracy that depends on the morphological criteria used (11).
In the field of magnetic resonance imaging (MRI), Luciani et al. (12) and Arslan et al. (13) reported that the minor axis of the ALN is a good parameter to differentiate between mALN and non-mALN. Diffusion-weighted imaging (DWI) is a non-contrasted MRI sequence that provides a quantitative parameter of the isotropic diffusion of water in tissues, generally used for the characterization of breast masses (14). The role of DWI in the evaluation of LN, has been explored by different authors like Scaranelo et al. (15) and Razek et al. (16).
Scaranelo et al. (15) found that the mALN have lower values of the apparent diffusion coefficient (ADC) than non-mALN (15). Other studies have presented similar results (17–19). However, other investigators have found that mALN have higher ADC values than benign LN (20), and others found no significant difference between the ADC value of benign and metastatic LN (21, 22).
To our knowledge, the uniqueness of this study is that it demonstrates differences in size and ADC value between the ALN ipsilateral to the tumor against the contralateral LN in patients with breast cancer. The main aim of the present study was to determine whether the ALN size is more accurate than the ALN ADC value to predict metastatic involvement in newly diagnosed breast cancer, determined by the gold standard of histopathology.
Material and Methods
Patients
This prospective descriptive study was conducted in accordance with approval from the Ethics and Research Committee of the Hospital Universitario “Dr. José Eleuterio González”, in Monterrey, Mexico (registration code: RA15-002). All patients provided written informed consent. Patients not willing to participate or who were physically unable to tolerate the prone position needed for breast MRI were excluded.
A simple breast MRI was performed in 65 patients with breast cancer before a tumor or lymph node biopsy. The enrollment period was from February 2015 to November 2015.
Two patients with a diagnosis of bilateral breast cancer were eliminated as well as 10 patients with a history of previous contralateral breast cancer treated with mastectomy and axillary dissection. Nine patients whose imaging studies could not be recovered from the picture archiving and communication system (PACS) were also eliminated. A total of 44 patients were included.
MRI acquisition
Examinations were performed in the prone position on a 1.5-T MR system (EXCITE HDX-Y, General Electric, Wilmington, MA, USA), with a bilateral eight-channel breast coil. Our MRI protocol for this work was as follows: sagittal T1-weighted (T1W) fast spin-echo (FSE) non-fat saturated sequence; sagittal T2-weighted (T2W) FSE non-fat saturated sequence; axial DWI echo-planar sequence; and non-contrast axial VIBRANT sequence. DWI was performed using an axial echo-planar imaging sequence, with b values of 0 and 700 s/mm2; TR = 4825 ms (range = 3000–6000); TE = 87.9 ms; bandwidth = 62.5–250 MHz; matrix size = 128 × 128; field of view = 32 cm; slice thickness =3 mm; intersection gap = 0 mm. Total acquisition time was 12–15 min.
Post-processing: size and ADC measurements
All images were transferred to a workstation (IntelliSpace Portal version 7, Philips, Best, The Netherlands). We selected one LN in both axillae of each patient: ipsilateral and contralateral to breast cancer. In the ipsilateral axilla, the most suspicious LN of having metastasis (e.g. cortical thickening, obliteration of the fatty hilum, or mass appearance) was chosen; if there was no suspicious LN, the largest LN was selected. In the contralateral axilla, a normal morphology LN (with thin cortical and preservation of the fatty hilum) was selected.
The cortical thickness, the major axis, and the minor axis of the ALN were measured on the non-contrast axial VIBRANT sequence. In addition, we calculated a LN size ratio as follows: major axis/minor axis.
The DWI sequence was post-processed with a commercial software (MR Diffusion, Philips, Best, The Netherlands) to obtain ADC maps and ADC measurements.
To achieve standardized conditions for the analysis, our method for measuring the ADC consists of marking the region of interest (ROI) using three small ellipses (mean area = 6.1 mm2 with interval 3.3–11.7 mm2 for ipsilateral axilla; mean area = 5.1 mm2 with interval 2.3–8.7 mm2 for contralateral axilla) placed randomly at different sites in the cortex of the LN, trying to avoid the fatty hilum. Finally, the mean of the ADC of the three ROI measurement was obtained. Representative images are shown in Fig. 1. In addition, we calculated an ADC ratio as follows: ipsilateral ALN ADC/contralateral ALN ADC.
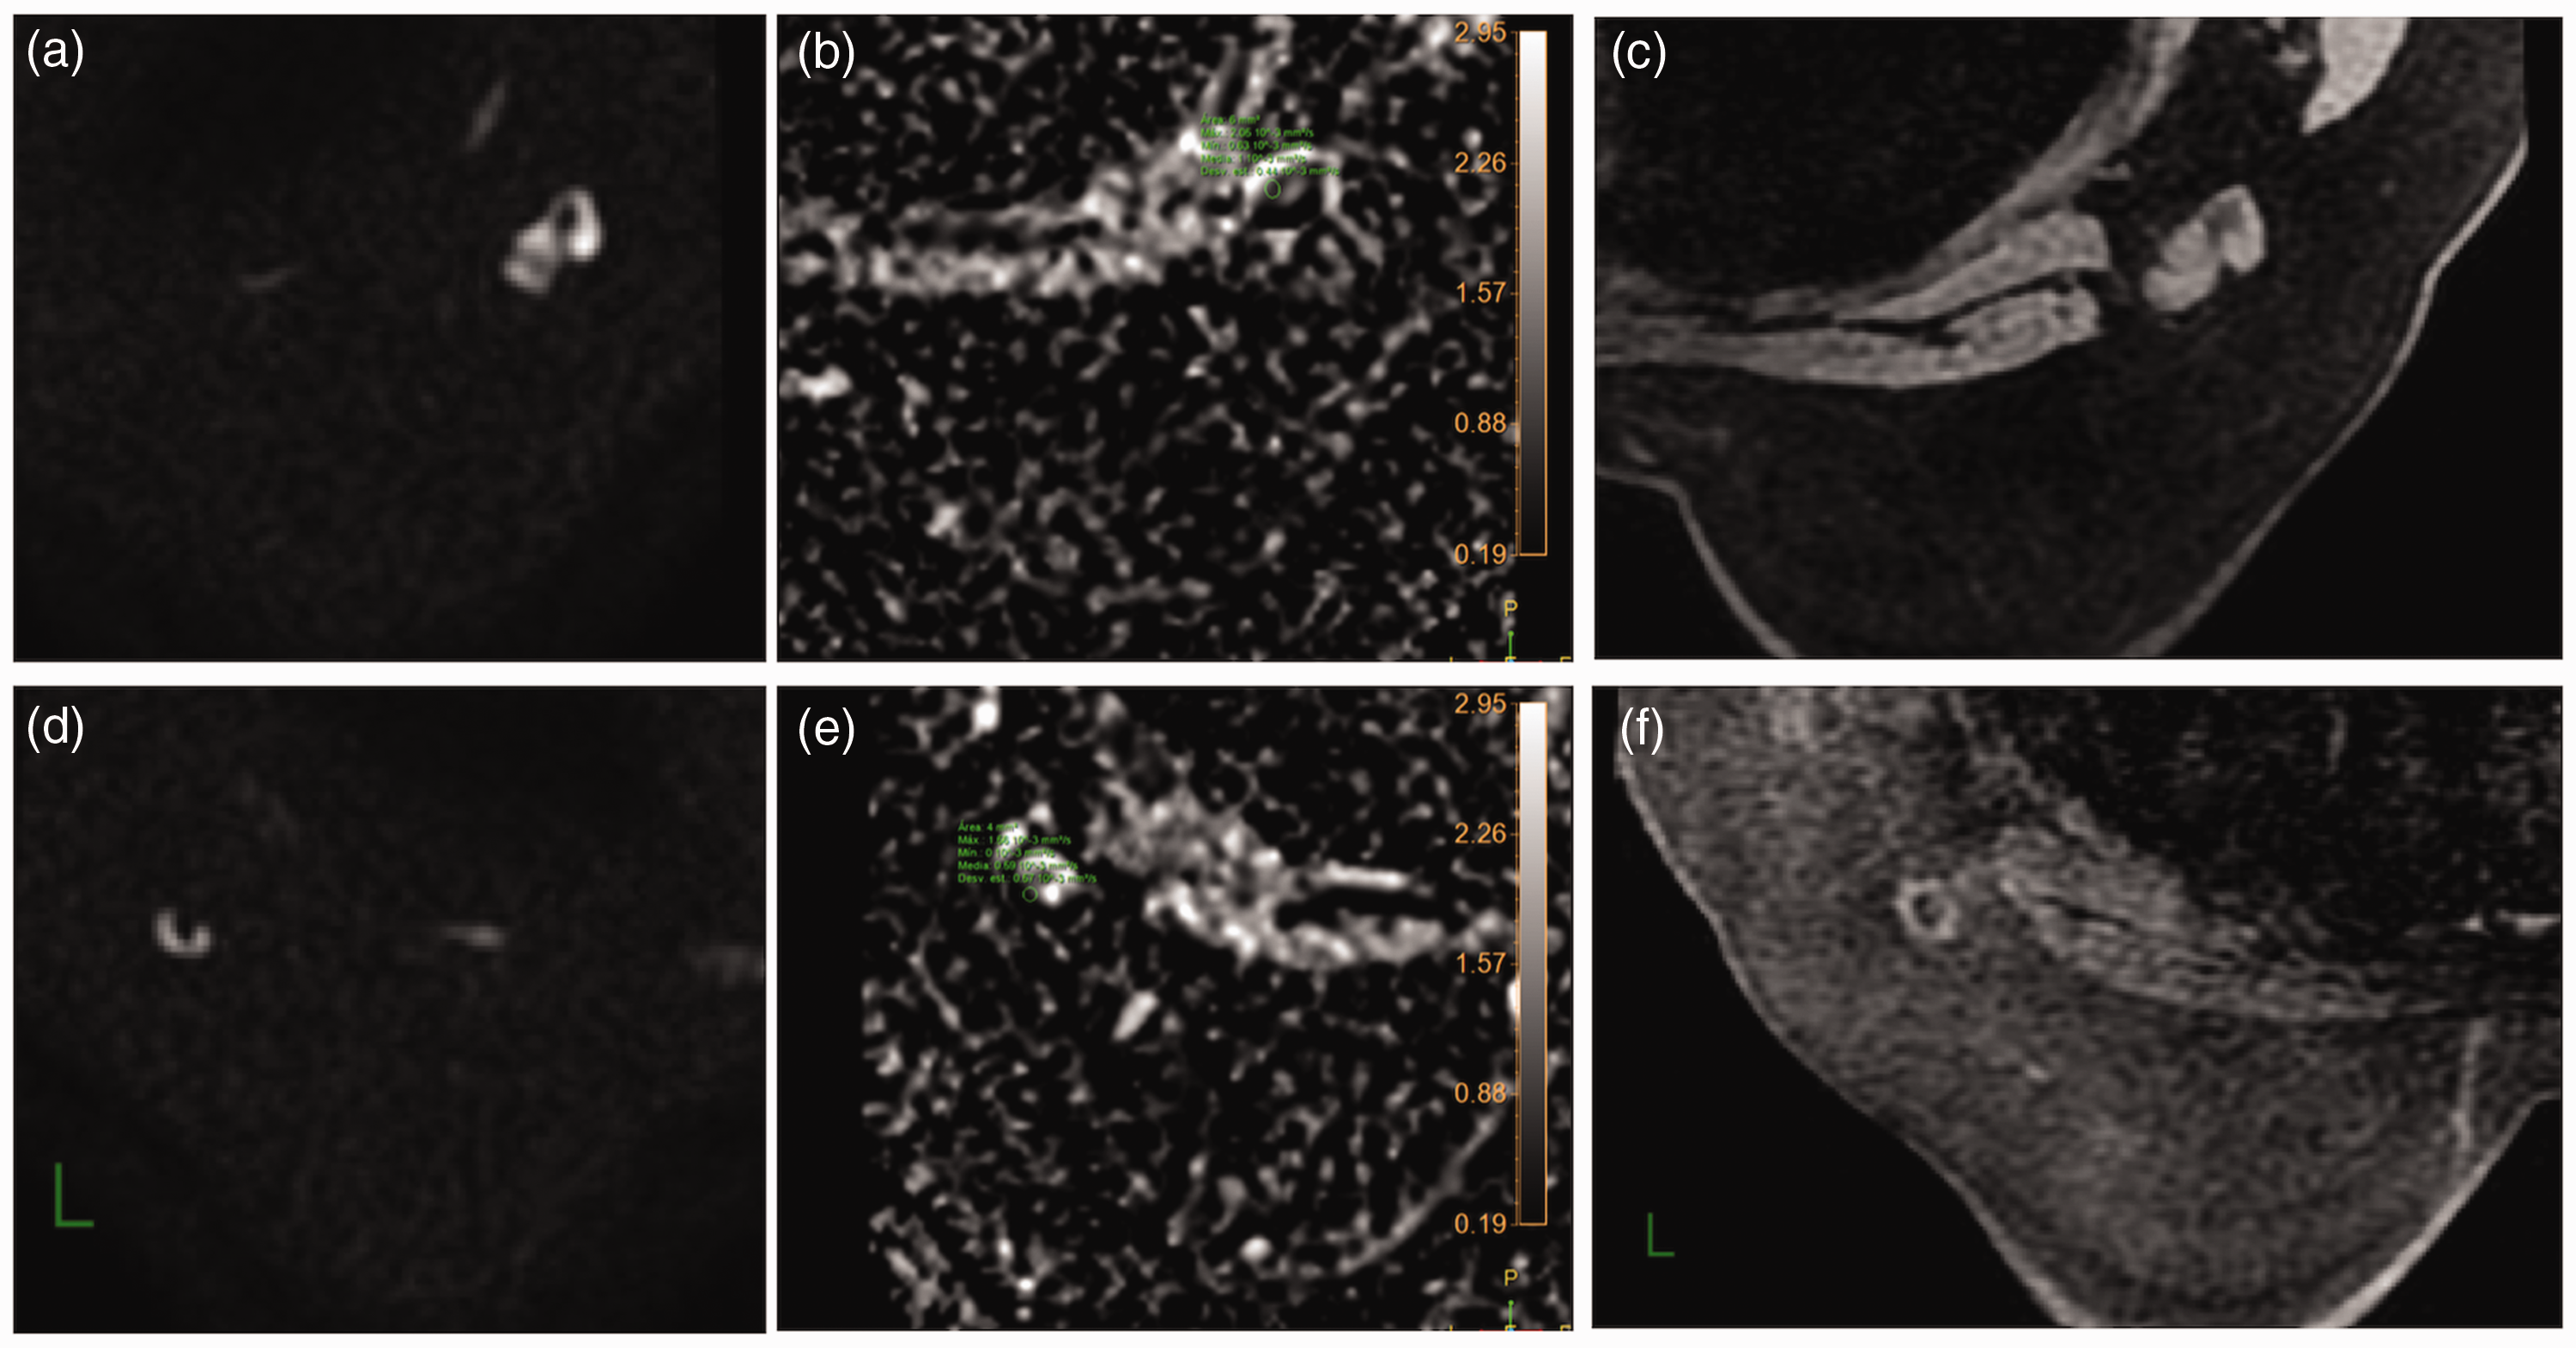
Images of a 44-year-old woman. (a) Axial DWI (b = 700) zoom showing a LN with cortical thickening and compression of the fatty hilum in the right axilla. (b) ADC map at the same level that shows one of the three ROIs into the LN with an ADC value of 1.10 × 10⁻³mm2/s. (c) Non-contrast axial VIBRANT zoom shows the same right ALN, with a cortical thickness of 9.5 mm. (d) Axial DWI (b = 700) zoom showing a normal morphology LN in the left axilla. (e) ADC map at the same level that shows one of the three ROIs into the LN with an ADC value of 0.59 × 10⁻³mm2/s. (f) Non-contrast axial VIBRANT zoom shows the same left ALN, with a cortical thickness of 2.9 mm. According to the average of the three ROIs, the ADC on the right axilla was 0.94 × 10⁻³mm2/s and on the left axilla was 0.60 × 10⁻³mm2/s. This patient has an infiltrating ductal carcinoma poorly differentiated in the right breast. The right ALN was positive to metastases in ultrasound-guided core biopsy previous to surgical treatment. ADC, apparent diffusion coefficient; ALN, axillary lymph node; DWI, diffusion-weighted imaging; ROI, region of interest
Histopathological assessment
Patients with suspicious ALN in the conventional imaging evaluation before MRI (n = 35) had an ultrasound-guided biopsy of the LN: fine needle aspiration (FNA) in four patients and core needle biopsy (CNB) in 31 patients. It was decided not to perform an ultrasound-guided biopsy in nine patients, due to conventional imaging evaluation.
Of the 44 patients, SLNB was performed in 12 patients (in seven patients, SLNB was the first histological assessment) and ALND was performed in 29 patients (in two patients ALND was the first histological assessment). We do not have information about surgical procedures in seven patients who received their treatment in another hospital after the ultrasound-guided biopsy.
Twenty patients received neoadjuvant chemotherapy (NAC); they all had a histological assessment of the LN before the NAC (FNA in three patients, CNB in 14 patients, and SLNB in three patients).
For the purposes of this study, we considered mALN if invasive tumor cells were found in LN by any of the following methods: FNA; CNB; SLNB; and ALND. If tumor cells were not found, the LN was considered non-mALN.
All the participants had a conventional negative imaging (ultrasound and mammography) and clinical evaluation of the breast and axilla contralateral to cancer; in this manner, for the purposes of this study, we assumed that all ALN on the contralateral side of breast cancer also were non-mALN.
Statistical analysis
Relevant clinical and imaging information was collected. The statistical analysis was done using SPSS version 20.0 (SPSS, Inc., Armonk, NY, USA) and MedCalc version 17.9.7 (Applied Math, Mariakerke, Belgium). In the case of qualitative variables, frequencies and percentages were obtained. To compare categorical variables, we performed Pearson’s χ2 test or Fisher’s exact test for 2 × 2 tables. We conducted a descriptive statistical analysis for quantitative variables, measures of central tendency, and dispersion.
To compare the means of LN size and LN ADC according to LN histopathology, we used Student’s t-test for previous corroboration of normal distribution of the data. First, we compared patients with mALN versus patients with non-mALN (Comparison 1). In second place, only in patients with mALN, we compared the ipsilateral axilla versus the contralateral axilla (Comparison 2). To counteract the problem of multiple comparisons we used the Bonferroni correction.
A multivariate logistic regression analysis was performed to identify significant variables to predict positive lymph nodes. Odds ratios (OR) and 95% confidence intervals (CI) were calculated.
Sensitivity and specificity were calculated to measure the performance of LN size and LN ADC according to LN histopathology. The optimal threshold was calculated with Youden index and conventional receiver operating characteristic (ROC) curve analysis. A P value ≤0.05 was considered statistically significant, except in cases where Bonferroni correction was used.
Results
The mean age of patients was 48 years (age range =25–76 years) at diagnosis. The breast tumor histopathology was: 40 patients with infiltrating ductal carcinoma (IDC); one patient with infiltrating lobular carcinoma; one patient with IDC mucinous type; one patient with infiltrating papillary carcinoma; and one patient with intracystic papillary carcinoma. Mean tumor size by MRI at diagnosis was 32.5 mm (range = 11–70 mm) for the 44 tumors. The ipsilateral ALN had a mean size by MRI of 17 mm (range =8.2–38.5 mm) and contralateral ALN of 14 mm (range = 8.1–31.5 mm). According to the histopathology, there were 30 patients with mALN and 14 patients with non-mALN. The flow of the patients through the study is presented in Fig. 2. Table 1 shows the clinicopathological characteristics and the conventional imaging features of the patients.

Study flow. The diagram shows the flow of patients through the study. ADC, apparent diffusion coefficient; mALN, metastatic axillary lymph node; MRI, magnetic resonance imaging; non-mALN, non-metastatic axillary lymph node; PACS, picture archiving and communication system; SLNB, sentinel lymph node biopsy.
Clinicopathological characteristics and imaging features of the patients with breast cancer.
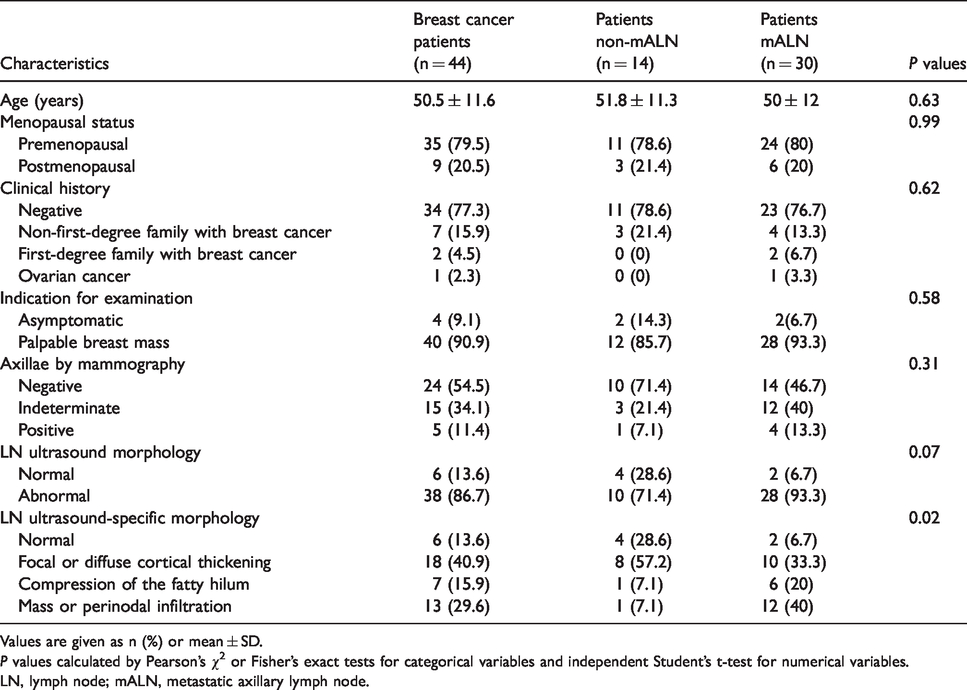
Values are given as n (%) or mean ± SD.
P values calculated by Pearson’s χ2 or Fisher’s exact tests for categorical variables and independent Student’s t-test for numerical variables.
LN, lymph node; mALN, metastatic axillary lymph node.
Comparison 1
In the analysis of LN size by MRI with the Bonferroni correction, we found that the LN size ratio of patients with mALN was shorter than in patients with non-mALN, with a significant statistical difference (1.39 ± 0.23 mm vs. 1.64 ± 0.29 mm, P = 0.004). We also found that the cortical thickness of the mALN was significantly larger than in patients with non-mALN (10.4 ± 5.32 mm vs. 5.9 ± 2.56 mm, P = 0.001). A descriptive analysis of the quantitative variables according to LN histopathology for comparison between patients is provided in Table 2.
Chart of Comparison 1, between LN size and LN ADC of patients with mALN and patients with non-mALN.

Values are given as mean ± SD.
*Calculated by Student’s t-test. With the Bonferroni correction the significance level to each variable must be α ≤ 0.007. The P values that meet this criterion are marked with **.
†Calculated by logistic regression.
‡Odds ratio.
ADC, apparent diffusion coefficient; LN, lymph node; mALN, metastatic axillary lymph node.
In juxtaposition of ipsilateral ALN ADC (as an independent value) of the 30 patients with mALN versus the 14 patients with non-mALN, we found that the ADC of patients with mALN was higher than patients with non-mALN, but we did not find any significant statistical difference (0.90 ± 0.12 × 10⁻³mm2/s vs. 0.85 ± 0.14 × 10⁻³mm2/s, P = 0.24).
When analyzing the normalized LN ADC, the 30 patients with mALN had a higher value than the 14 patients with non-mALN, but we did not find any significant statistical difference (1.18 ± 0.26 ×10⁻³mm2/s vs. 1.05 ± 0.32 × 10⁻³mm2/s, P = 0.17).
Comparison 2
When comparing the ipsilateral axilla versus the contralateral axilla, only in patients with mALN and with the Bonferroni correction, we found that the LN size ratio of the ipsilateral axilla was shorter than in the contralateral axilla, with a significant statistical difference (1.39 ± 0.23 mm vs. 1.93 ± 0.44 mm, P ≤ 0.001). We also found that the cortical thickness of the mALN was significantly larger than contralateral non-mALN (10.4 ± 5.32 mm vs. 4 ± 1.17 mm, P < 0.001). A descriptive analysis of the quantitative variables according to LN histopathology for comparison between axillae in patients with metastasis is provided in Table 3.
Chart of Comparison 2, between LN size and LN ADC of the axilla ipsilateral to breast cancer and the axilla contralateral to breast cancer only in patients with mALN.
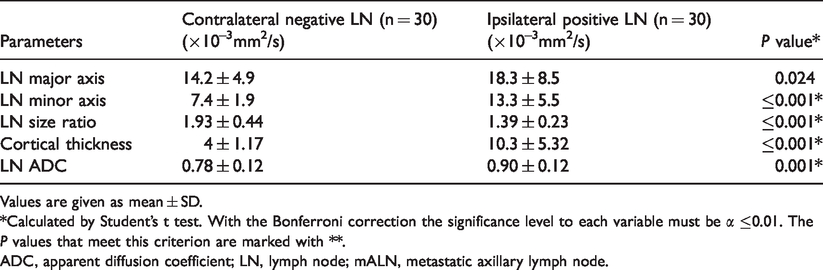
Values are given as mean ± SD.
*Calculated by Student’s t test. With the Bonferroni correction the significance level to each variable must be α ≤0.01. The P values that meet this criterion are marked with **.
ADC, apparent diffusion coefficient; LN, lymph node; mALN, metastatic axillary lymph node.
We observe that, in patients with mALN, the ADC value of the ipsilateral ALN was significantly higher than in the contralateral axilla (0.90 ± 0.12 ×10⁻³mm2/s vs. 0.78 ± 0.12 × 10⁻³mm2/s, P = 0.001). The distribution of the LN ADC for both axillae (ipsilateral and contralateral) in the 30 patients with mALN is presented in Fig. 3.

Box and whisker plot. Box and whisker plot shows the distribution of the LN ADC, for the ipsilateral axilla and the contralateral axilla in the 30 patients with mALN with a 95% confidence interval. The median for the ipsilateral LN was 0.90 × 10⁻³mm2/s and for the contralateral LN was 0.79 × 10⁻³mm2/s, and the minimum and maximum values were 0.67–1.18 x 10⁻³mm2/s for the ipsilateral LN and 0.58–1.11 × 10⁻³mm2/s for the contralateral LN. ADC, apparent diffusion coefficient; LN, lymph node.
Logistic regression analysis
With the logistic regression model, we do not identify significant variables for metastasis prediction. The variable closest to the significance was the ipsilateral LN size ratio (P = 0.06), which could mean the higher the size ratio the more likely the LN was negative for metastases. The ipsilateral LN ADC value was far from significant with controlled variables (P = 0.35), but in this case we could observe that the higher ADC value is 30 times more likely to have a positive LN. The P values of this analysis are shown in Table 2.
Accuracy analysis
Regarding the LN size ratio, the sensitivity and specificity were 76.7% and 86.7%, respectively, with an area under the ROC curve (AUC) of 0.906 (95% CI = 0.802–0.966, P ≤ 0.001). An optimal threshold of ≤1.56 (Youden index J of 0.633) was established for differentiating between mALN and non-mALN. With this cut-off, seven positive LN were misdiagnosed.
For the cortical thickness, the sensitivity and specificity were 80.0% and 97.7%, respectively, with an AUC of 0.929 (95% CI = 0.856–1.000, P ≤ 0.001). The ROC curve is presented in Fig. 4. An optimal threshold of ≥6.7mm (Youden index J of 0.777) was established for differentiating between mALN and non-mALN. With this cut-off, six positive lymph nodes were misdiagnosed.
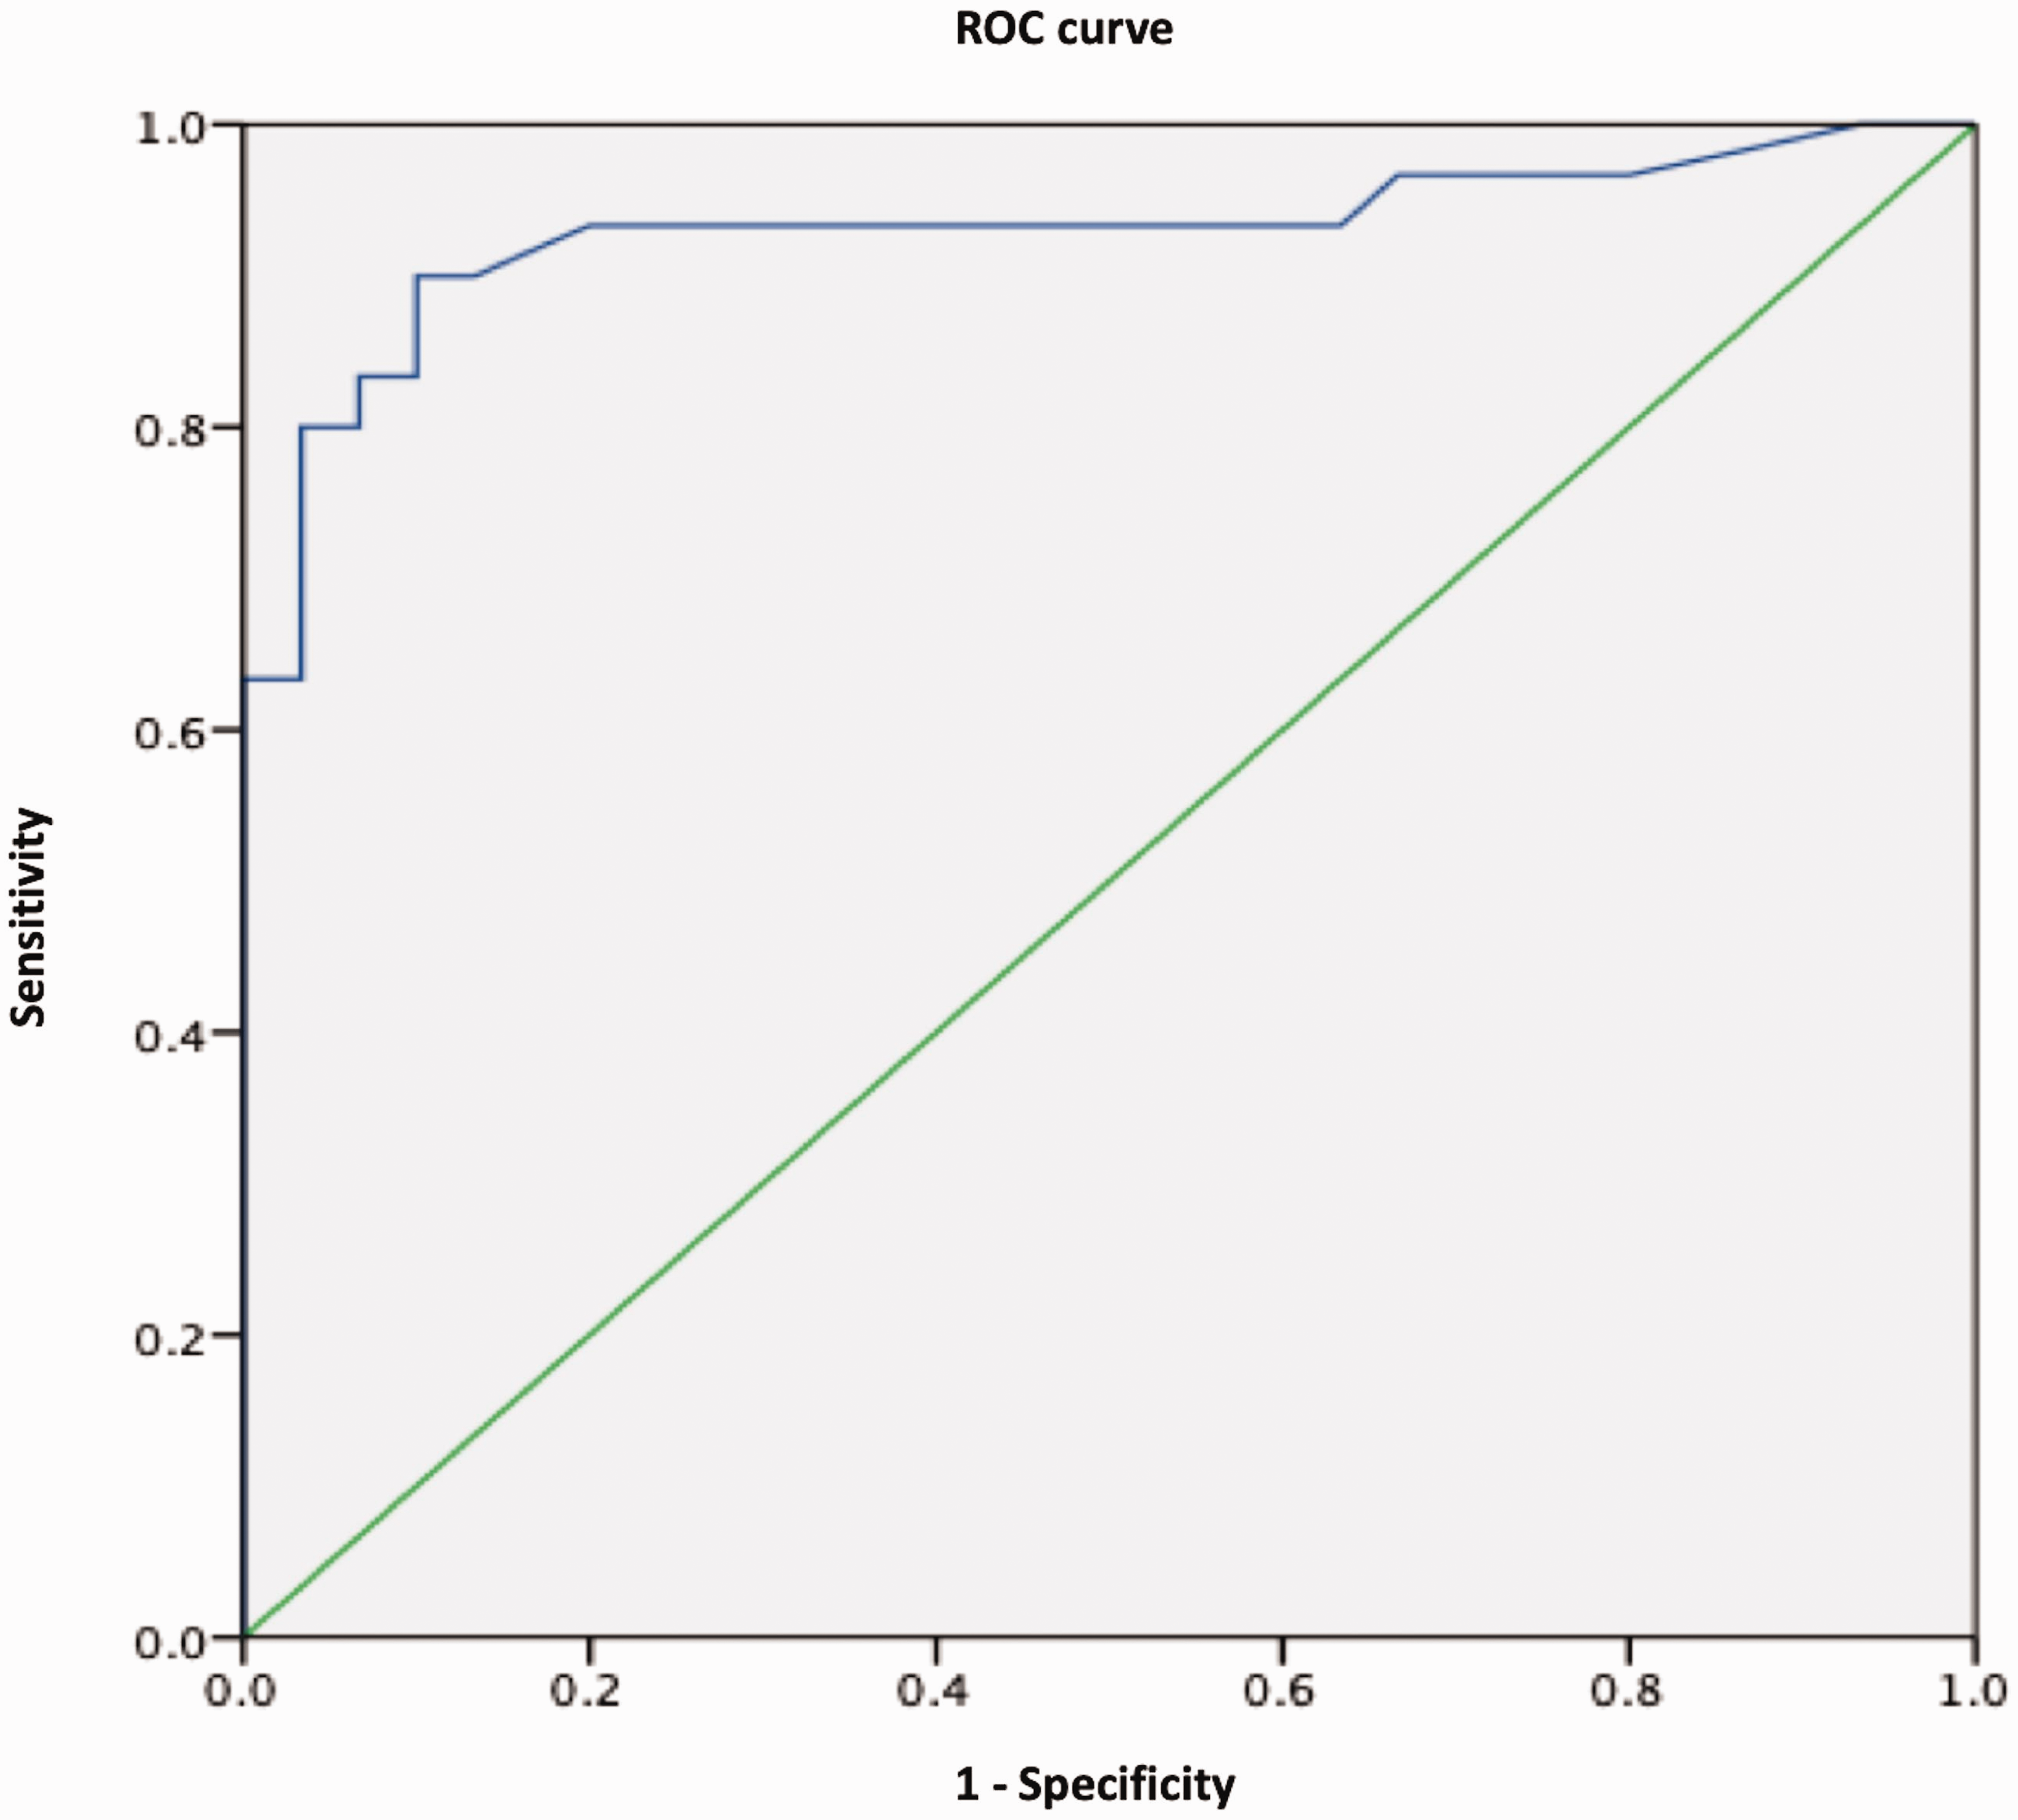
ROC curve. The ROC curve shows the diagnostic performance of the ALN cortical thickness using Comparison 2. The area under the curve was 0.929 (95% CI = 856–1.000) with a significance level of P ≤ 0.001. A cut-off point of LN size ratio of ≥ 6.7mm (Youden index J 0.777) corresponded to a sensitivity of 80.0% and specificity of 97.7%. ALN, axillary lymph node; CI, confidence interval; ROC, receiver operating characteristic.
Only in the patients with mALN, the LN ADC has a sensitivity of 66.7%, a specificity of 76.7%, and an AUC of 0.751 (95% CI = 0.627–0.874, P = 0.001). The ROC curve is presented in Fig. 5. An optimal threshold of ≥0.86 × 10⁻³mm2/s (Youden index J of 0.434) was established for differentiating between ipsilateral mALN and contralateral non-mALN. With this threshold, 10 positive LN were misdiagnosed. The measures of diagnostic accuracy for the LN size and the LN ADC in the differentiation of mALN and non-mALN are provided in Table 4.
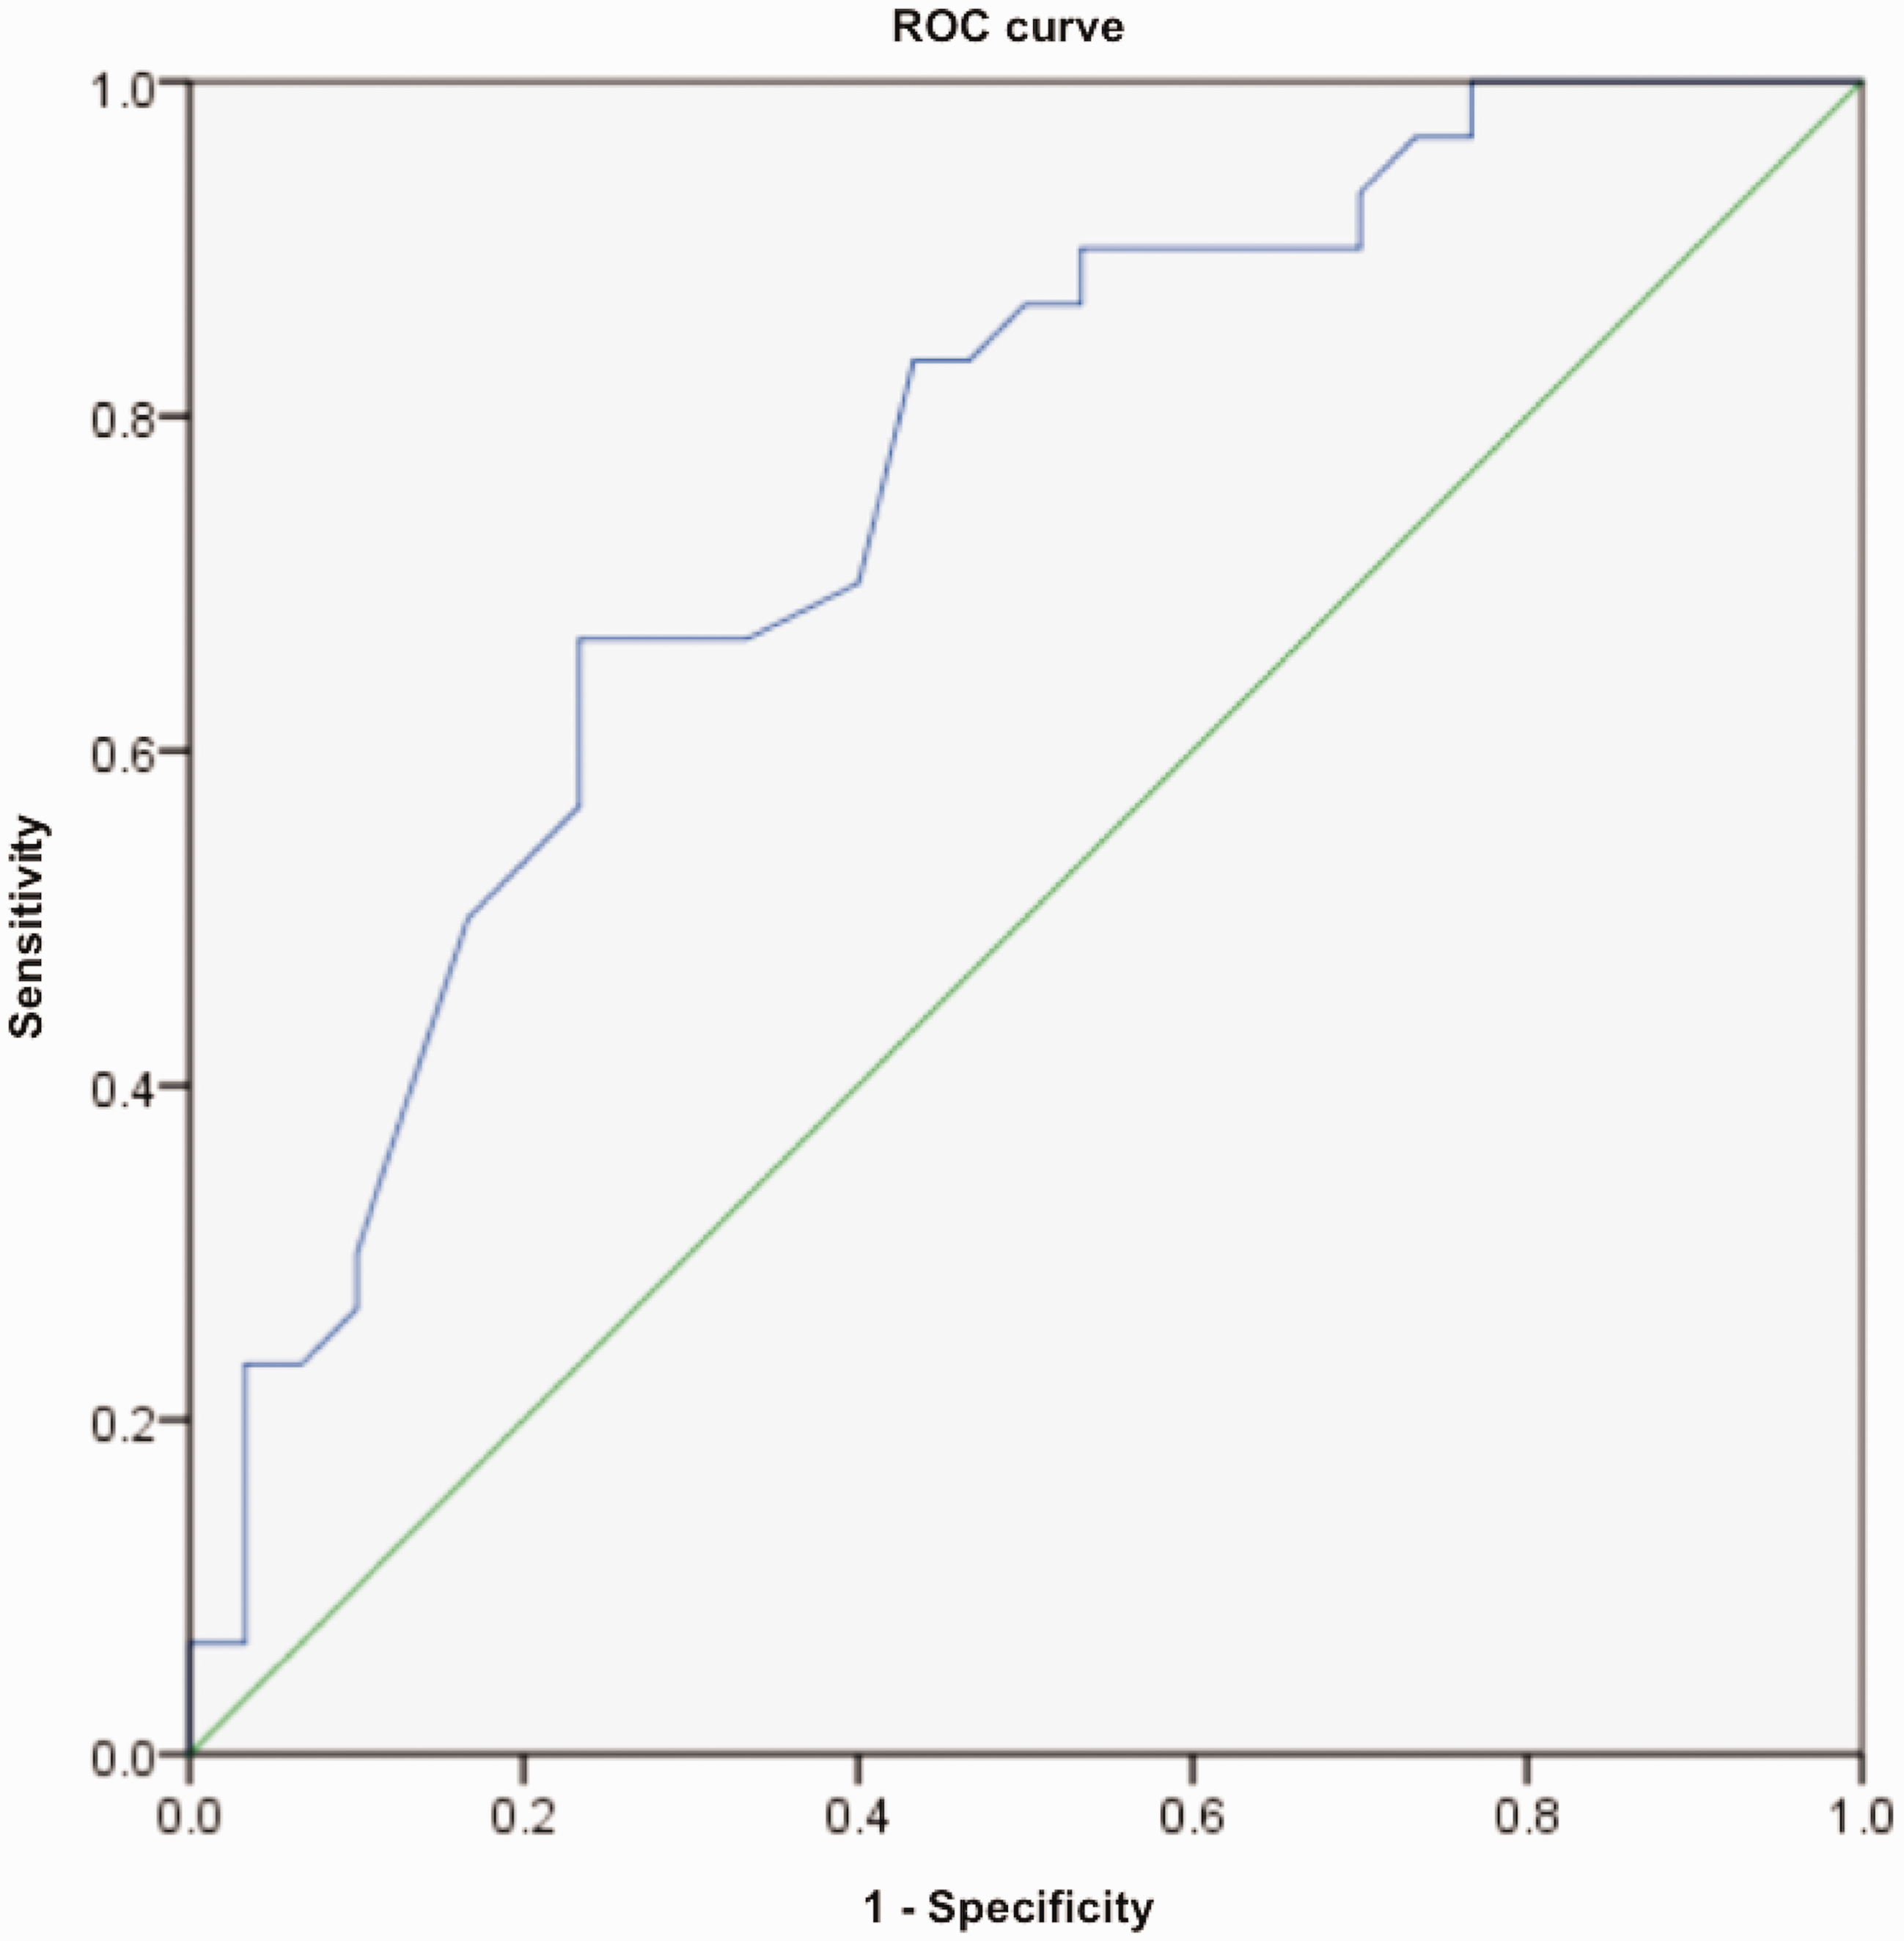
ROC curve. The ROC curve shows the diagnostic performance of the ALN ADC using Comparison 2. The area under the curve was 0.751 (95% CI = 0.627–0.874) with a significance level of P = 0.001. A cut-off point of ADC of ≥0.86 × 10⁻³mm2/s (Youden index J 0.434) corresponded to a sensitivity of 66.7% and specificity of 76.7%. ALN, axillary lymph node; CI, confidence interval; ROC, receiver operating characteristic.
Threshold, sensitivity, specificity, and AUC.

ADC, apparent diffusion coefficient; AUC, area under the curve; C1, Comparison 1; C2, Comparison 2; LN, lymph node.
Discussion
In the present study, we found that the cortical thickness is more accurate than the ADC value of the ALN to identify metastatic involvement, with a sensitivity of 80.0% and a specificity of 97.7% when we use the cut-off point ≥6.7 mm.
Currently, bulges or thickening of the ALN cortex on ultrasound is well recognized as a predictor of metastasis (23), but with some limitations such as high false-negative rates and the difficulty of visualizing all the LN in the axilla (24).
The possibility of performing a simple and short breast MRI protocol with the measurement of the ALN cortical thickness would allow us to select patients who would benefit from an ultrasound-guided biopsy before the surgery. We found that the cortical thickness of the ALN by MRI was greater in metastatic LN, similar to the findings observed by Luciani et al. (12) and Arslan et al. (13). It is important to mention that the cortical thickness averages reported by Luciani et al. (12) and Arslan et al. (13) (4.5 mm and 4.11 mm, respectively) were lower than ours (10.3 mm). These findings could be related to the fact that the mean of the minor axis (13.3 mm) of our population was greater than that reported by Luciani et al. and Arslan et al. (7.3 mm and 8 mm, respectively), and the fact that the proportion of positive LN in the population of Luciani et al. was lower than ours (14/165).
The correlation between the ADC and the breast cancer prognostic factors has been previously studied by Razek et al. (25). They found that tumors with lower ADC were more frequently associated with mALN. However, unlike our study, they focused on tumor ADC and not on LN ADC.
Regarding the ALN ADC, we found a relatively good diagnostic performance in differentiating mALN from non-mALN, with a sensitivity of 66.7% and a specificity of 76.7%.
Some authors have reported that the LN ADC value of patients with metastatic LN was significantly lower than in patients with non-metastatic LN (15–17). On the other hand, Kamitani et al. (20) found the opposite results, observing a significantly greater ADC in metastatic LN versus benign LN. We found a difference similar to that reported by Kamitani et al.
In other publications, the ALN ADC of patients with LN metastases is compared against patients without LN metastases. In our analysis, we did not find any significant difference when comparing patients with mALN versus patients with non-mALN. We must point out the importance of comparing the ipsilateral ALN against the contralateral LN because the LN ADC can vary due to each individual’s physiological circumstances (26).
Razek et al. (16) found that mALN had a lower ADC value than reactive LN; they attributed it to high cellularity among other histopathologic characteristics. However, it is important to note that they included only suspected LN, and the ROI was drawn around the inner margin of the LN, without clarifying whether they included the fatty hilum. We studied LN with suspected morphology against apparently normal morphology LN; the ROI was drawn in the cortex, avoiding the fatty hilum.
Zhang et al. (27) studied the difference in ADC values in metastatic and reactive LN in mice models and they proved that the ADC of metastatic LN were greater than the ADC of reactive LN. They explained that these findings were due to the lower cellularity of the metastatic tumors compared to the cellularity of the surrounding lymphatic tissue (27).
The value of the ADC as a radiomic tool has shown good results in different areas of breast cancer research, such as the prediction of malignancy in breast tumors or the prediction of the tumor response to NAC (28). However, according to our findings, the ADC would not have the same performance in predicting the metastatic involvement of ALN; we found that the size of the LN has a better diagnostic performance.
Morphological MRI criteria such as short axis, irregular contours, or cortical thickness of the ALN could suggest metastatic involvement through the difference in means (12,13). In our study, the difference in means with the Bonferroni correction was statistically significant; however, the logistic regression analysis did not find any significant criterion. This last finding is probably due to the size of our population and the few cases of non-mALN.
The present study has some limitations. First, the size of the patient cohort is small, which could be related to the fact that our institution is a referral hospital that receives patients with previous interventions (percutaneous or surgical biopsies) performed in other centers, in which a pre-interventional breast MRI was not performed. Another possible limitation is the fact that two-thirds of the patients resulted with axillary metastatic involvement, which differs from other works; this shows the unfortunate reality of our country, where up to 70.2% of diagnoses are made in late stages (29).
Currently, the benefits of knowing the LN status before the surgery is controversial, mainly in the context of patients with T1–2 breast cancer tumors (30). However, in the context of patients with breast cancer > 5 cm (especially those with triple-negative or HER2-positive) (31) or in patients with smaller tumors with ≥3 affected LN (30), the identification of LN with metastases before surgery could be decisive in choosing the most appropriate treatment.
In conclusion, this study demonstrates that the difference in means of the LN size, more specifically the cortical thickness, has a better diagnostic performance than the LN ADC value, for discriminating between mALN and non-mALN. It is necessary to conduct more studies in the future with larger populations in order to validate our findings. This could provide a more accurate and non-invasive way of staging ALN disease in selected patients with breast cancer and therefore in treatment planning.
Footnotes
Authors' note
Carla Melissa Ferrara-Chapa's current affiliation is: Department of Radiology and Imaging, Hospital General de Zona #33, Instituto Mexicano del Seguro Social, Monterrey, Nuevo León, México.
Acknowledgements
The authors thank Dr. Néstor Alejandro Rangel-Ovalle and Dr. Emma Bertha García-Quintanilla for their help in the language editing of the manuscript.
Declaration of conflicting interests
The author(s) declared no potential conflicts of interest with respect to the research, authorship, and/or publication of this article.
Funding
The author(s) declare not having received any payment or support in kind in any aspect of the submitted work.
