



Abstract
Background
Many factors influence the increase in signal intensity (SI) provided by magnetic resonance imaging (MRI) contrast media.
Purpose
To assess the impact of different gadolinium concentrations and dilutions of three macrocyclic gadolinium-based contrast agents (GBCA) on SI.
Material and Methods
This phantom study investigated gadobutrol, gadoteridol, and gadoterate in human plasma of a healthy donor pool at 37 °C. Different molar concentrations served to mimic conditions typically relevant for steady-state imaging; different dilutions served to mimic influence on first-pass bolus imaging. For SI measurement at 1.5T and 3T, we used two Magnetom Scanners (Siemens), applying the T1-weighted sequences Flash 2D/3D and VIBE. Regions of interest were placed on the central slice of the test vials.
Results
In the concentration series, gadobutrol showed the highest SI of all three GBCAs up to 2 mM, followed by gadoteridol and gadoterate. No major differences were seen between 1.5T and 3T. In the dilution series, gadobutrol showed the highest SI of all three GBCAs up to 10 mL/L. The highest effect was recorded with Flash 3D and VIBE at 3T.
Conclusion
SIs measured in phantoms using three macrocyclic GBCAs strongly depend on their relaxivity and on the local concentration. The latter can be influenced—when comparing dilutions—by their initial concentration in their formulation. Furthermore, the pulse sequences and the chosen parameters have essential influence. At steady-state concentrations (≤2 mM) and first-pass bolus dilutions (up to 10 ml/L), gadobutrol showed highest SIs, followed by gadoterate and gadoteridol.
Introduction
Signal intensity (SI) is one of the key parameters for diagnostic performance in magnetic resonance imaging (MRI). Signal enhancement, provided by the application of gadolinium-based contrast agents (GBCA) within the region of interest (ROI), should be as high as possible so that the radiologist can determine the lesion’s localization, size, and internal structure with high confidence and make the most reliable diagnosis.
The available SI enhancement, as obtained in contrast-enhanced MRI, depends on the contrast medium—here, a GBCA (1,2)—its concentration (1,3–5) at the target imaging region in the body, the scanner’s field strength (6–8), and the pulse sequence applied (2,9,10).
The concentration at the target region in a human body depends on multiple variables: individual cardiovascular physiology; ROI; injection rate; injected dose; and concentration of the injected Gd formulation. An in vitro phantom study provides the unique opportunity to exclude factors influenced by individual physiology and reduce the remaining variables to properties of the GBCA. In a highly standardized experiment, the GBCA’s relaxivity (1,6,11) and the GBCA’s concentration (4,5) are the two key variables left.
In this standardized in vitro phantom study, we determined the SIs of three commercially available macrocyclic GBCAs at different concentrations and dilutions.
While the concentration series aims to mimic the situation at steady state in routine body imaging in the range of ≤2 mM, the dilution experiments aim to mimic the conditions typically found in first-pass bolus in angiography, reaching values usually up to 10 mL/L, which corresponds to the clinically relevant concentration of up to 7.5–12 mmol/L in this setting (9).
We focused on the macrocyclic GBCAs as the use of linear ones (except for gadoxetic acid) has been restricted by the European Medicines Agency since 21 July 2017 (12) and is in scientific discussion in many other countries. We applied two routinely established field strengths (1.5T and 3.0T) and three T1-weighted pulse sequences, often used in first-pass, contrast-enhanced MR angiography (MRA).
The data presented here are additional, so far unpublished, results from a study on in vitro relaxivity of macrocyclic GBCAs presented by Frenzel et al. (13) and published by Szomolanyi et al. (14). However, here we focus on SI enhancement, a more clinically tangible parameter than relaxivity.
Material and Methods
Study design
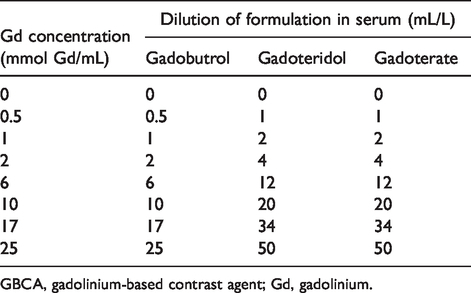
In an in vitro study, we measured SIs of the macrocyclic GBCAs gadobutrol (Gadovist®, Gadavist®, Bayer AG, Leverkusen, Germany), gadoteridol (Prohance®, Bracco Imaging SpA, Milan, Italy), and gadoterate (Dotarem®, Guerbet, Roissy CdG, France). Gadovist® is formulated as a 1 molar solution, while Prohance® and Dotarem® are formulated as 0.5 molar solutions. The preparation of the samples has been recently published by Szomolanyi et al. (14). In brief, test samples were prepared in human plasma at several dilutions of the commercial GBCAs, which led to the concentrations as depicted in Table 1. Plasma was obtained from heparinized blood from a healthy donor pool (three male and three female volunteers). The plasma was spiked with the GBCA and deep frozen until the measurements were performed.
Sample concentrations obtained by dilution of the commercial macrocyclic GBCAs in serum.
GBCA, gadolinium-based contrast agent; Gd, gadolinium.
Study settings and equipment
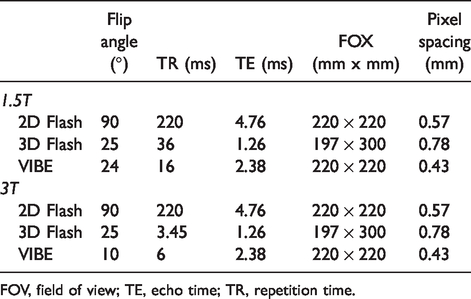
A 1.5-T Magnetom Avanto and a 3-T Magnetom Trio MR scanner (all Siemens Healthineers, Erlangen, Germany) were used. For a 1.5-T scanner, a matrix coil was used; for a 3-T scanner, a 16-channel head array (Invivo, Orlando FL, USA) was used. Field strengths, sequences relevant for MRA, and sequence parameters are shown in Table 2.
Sequence parameters (NA=1).
FOV, field of view; TE, echo time; TR, repetition time.
The test tubes were positioned in a rack in a silicon oil bath to maintain the temperature at 37 °C during the measurement (Fig. 1). Silicon oil temperature was kept constant using warm water, which flushed a separate chamber within the tube holder. The water-flushed chamber was separated from the bath oil by a thin thermal-conductive wall. Concentrations and dilutions are summarized in Table 1. The ROIs of 5 × 5 mm for SI measurements were positioned on the central slice of the test vials (Fig. 2). Each measurement was performed once.
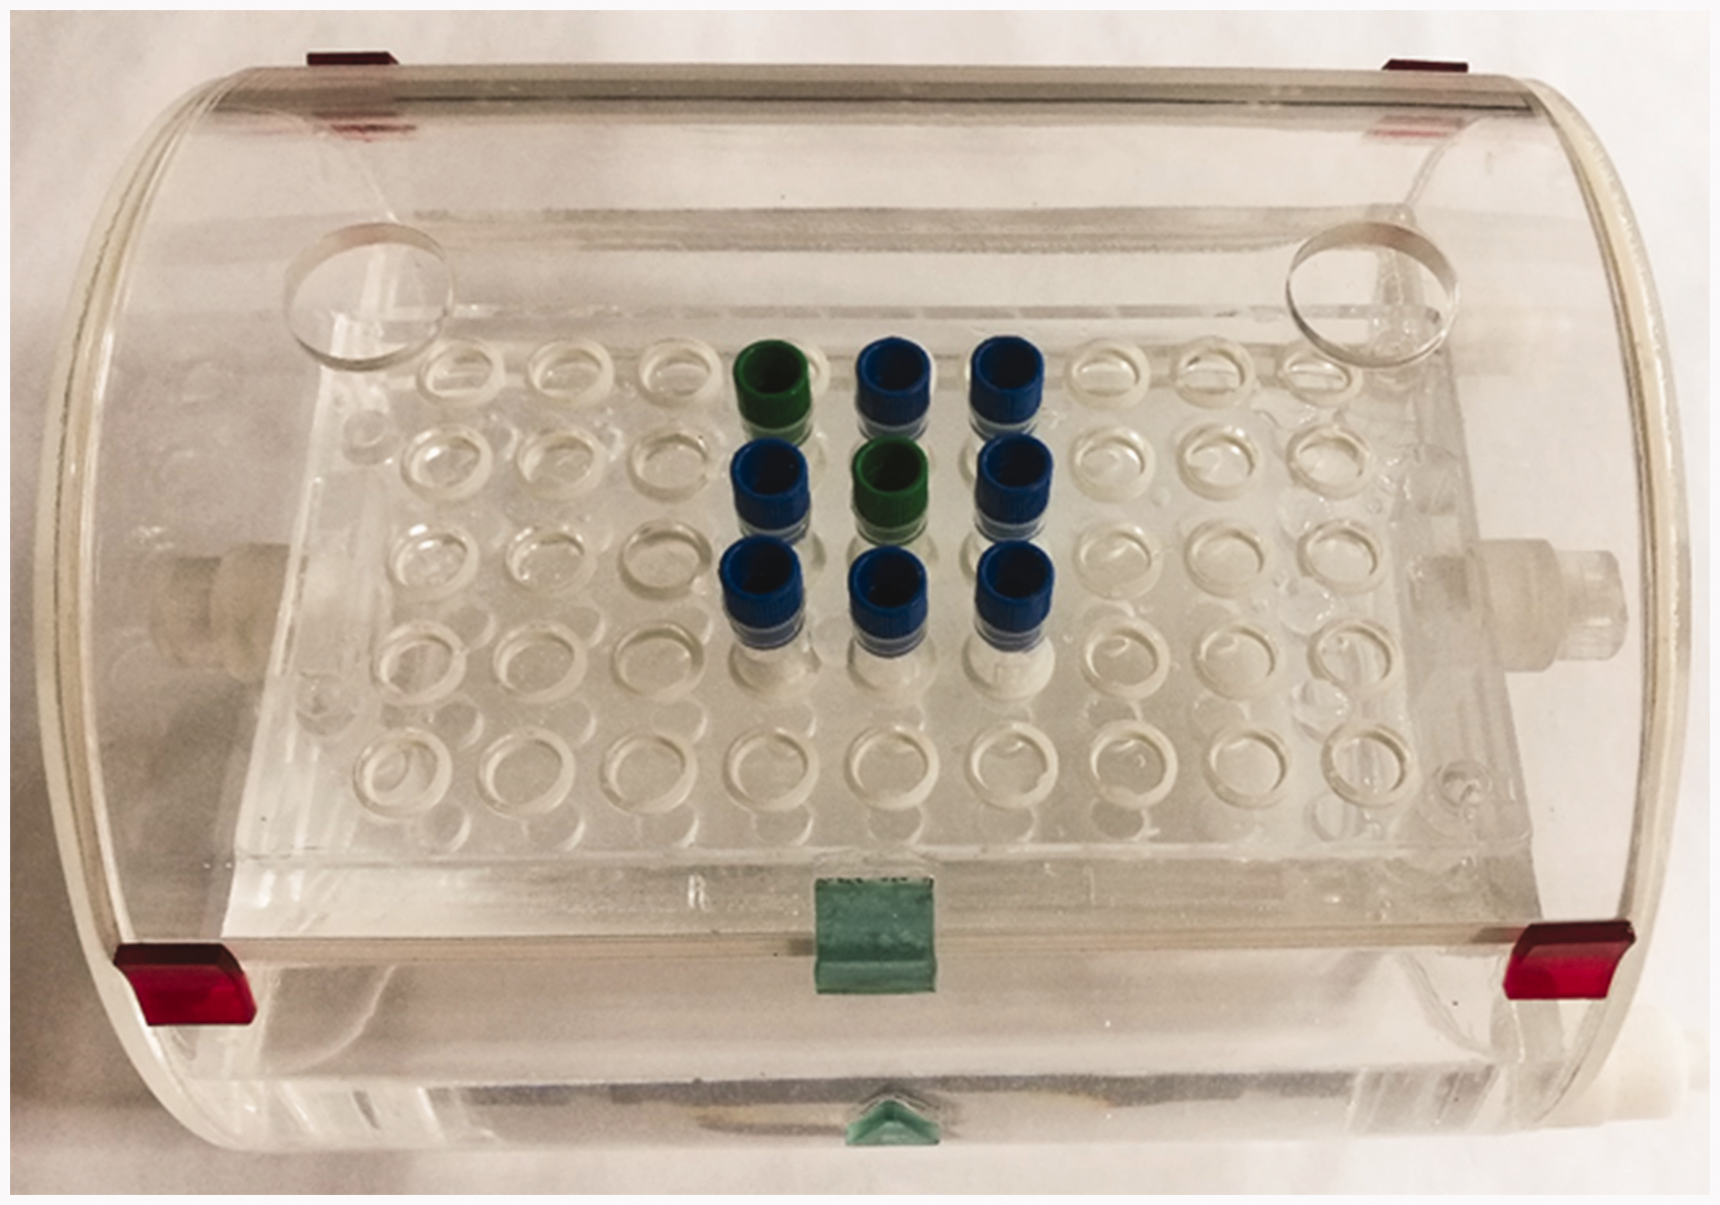
Sample rack with silicon oil bath. Green tube stoppers indicate controls.
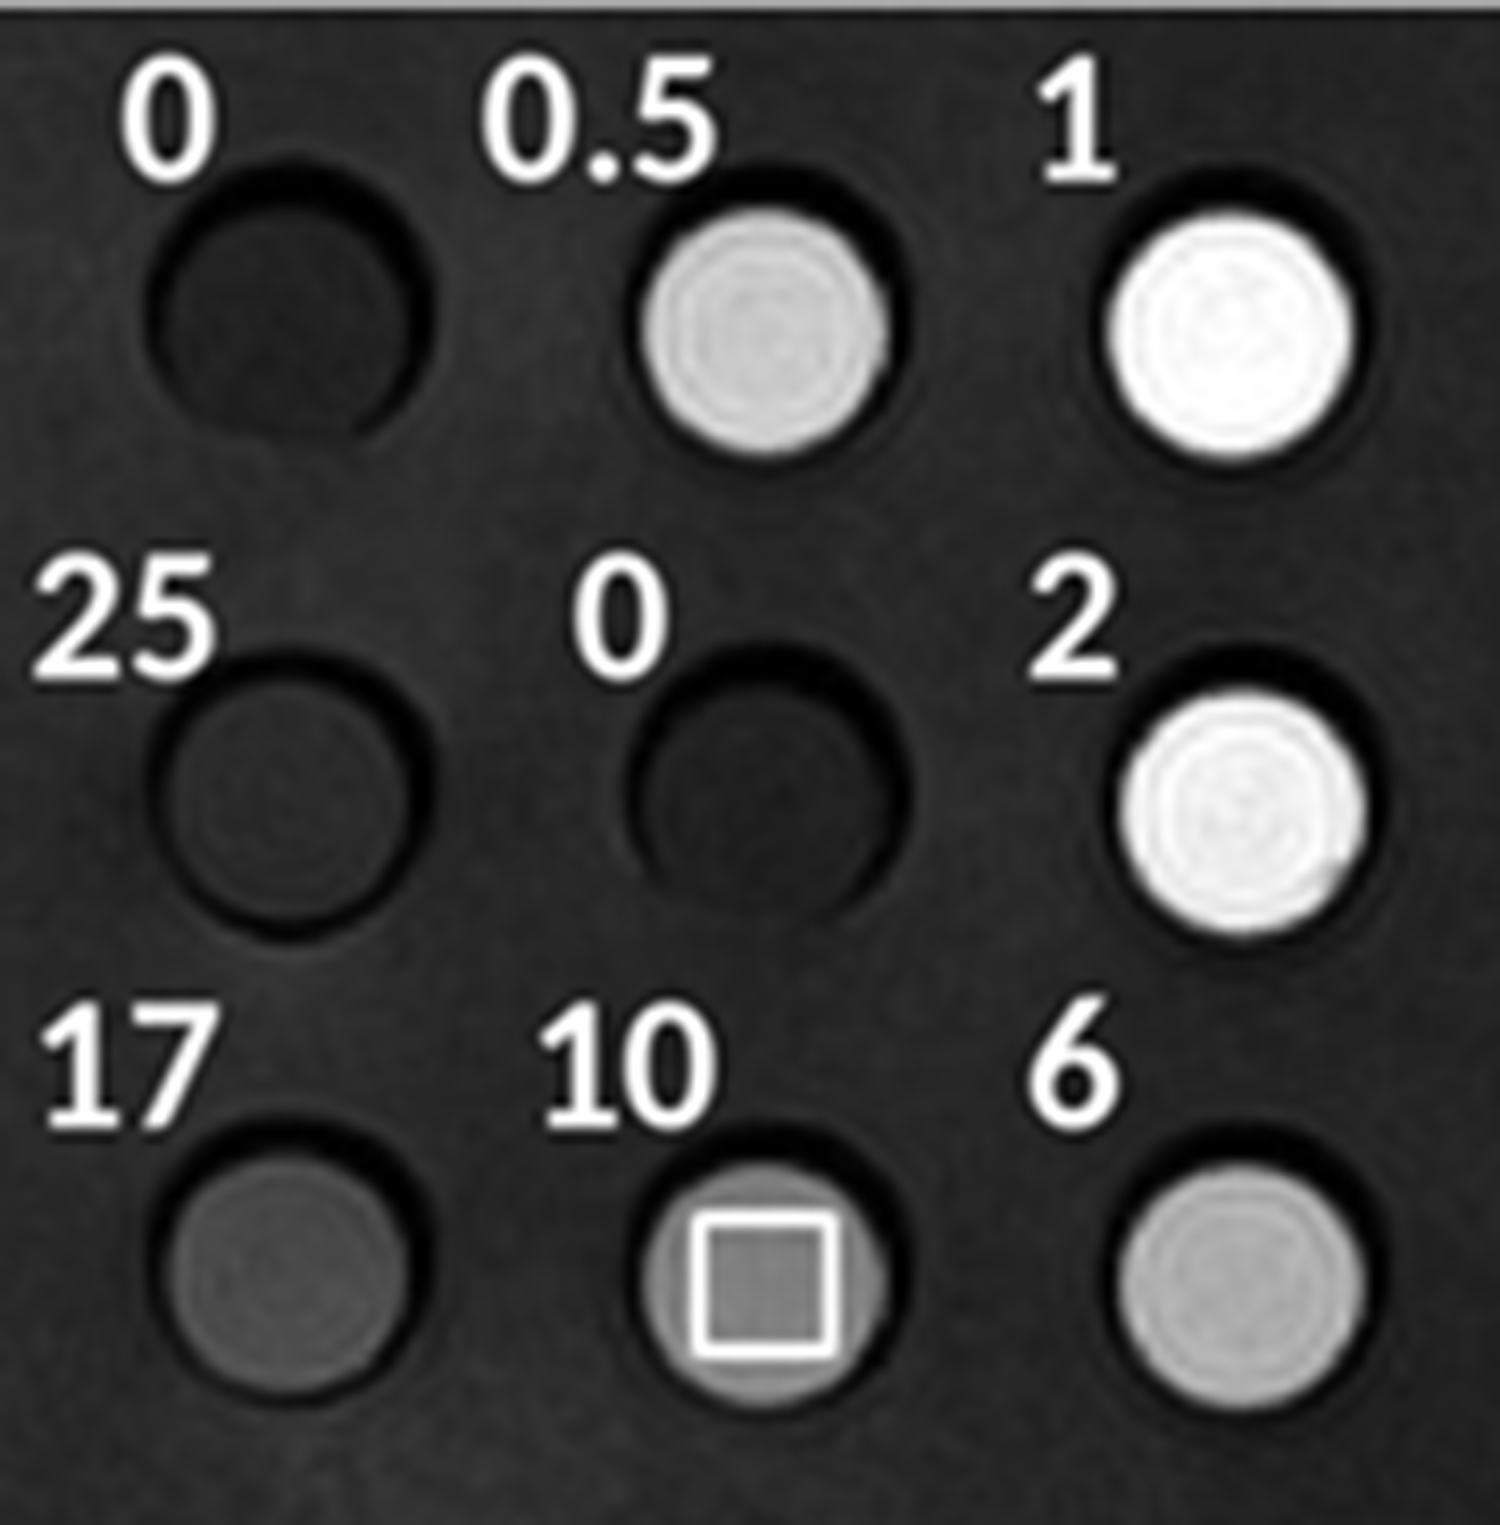
Positioning of the ROIs for measurement of SI. Numbers indicate the concentration of GBCAs in mmol/L, the white square indicates the selected ROI for measurement of SI. GBCA, gadolinium-based contrast agent; ROI, region of interest; SI, signal intensity.
Investigated parameters
The investigated parameters were SIs of different molar concentrations (mmol Gd/L) and SIs of different dilutions of three commercially available GBCAs in order to mimic the situation at steady state in routine body imaging (≤2 mM) and at first-pass bolus imaging (angiography) (≈10 mL/L), respectively (15).
Statistics and sample size
As this was a pilot in vitro study, only descriptive statistics were applied. SIs were plotted versus concentrations and dilutions.
Results
We report our results as plots of SI versus concentration and dilution of the three GBCAs. Fig. 3 shows results at 1.5T and Fig. 4 shows results at 3T.
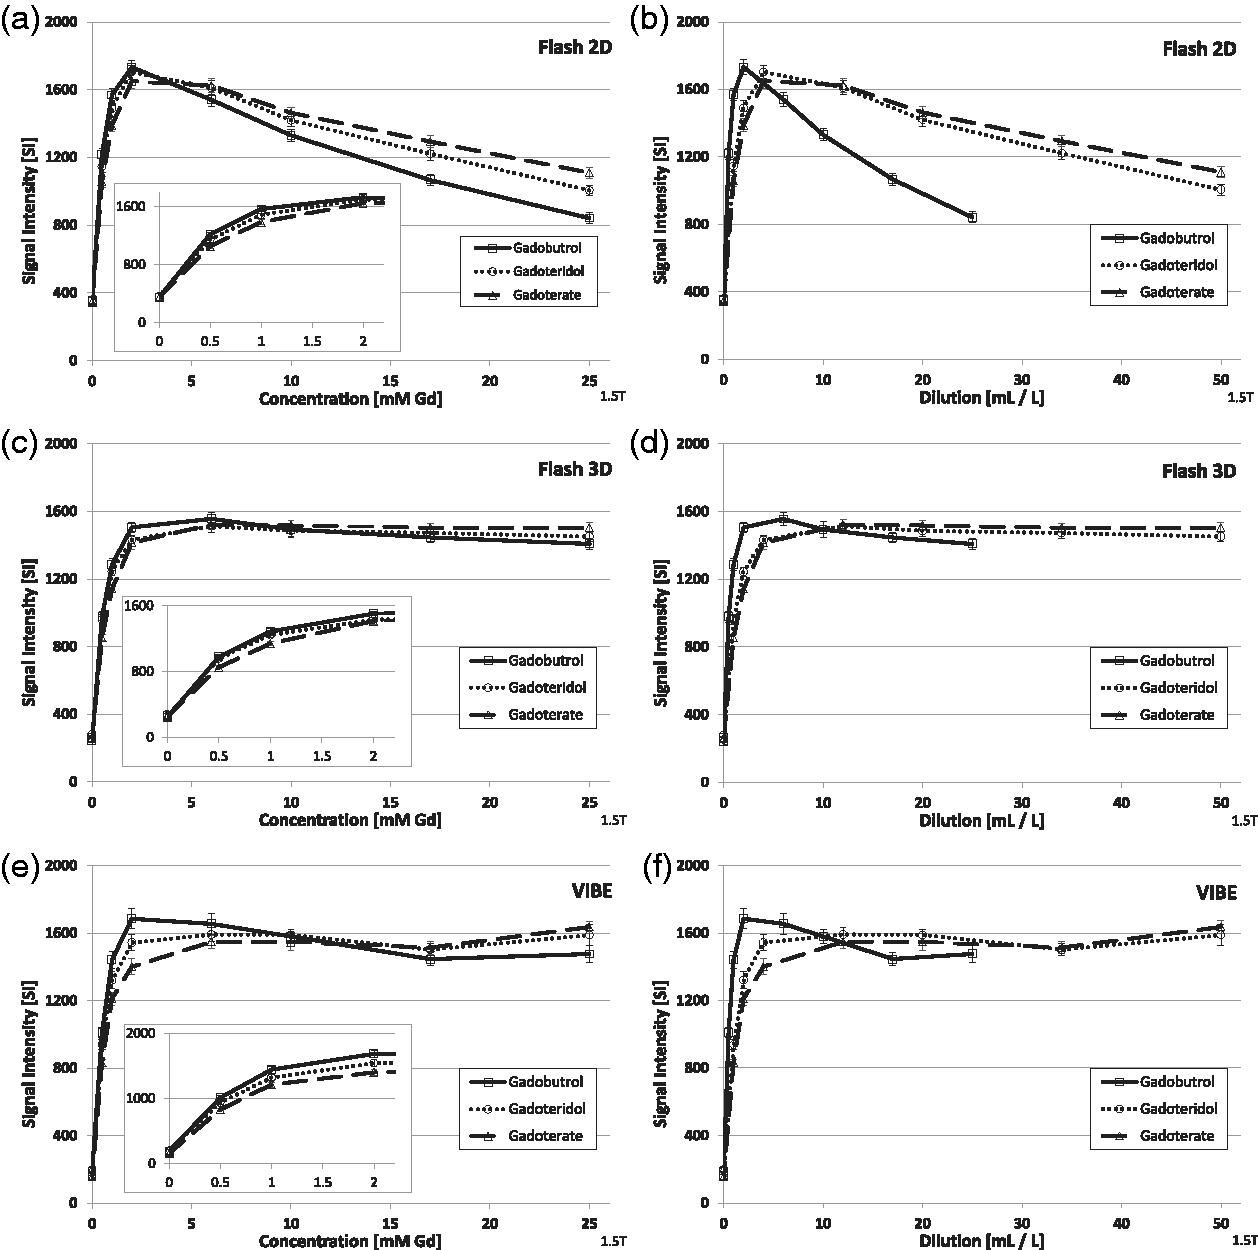
Signal intensities of three macrocyclic GBCAs at different concentrations and different dilutions at 1.5T in plasma. GBCA, gadolinium-based contrast agent.
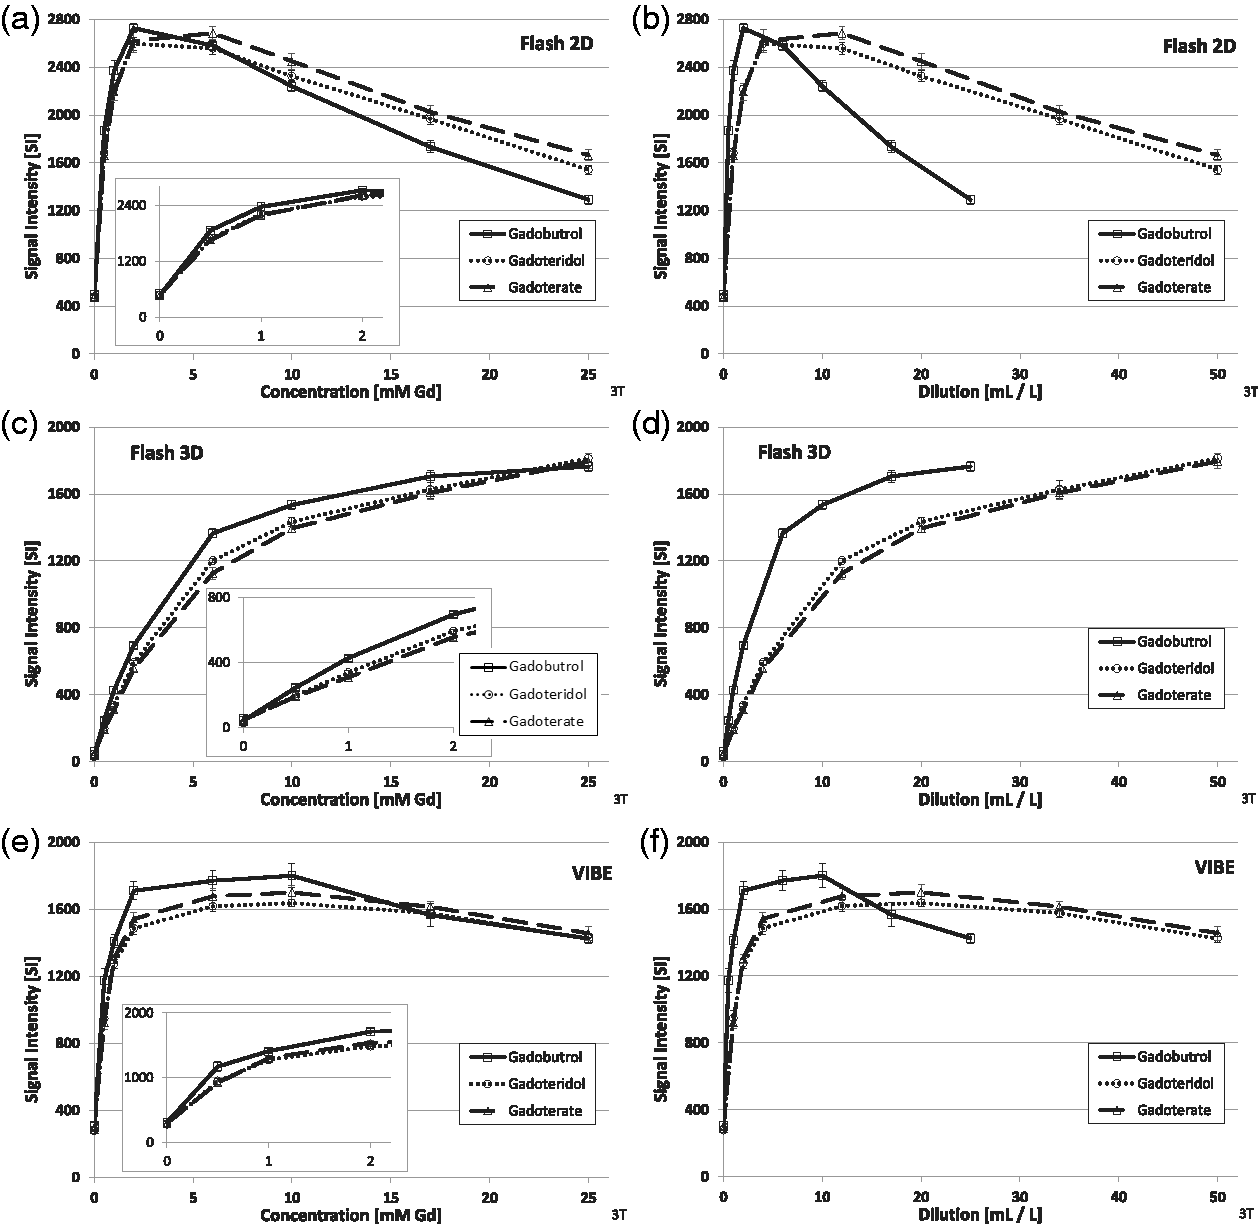
Signal intensities of three macrocyclic GBCAs at different concentrations and different dilutions at 3T in plasma. GBCA, gadolinium-based contrast agent.
In the concentration series, gadobutrol showed the highest SI of all three GBCAs up to 2 mM, the clinically realistic concentration at steady-state imaging, followed by gadoteridol and gadoterate. At higher concentrations, SIs of all GBCAs peaked briefly (Flash 2D, VIBE), levelled off, and reached a plateau (Flash 3D). Finally, all SIs declined at very high concentrations, as the T2* effect starts to dominate the SI. No differences were seen between 1.5T and 3T (Figs. 3 and 4).
In the dilution series, gadobutrol showed the highest SI of all three GBCAs up to 10 mL/L, the clinically relevant concentration during first-pass bolus imaging. This is less pronounced at 1.5T (Fig. 3) compared to 3T (Fig. 4). The highest effect was recorded with Flash 3D and VIBE at 3T.
Discussion
We determined the impact of different concentrations and dilutions of three macrocyclic GBCAs on signal intensity in human plasma in an in vitro phantom study. Gadobutrol showed the highest SIs at concentrations ≤2 mM and dilutions ≈10 mL/L.
This in vitro phantom study design offered the unique opportunity to directly compare the GBCAs’ capability to increase SI by eliminating all interfering effects associated with administration into and the distribution within the living human body, while reasonably assuming that the pharmacokinetics of the three GBCAs are very similar (9,16–18). Due to the standardized setting, this study will be easily reproducible for other researchers.
A similar in vitro study approach has been reported by Ugas et al. (8). They evaluated various concentrations of gadopentetate, gadobenate, and gadofosveset diluted either in saline or iodinated contrast material plus adding three different steroids or local anesthetics. They also plotted relative SI versus GBCA concentration yielding somewhat comparable graphs as in this study. Peak SIs were found at concentrations in the range of 0.645–1.25 mmol/L although the sequences were not identical, but comparable to ours (8).
The SI differences between the three GBCAs of the concentration series (left columns of Figs. 3 and 4) were solely depending on their relaxivities, as all other potential variables were kept unchanged. This experiment was meant to mimic conditions typically found at steady-state body imaging, regarding molar Gd concentration. When we plotted SI against the dilution of the GBCA formulations (right columns of Figs. 3 and 4), the SI differences were due to two features: (i) the different relaxivities of the GBCAs (14); and (ii) the different concentrations of the formulations in what is meant to reflect first-pass bolus imaging, as in angiography. As gadobutrol is formulated as a 1 molar and the two other GBCAs as 0.5 molar solutions, the SI differences were more pronounced in the dilution experiments. Gadobutrol’s double concentration is mainly relevant in first-pass imaging as it yields higher in vivo concentrations, which is particularly important in angiography (9).
Gadobutrol featured the highest SIs at steady-state concentrations (15) up to 2 mM and during first-pass bolus imaging up to 10 mL/L (9). Gadobutrol was followed by gadoteridol and gadoterate, which might be explained by its higher relaxivity and concentration of the formulation, compared to the other compounds (1,14).
While the differences in the concentration series were small between 1.5T and 3T, the differences were more pronounced in the dilution series at 3T, particularly in Flash 3D (Fig. 4).
Different SIs at field strengths of 1.5 and 3T were also found by Ugas et al. (8). They analyzed the effect of adding steroids and anesthetics to the GBCA/saline solutions on SI curves demonstration an impact only at 3T.
In the present study, the SI increase started to decline at concentrations >5 mM Gd for Flash 2D and VIBE, due to the signal-decreasing T2* effect, while for Flash 3D the SI increased in an asymptotic fashion up to the highest concentration used, particularly at 3T.
The fact that SIs vary with different pulse sequences and concentrations is not new. Quantitative determinations in the in vivo setting can be challenging due to highly patient-dependent, individual physiology and hence local contrast concentrations. However, for instance Kramer et al. (15) have shown in a clinical setting investigating volunteers with simultaneous measurements of contrast agents phantoms, that for local concentrations up to approximately 10 mM, the relation of SI and concentration was basically proportional for the commonly used MRA sequences. This reflects the relevance for increasing local concentrations in clinical settings and using the common MRA sequences.
SI is a key parameter for diagnostic performance. The higher the SI and the contrast of the lesion to the surrounding tissue, the easier it is for the radiologist to determine localization, size, margin, and internal structures of the lesion. Therefore, theoretically, stronger SI enhancement by application of a GBCA is of benefit. Multiple individual factors (e.g. cardiovascular parameters) might interfere. An idea of how these findings might impact the radiologist’s diagnostic performance is given by Kramer et al. (19): Kramer et al. performed an intra-individual comparison of equal doses (0.1 mmol/kg) of gadobutrol (1 mol/L formulation), gadoterate, and gadobenate (both 0.5 mol/L) in 20 healthy volunteers in MRA of the supra-aortic vessels. In static MRA, gadobutrol was rated superior to gadoterate (P < 0.05) and equal to gadobenate dimeglumine (P = 0.06) with good to excellent reader agreement. In addition, signal-to-noise and contrast-to-noise ratios were higher for gadobutrol compared to gadoterate (P < 0.05) (19).
Similarly, in a pre-clinical study in minipigs, Hadizadeh et al. (2,9) showed that concentration of the formulation and relaxivities of GBCAs affect quantitative and qualitative image quality in MRA. They concluded that the overall image quality was rated higher with 1.0 M gadobutrol compared with 0.5 M gadopentetate. Additionally, small lesions such as metastases and lesions with minor and slow contrast agent uptake such as MS lesions and early stages of synovitis in joint disease may benefit from higher SI and contrast.
Our results might be useful for future in vivo studies, where an optimized GBCA dose for pre-defined hardware and software parameters and indications need to be determined. Furthermore, these findings could also serve as a base for future quantitative image evaluation, e.g. in studies with automated evaluation settings for machine learning systems.
The present study has some limitations. First, the differences between the GBCAs might be smaller or even vanishing once patient parameters (e.g. individual cardiovascular physiology) come into play in the clinical routine setting. Second, due to the exploratory design, only descriptive statistics could be applied.
In conclusion, SIs of the three macrocyclic GBCAs strongly depend on their relaxivity and concentration in their formulation as well as on the pulse sequence. At steady-state concentrations (≤2 mM) and first-pass bolus dilutions (up to ≈10 mL/L), gadobutrol showed the highest SIs, followed by gadoterate and gadoteridol.
Footnotes
Declaration of conflicting interests
The author(s) declared the following potential conflicts of interest with respect to the research, authorship, and/or publication of this article: MR, HP, and JE are current or former employees of Bayer.
Funding
The author(s) received the following financial support for the research, authorship, and/or publication of this article: The study was funded by Bayer AG.
