



Abstract
Background
The coronary venous system is frequently used as an entry route to the heart and treatment modalities for many cardiac diseases and many procedures. Consequently, evaluation of the coronary venous system and understanding cardiac vein anatomy is crucial.
Purpose
To determine the optimal image set in a comparison of noise-optimized linearly blended images (F_0.6) and noise-optimized virtual monoenergetic images (VMI+) evaluated by dual-energy computed tomography (DECT) for cardiac vein assessment.
Material and Methods
Thirty-four patients (mean age 58.2 ± 14.2 years) who underwent DECT due to chest pain were enrolled. Images were post-processed with the F_0.6, and VMI+ algorithms at energy levels in the range of 40–100 keV in 10-keV increments. Enhancement (HU), noise, signal-to-noise ratio (SNR), and contrast-to-noise ratio (CNR) were objectively measured at two points in the great cardiac vein by consensus of two radiologists. Two blinded observers evaluated the subjective image quality of the great cardiac vein on a 4-point scale.
Results
HU, noise, and SNR peaked at 40 keV VMI+ (P < 0.05) among 50–100 keV VMI+. CNR peaked at 100 keV VMI+; however, there were no significant differences compared to CNR images processed at 40–90 keV VMI+. HU and noise were significantly higher in 40 keV VMI+ than F_0.6 images; however, both SNR and CNR were significantly higher in F_0.6 images. An assessment of subjective vein delineation revealed that F_0.6 images had the highest scores
Conclusion
F_0.6 images were superior to VMI+ and provided the optimal image set for cardiac vein assessment.
Introduction
The coronary venous system is frequently used as an entry point for access to the heart for many cardiac procedures and for the treatment of many cardiac diseases such as arrhythmias and heart failure. Furthermore, this route may be also used for percutaneous venous interventions, including transcoronary venous ablation, percutaneous mitral annuloplasty, and retrograde cardioplegia perfusion (1). Consequently, the evaluation of the coronary venous system and a thorough understanding of cardiac venous anatomy are crucial for these applications. It is difficult, however, to evaluate the cardiac vein with single-energy computed tomography (CT) due to low attenuation. Recent technical developments, including dual-energy CT (DECT) which provides better contrast resolution, have been reviewed in clinical radiology (2). Different voltage levels have a great impact on both the contrast resolution and noise characteristics of datasets produced with single-energy CT and DECT (3). Several post-processing image algorithms exist for DECT, including the creation of both virtual monoenergetic images (VMIs) and linearly blended images. Monoenergetic reconstruction series from cardiac DECT can significantly reduce high-attenuation artifacts by using higher monoenergy levels (4). The main benefits of VMI, as initially reported, were a reduction of beam-hardening artifacts at high keV levels and the production of more quantitatively accurate attenuation measurements (5). These advantages allow for the significantly improved diagnostic assessment of the structures surrounding high contrast concentrations in the SVC as well as coronary calcifications. In addition, VMI can mitigate artifacts associated with metal, which can be advantageous for the assessment of lumen patency in coronary stents, and for the visualization of structures adjacent to sternal wires, surgical clips, or bypass grafts (4,6). Many other studies have shown the value of VMI in vascular imaging such as CT angiography of the cerebrovascular system, pulmonary arteries, or aorta (5). Despite these benefits, the strongest iodine attenuation can be achieved at lower keV levels, which significantly increases image noise and thus results in diminished image quality (5). This technical drawback has been overcome by a recently introduced noise-optimizing reconstruction algorithm (VMI+), which calculates images with increased signal attenuation at low tube voltage levels without increasing the image noise (7). Another recently developed image processing algorithm is the noise-optimized, linearly blended imaging algorithm, which reconstructs images with a blending factor of 0.6 (F_0.6), covering 60% of the lower tube voltage and 40% of the higher tube voltage spectrum. F images are potentially different from the standard linearly blended images (M images) produced by image filters that run after reconstruction, resulting in slightly lower image noise. The F_0.6 algorithm does not achieve high attenuation levels equivalent to VMI+ at low keV; however, it does reduce the image noise. Therefore, it may be possible to improve the signal-to-noise (SNR) ratio and contrast-to-noise (CNR) ratio with the F_0.6 algorithm. The relationships between enhancement, noise, and post-processing algorithms for DECT are summarized in Fig. 1. To date, a comprehensive comparison has not been made between the different monoenergetic reconstruction algorithms and noise-optimized linearly blended algorithms used for angiographic CT assessment of the cardiac vein. Thus, the relative usefulness of currently available post-processing algorithms is still unknown, since recent studies evaluating different body regions compared either only the VMI+ technique with traditional VMI or with standard linearly blended images (7,8). Therefore, the aim of the present study was to determine the optimal image set for cardiac vein assessment, comparing noise-optimized F_0.6 and noise-optimized VMI+ acquired by dual-source DECT.
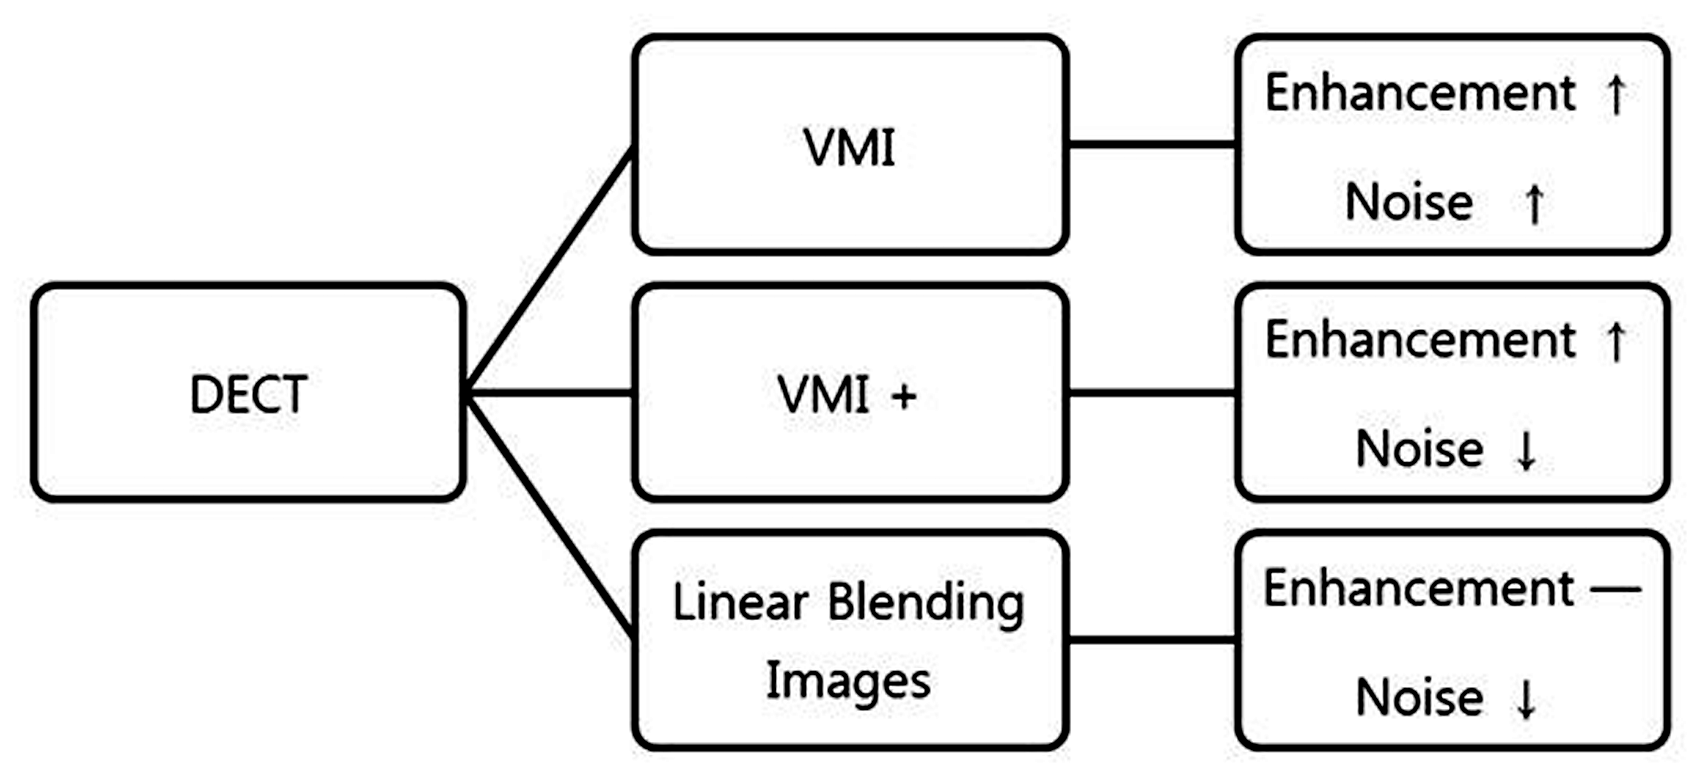
The relationships between enhancement, noise, and post-processing algorithms for DECT. VMI increases both enhancement and noise, and VMI+ increases the enhancement but decreases the noise. Linearly blended images show moderate enhancement with slightly more decreased noise than VMI+ images. DECT, dual-energy computed tomography; VMI, virtual monoenergetic image.
Material and Methods
Patient selection
Our retrospective study received institutional review board approval with a waiver for informed consent. Thirty-four consecutive patients with chest pain were referred to our institution to undergo DECT angiography (DE-CTA) of the heart between May and December 2018. The exclusion criteria for our study were contraindications for contrast-enhanced imaging, including reduced renal function (estimated glomerular filtration rate below 45 mL/min per 1.73m2) and prior side effects to iodinated contrast material. Based on these exclusion criteria, all 34 patients (19 men, 15 women; mean age = 58.2 years; age range = 18–84 years) were enrolled in the study.
DECT image acquisition
Imaging data were acquired with a third-generation, dual-source CT (DSCT; Somatom Force, Siemens Healthineers, Forchheim, Germany). Nitroglycerin spray (0.4 mg, nitrolingual®, McKesson Medical-Surgical, Inc., Irving, TX, USA) was administered sublingually 5 min before the examination to dilate the coronary arteries. Beta-blockers were not administered before the scan. The CT scan was initiated by continuously injecting an 80-mL bolus of iopamidol (Pamiray®, 320 mg/mL, Dongkuk Pharm., Seoul, Republic of Korea), followed by 30 mL of saline solution into an antecubital vein via an 18-gauge catheter at a 5 mL/s injection rate. A bolus tracking method was chosen to evaluate the coronary artery and vein. A region of interest (ROI) was placed on the aortic root, and image acquisition began 9 s after signal attenuation reached the predefined threshold of 100 Hounsfield units (HU) for improved contrast enhancement in the cardiac vein. The CT scan was obtained with the dual-energy mode (90 kVp and 150 kVp) from the level of the carina to the base of the heart in a craniocaudal direction, with a detector collimation of 2 × 192 × 0.6 mm, using a z-flying focal spot technique and a gantry rotation time of 250 ms. ECG-based tube current modulation (Mindose®) was used in all patients to reduce the radiation dose. A full tube current was applied at 60%–70%, and 4% throughout the remainder of the cardiac cycle in patients with mean heart rates (HRs) < 65 bpm. Patients with HR ≥65 bpm received full tube current at 30%–40%, and 4% throughout the remainder of the cardiac cycle. Reconstruction parameters included a section thickness of 0.75 mm at 0.3-mm increments, using a Bv40 medium-smooth kernel and a model-based iterative reconstruction strength of level 5 (ADMIRE; Siemens Medical Solutions, Forchheim, Germany).
Image reconstruction and analysis
Noise-optimized linearly blended images were automatically reconstructed with a blending factor of 0.6 (F_0.6), covering 60% of the low tube voltage (90 kVp), and 40% of the high tube voltage (150 kVp). The DECT raw data were transferred to a three-dimensional (3D) multimodality workstation (syngo.via®) for post-processing. VMI image calculation was performed with the advanced, noise-optimized VMI+ algorithm. Energy levels were in the range of 40–100 keV in 10-keV increments.
Objective image analysis
Quantitative measurements were obtained on a commercially available PACS workstation and a 3D multimodality workstation (syngo.via®) and were confirmed by the consensus of two radiologists with 20 years of experience in cardiovascular imaging and two years of experience in radiology, respectively. Homogeneous circular ROIs with consistent diameters were positioned at two different levels of the great cardiac vein for signal attenuation measurements. Level I was the great cardiac vein at mid-ventricle, and level II was just below the left atrial appendage. Signal attenuation was measured as mean HU within the great cardiac vein. Measurements for image noise evaluation, defined as the standard deviation (SD) of fat, were conducted with an ROI placed in the fat near the proximal portion of the great cardiac vein. Measured attenuation and SD were recorded for each measurement. SNR and CNR values were calculated with the following formulas as previously described in several DECT studies (7,9): SNR = HU lesion/image noise; and CNR = (HU lesion – HU fat)/image noise.
Subjective image analysis
Two blinded observers with 20 and 2 years of radiology imaging experience, respectively, determined the subjective image analysis quality by visually grading the visibility of the great cardiac vein. Image series reconstructed using noise-optimized, linearly blended (F_0.6) and noise-optimized VMI+ algorithms were rated on a 4-point evaluation scale: grade 1 = no visualization of the great cardiac vein; grade 2 = poor visualization, indicating equivocal detection with minimal contrast; grade 3 = good visualization, indicating that although the great cardiac vein was detectable with accuracy, it was not clearly visualized because of its small size or poor contrast; and grade 4 = excellent visualization, indicating that the great cardiac vein had high contrast with the surrounding structures and was clearly visualized. A window width of 800 HU and a window level of 300 HU were fixed for subjective image evaluation.
Statistical analysis
Commercially available statistical analysis software was used for data analysis. A paired t- test with post-hoc Hochberg–Bonferroni was used to compare 40 keV to 100 keV in noise-optimized VMI+, and a paired t-test compared VMI+ and F_0.6 images. A P value < 0.05 was considered statistically significant. To determine the inter-observer agreement in the assessment of the visibility of the great cardiac vein, we calculated the intraclass correlation coefficients (ICCs), where an ICC of ≤0.20 indicated slight agreement, 0.21–0.40 fair agreement, 0.41–0.60 moderate agreement, 0.61–0.80 substantial agreement, and 0.81–1.00 indicated almost perfect agreement.
Results
Patient population
A total of 34 patients (19 men, 15 women; mean age =58.2 years; age range = 18–84 years) were enrolled in the present study. Table 1 shows the baseline characteristics of the enrolled patients. The mean HR during the CT exams was 60.5 ± 8.6 bpm (range = 44–85 bpm). One patient had an irregular HR, with a variability of > 10 bpm.
Patient characteristics and radiation exposure.
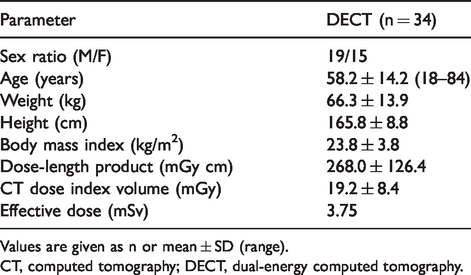
Values are given as n or mean ± SD (range).
CT, computed tomography; DECT, dual-energy computed tomography.
Objective image analysis
Post-processing of VMI+ showed an increase in the great cardiac vein attenuation from higher to lower tube voltage levels (100keV to 40keV), with a statistically significant difference (P < 0.001), and the attenuation at 40 keV VMI+ was also higher than that for F_0.6 images (Fig. 2). The evaluation of both great cardiac vein levels in all patients revealed the highest mean signal attenuation at 40 keV VMI+ (493.5 ± 157.1 HU at level I and 457.7 ± 165.4 HU at level II), which was statistically significant (P < 0.001). Image noise also peaked at 40 keV VMI+ (P < 0.001), with a decrease from 40 keV VMI+ (39.1 ± 14.9 HU) to 100 keV VMI+ (10.9 ± 3.6 HU). The F_0.6 image noise (14.0 ± 5.2 HU) was similar to the 80 keV VMI+ image noise and slightly higher than the 100 keV VMI+ image noise (Fig. 3).
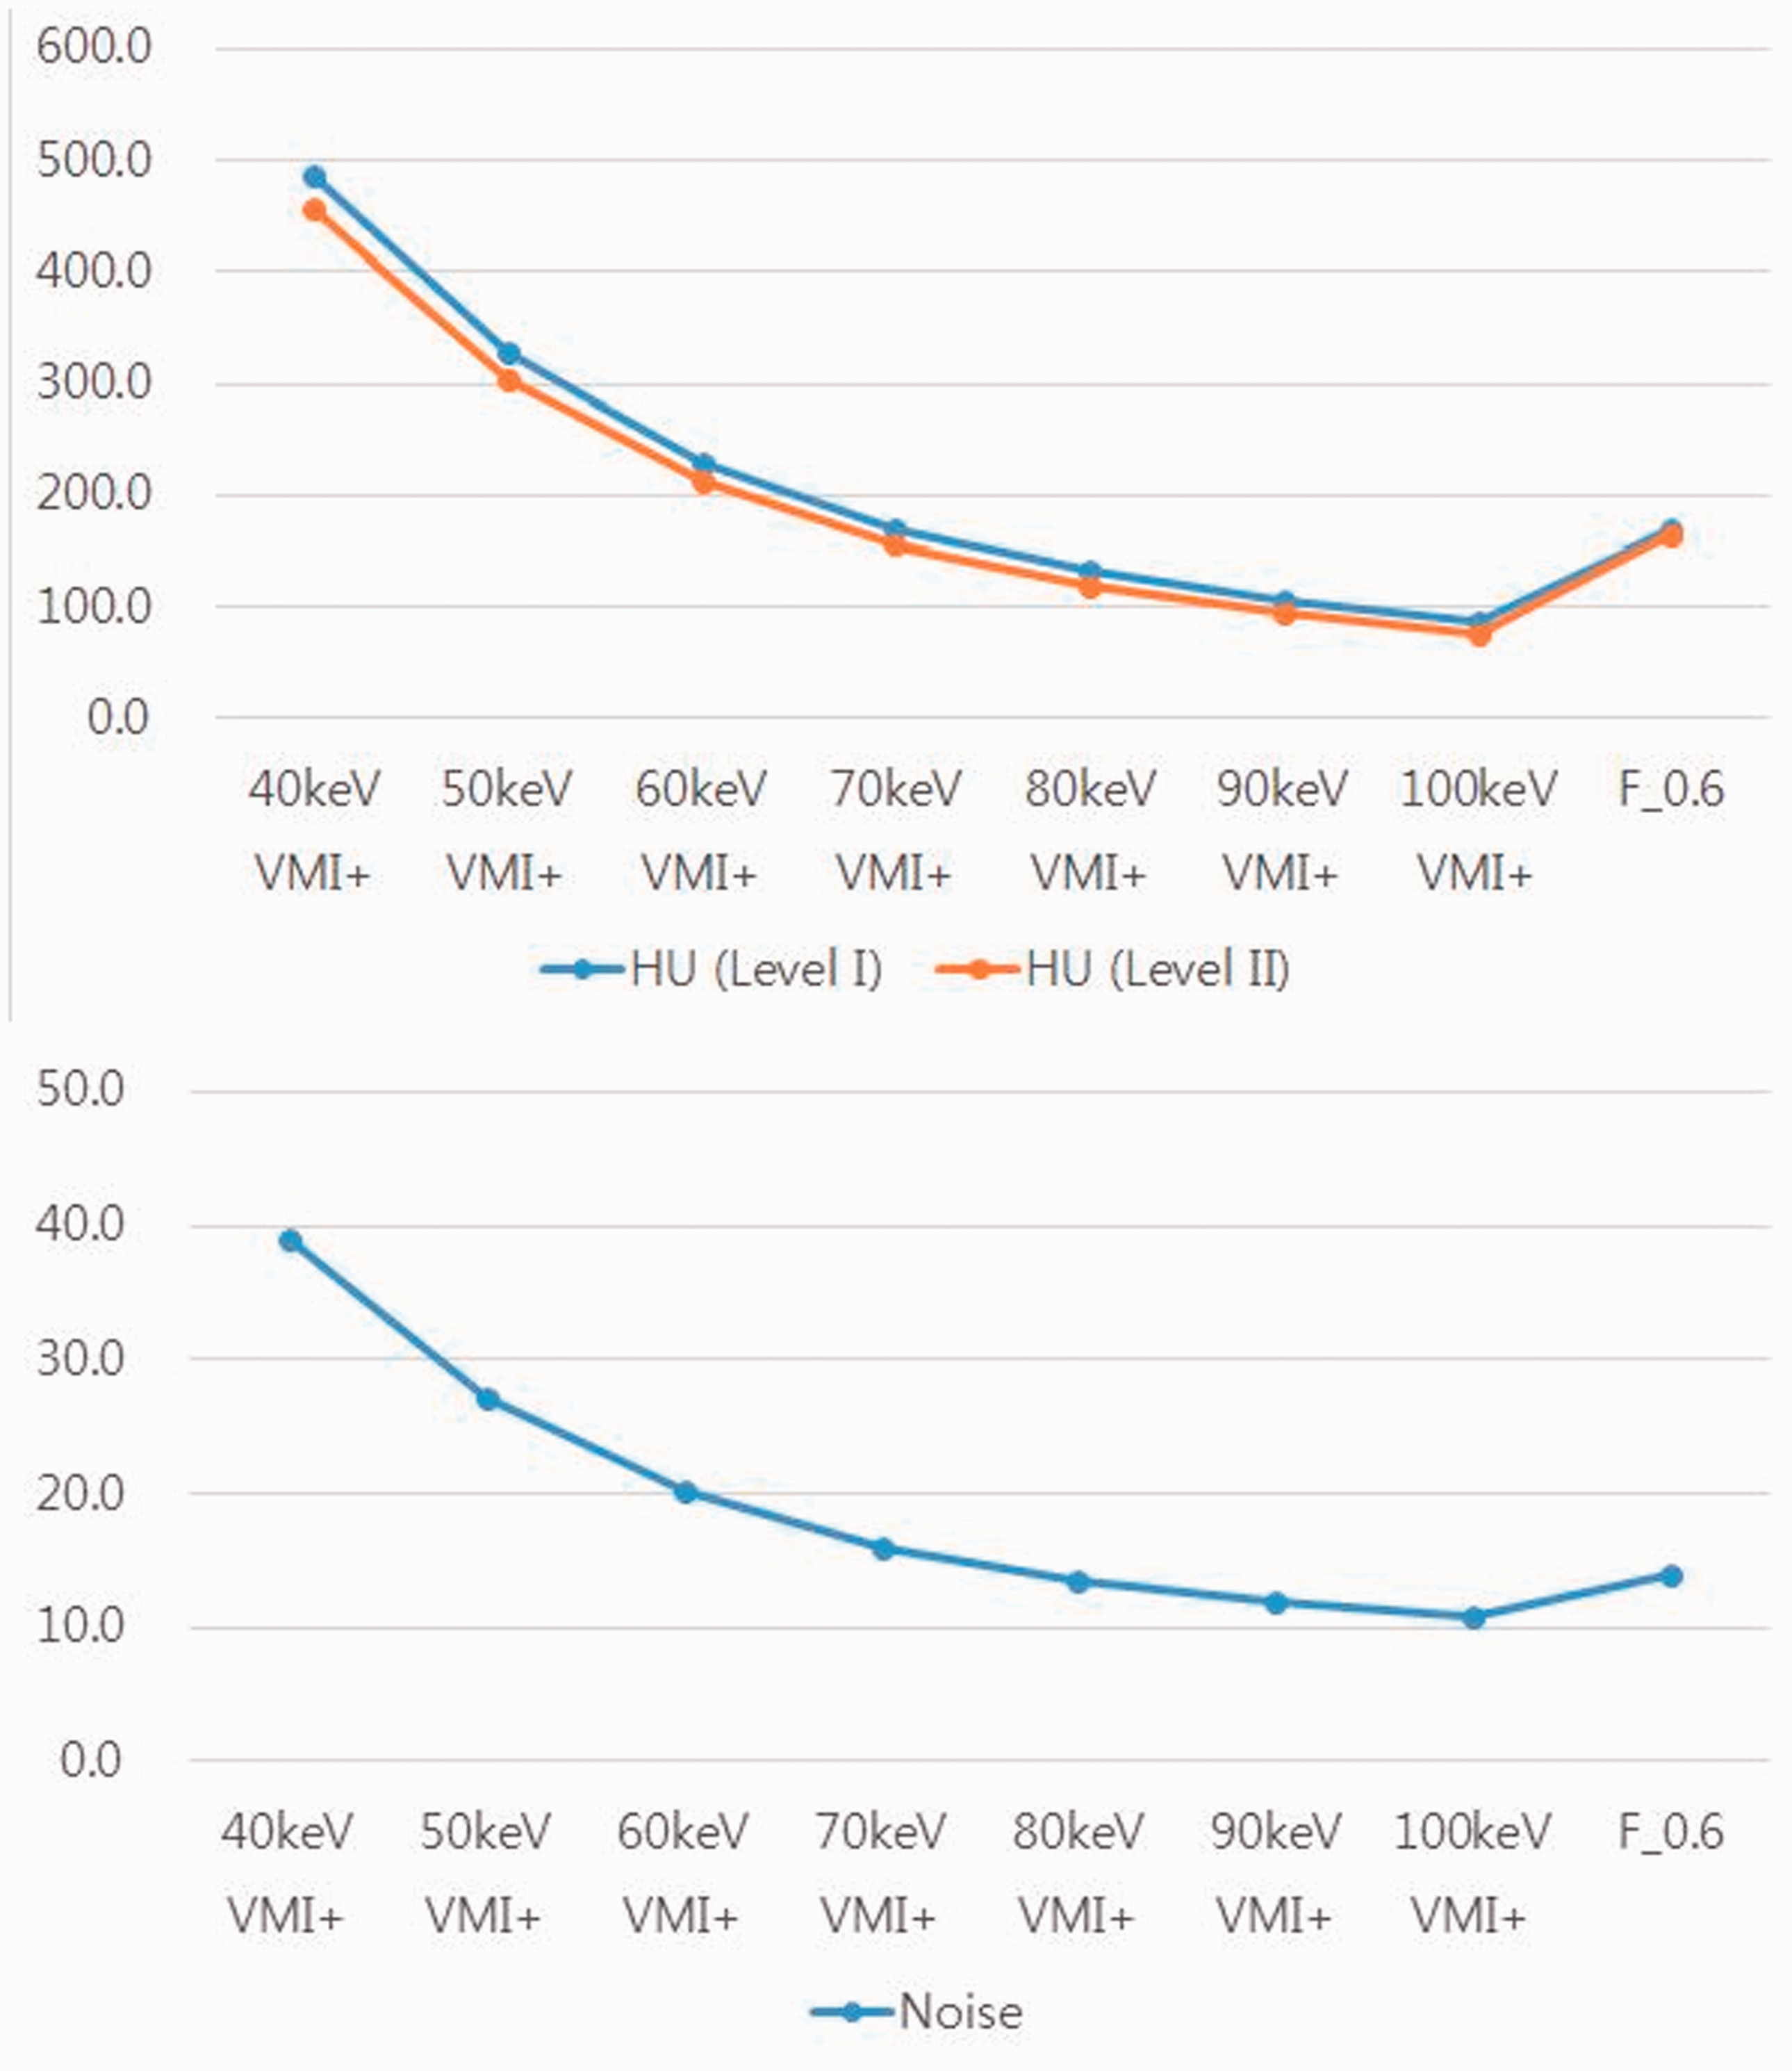
Attenuation (HU) and image noise peaked at 40 keV VMI+ compared to that at other tube voltages in the F_0.6 images. HU, Hounsfield unit; VMI, virtual monoenergetic image.
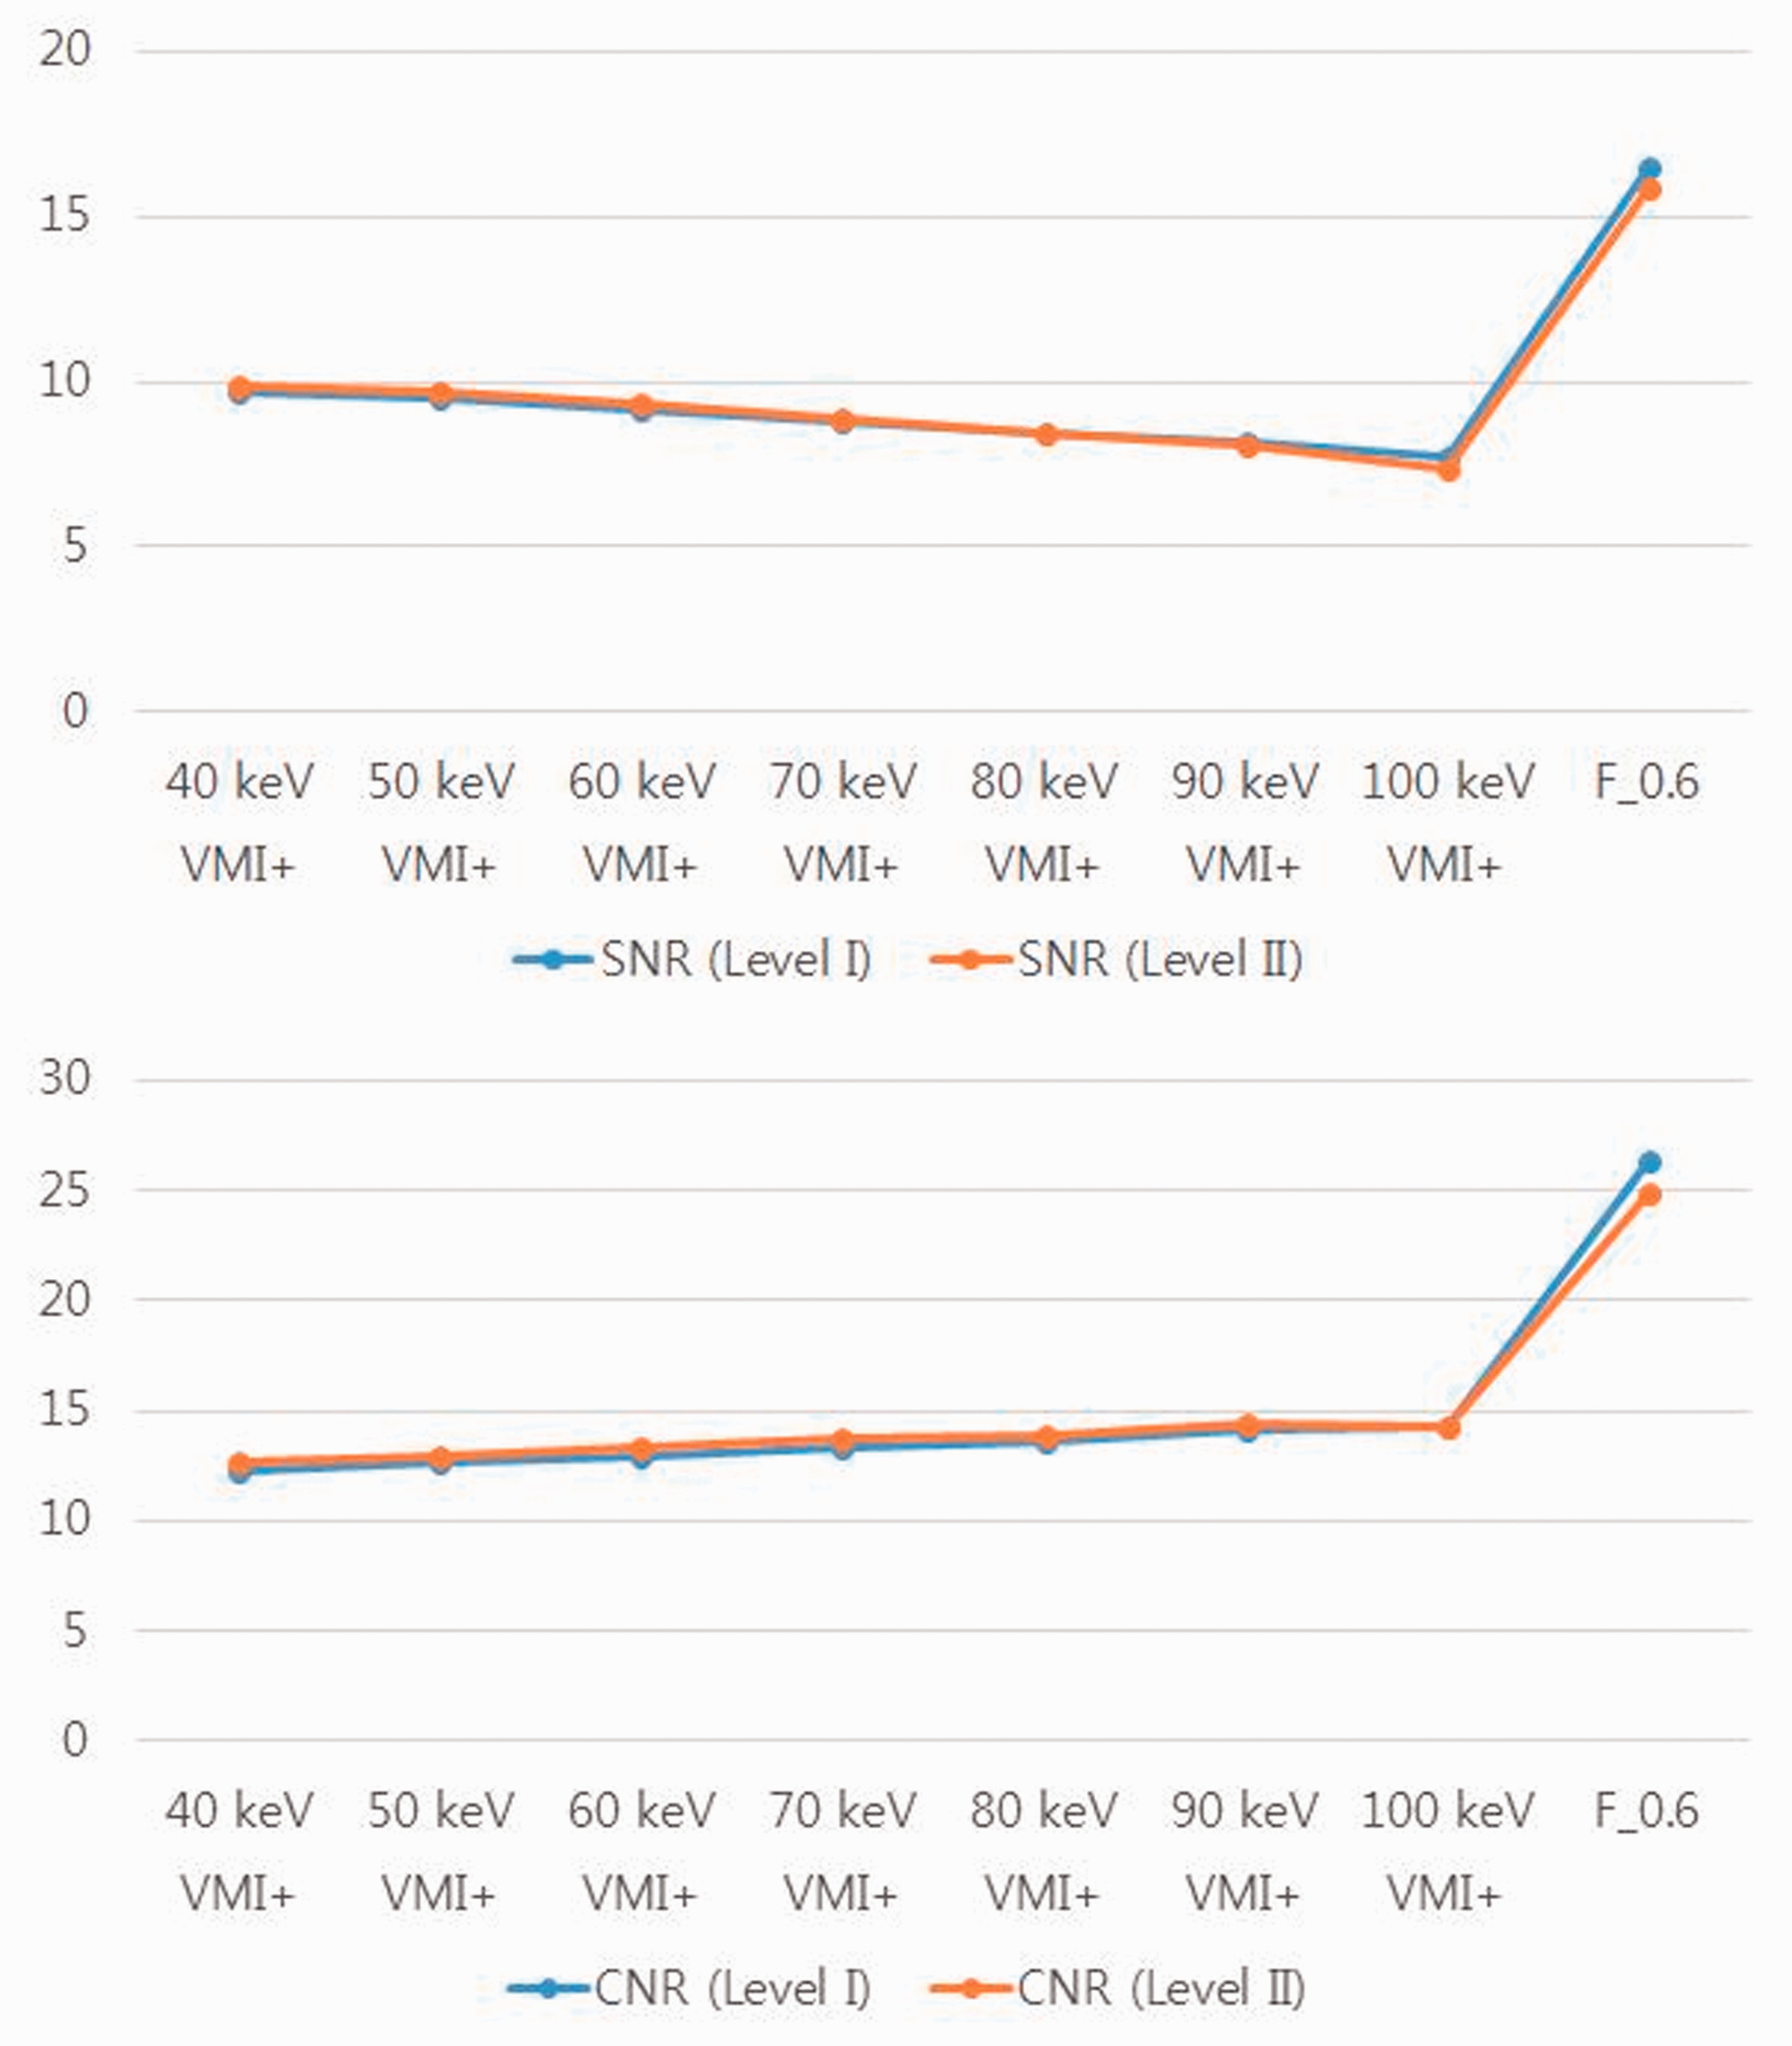
SNR peaked at 40 keV in the VMI+ compared to that at other tube voltages; however, the SNR was significantly higher in the F_0.6 images than in VMI+. CNR peaked at 100 keV VMI+, but this was not significantly different compared to other voltages. The comparison of the 100 keV VMI+ to F_0.6 images shows that CNR was significantly higher for F_0.6 images than for VMI+. CNR, contrast-to-noise ratio; SNR, signal-to-noise ratio; VMI, virtual monoenergetic image.
The SNR calculation revealed that the 40 keV VMI+ had the highest SNR value with a statistically significant difference (9.7 ± 5.1 at level I, 9.9 ± 4.4 at level II) compared with images at higher tube voltages. The SNR, however, was significantly higher in the F_0.6 images (16.5 ± 6.6 at level I, 15.9 ± 6.2 at level II) than in the 40 keV VMI+ (P < 0.001).
The highest calculated CNR value was at 100 keV VMI+ (14.3 ± 5.4 at level I and 14.3 ± 7.7 at level II), but it was not significantly different from that at lower tube voltage levels. The comparison of 100 keV VMI+ to F_0.6 images showed that the CNR was significantly higher in the F_0.6 images (26.4 ± 9.7 at level I and 24.9 ± 9.0 at level II) (P < 0.001). All objective image analysis results are shown in Table 2 and Figs. 2 and 3.
Mean attenuation, calculated SNR, and CNR in patients with chest pain.

Values are given as mean ± SD.
*Compared with 40 keV VMI+.
†Compared with 100 keV VMI+.
CNR, contrast-to-noise ratio; SNR, signal-to-noise ratio; VMI, virtual monoenergetic image.
Subjective image analysis
The subjective image quality scores for great cardiac vein visibility in the VMI+ images were highest at 40 keV VMI+; however, there was no significant difference among 40, 50, and 60 keV VMI+. A subjective comparison of 40 keV VMI+ to F_0.6 images showed that the F_0.6 images had the best scores, with substantial inter-observer agreement (ICC = 0.67). The subjective image analysis results are shown in Table 3.
The subjective image quality scores for great cardiac vein visibility.

Values are given as median (range).
Discussion
The aim of the present study was to compare the objective and subjective image quality of F_0.6 image algorithm and VMI+ algorithm for cardiac vein assessment in patients with chest pain. The quantitative image quality parameters of the VMI+ algorithm, including vein attenuation, noise, and SNR, peaked at 40 keV, with significant differences compared to those at 50–100 keV. F_0.6 images had substantially lower noise values than the 40 keV VMI+, and both SNR and CNR were significantly higher for F_0.6 images. The F_0.6 images had the highest scores for subjective image analysis of great cardiac vein visibility; however, there were no significant differences at 40–60 keV. Thus, our results emphasize the improved performance of the F_0.6 algorithm in terms of objective and subjective image quality for cardiac vein evaluation. Several methods exist for imaging the coronary venous system, and each method has its own advantages and disadvantages (1,10,11). For example, with the developments in the field of coronary artery magnetic resonance imaging (MRI), MRI has recently been used for coronary venous imaging (12). It has the advantage of combining morphology, function, and information about myocardial scarring as well as asynchrony with only one examination (13). However, it is time-consuming and expensive when compared to DECT. If the focus of the examination is to visualize the anatomy and determine the cause of chest pain, DECT with F_0.6 algorithm is sufficient.
The term “dual-energy CT” refers to a CT scanner which utilizes two photon spectra (14). A variety of techniques, including monoenergetic extrapolation, are possible with the application of two different X-ray energy spectra or tube voltages in DECT (15). There are five approaches to DECT, including sequential acquisition, rapid voltage switching, DSCT, layer detectors, and energy-resolving or quantum-counting detectors. However, only the first three approaches are currently commercially available. Hence, we used the dual-source DECT for the present study. A simple approach involves DSCT with two tubes running at different voltages, and the corresponding detectors mounted orthogonally in one gantry, allowing for simultaneous data acquisition by both orthogonal systems (14). Since the introduction of DECT, various post-processing techniques have been developed, such as VMI and linearly blended images (16,17).
The main objective of the VMI algorithm is to enhance iodine attenuation at lower tube voltages while maintaining low image noise (9). VMI has provided beneficial results such as high attenuation at lower tube voltages. However, the application of the algorithm is limited by high image noise, resulting in inferior CNR values. Consequently, the VMI+ algorithm was developed, delivering optimal objective image quality at the lowest possible energy level (40 keV) (7).
Another post-processing algorithm, M_0.6, reconstructs images with a blending ratio of 0.6, merging 60% of the lower peak kilovoltage data and 40% of the higher peak kilovoltage spectrum, representing the standard 120 kVp single-energy CT (7). Several previous studies revealed that the M_0.6 algorithm does not achieve equivalent or higher attenuation than the VMI+ algorithm at low keV and is therefore inferior to it (8). Recently, a noise-optimized, linearly blended algorithm, reconstructed with a blending factor of 0.6 (F_0.6), was developed. F and M images (standard linearly blended images) are potentially different from images with filters that are applied after reconstruction. F images utilize all the statistical information in one run, resulting in lower image noise than that of M images. Therefore, noise-optimized linearly blended imaging can improve SNR and CNR by reducing the image noise, although it does not deliver attenuation equivalent to standard linearly blended imaging.
Many studies have demonstrated the superior image quality of the VMI+ algorithm compared to that of the traditional VMI algorithm, particularly in oncological imaging (9,16,18,19) or in imaging of different body regions including the pulmonary arteries, aorta, liver, or pancreas (20–23). Furthermore, another study revealed that the VMI+ algorithm improved the objective and subjective image quality in lymphoma imaging compared to both the traditional VMI algorithm and the standard linearly blended imaging (9). To our knowledge, no studies have investigated noise-optimized linearly blended imaging and evaluated the impact of the VMI+ algorithm on objective and subjective image quality for cardiac vein assessment. The present study demonstrated that 40 keV VMI+ is superior than 50–100 keV VMI+ for attenuation and obtaining optimal SNR. The reduced image noise achieved with the F_0.6 algorithm resulted in a significantly higher SNR and CNR than those obtained using 40 keV VMI+, and an assessment of the subjective image quality also showed superior results for F_0.6 images. Fig. 4 illustrates imaging in the axial view that displays the present findings. We believe that these results are due to the differences between the arterial and venous anatomies. Arteries may potentially achieve higher attenuation with a lower tube voltage spectrum; however, the degree of attenuation for veins is limited when compared to arteries. Therefore, noise reduction is more important than higher attenuation to achieve excellent vein image quality. In other words, when evaluating the cardiac vein with DECT, image noise reduction is more important than achieving higher attenuation across the low tube voltage spectrum.
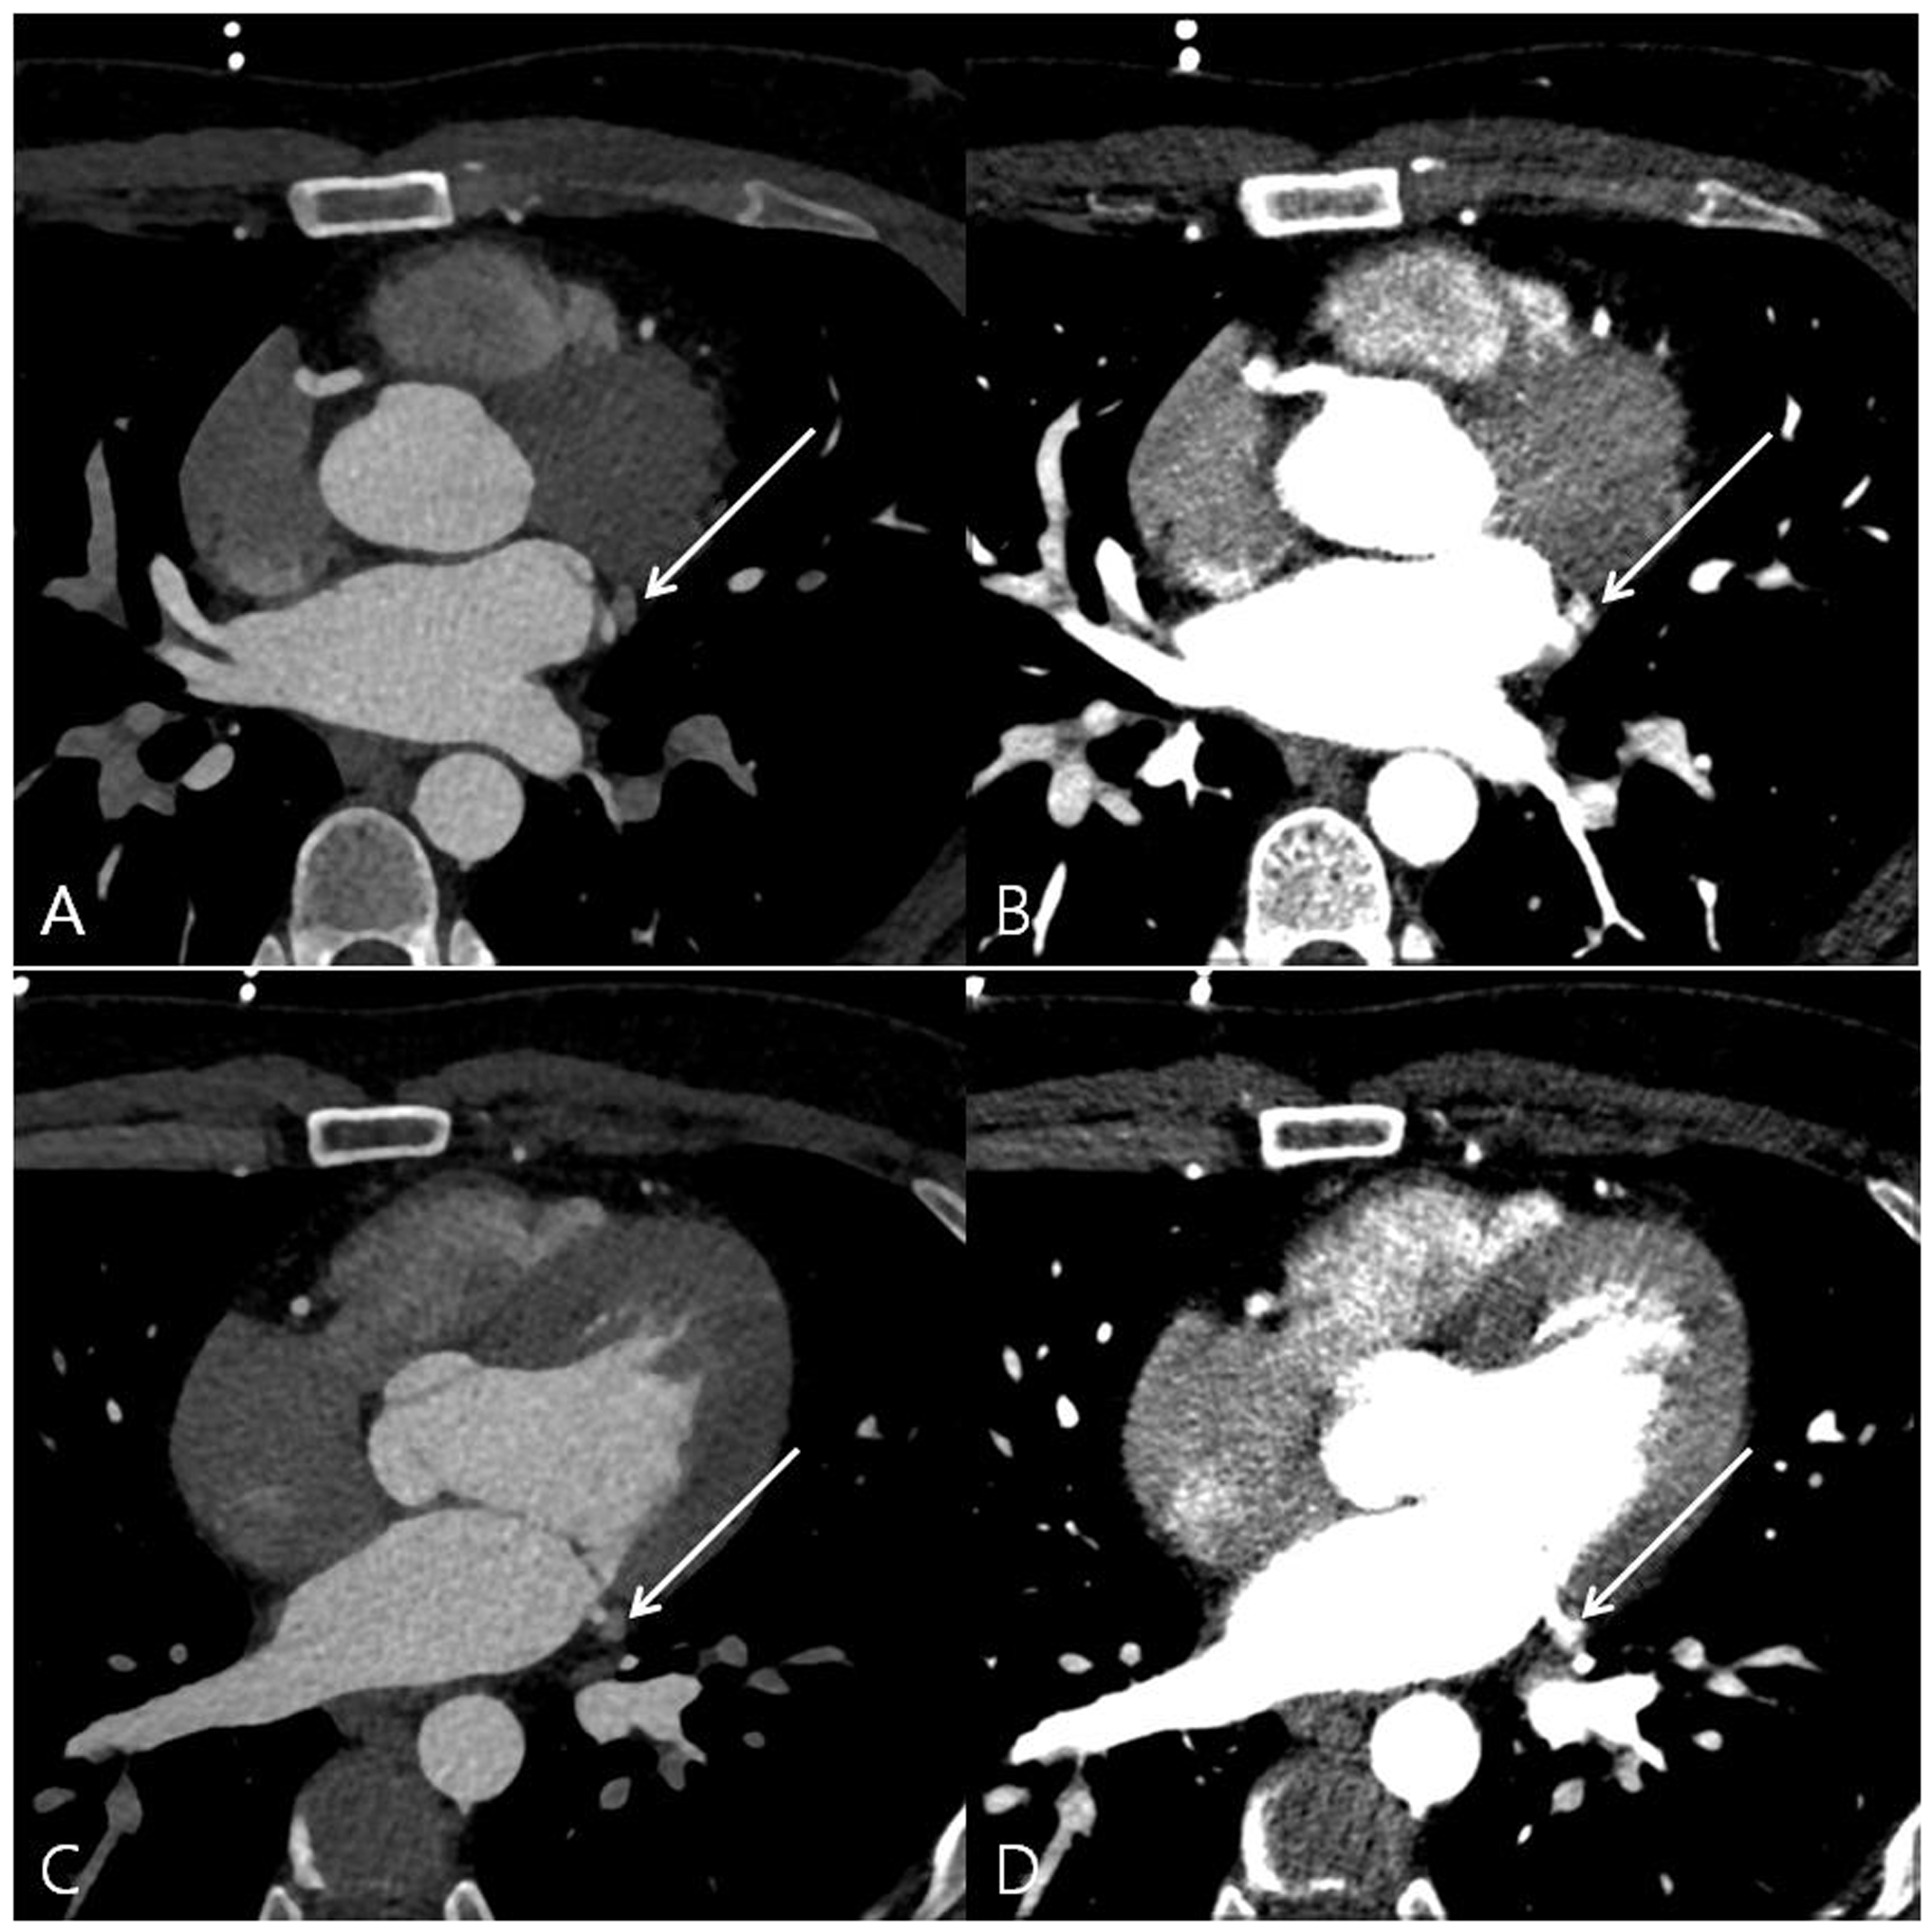
An example of a 30-year-old male patient with chest pain. The F_0.6 image with preset standard window settings (level = 300; width = 800) shows better visibility of the great cardiac vein at both level I (a) and II (c) than the 40 keV VMI+ (b, d). VMI, virtual monoenergetic image.
The present study has several limitations. First, the study was retrospective and the number of enrolled patients was small. Second, we enrolled patients with only chest pain and did not include patients with cardiac diseases such as arrhythmia or heat failure. Clinically, cardiac CT angiography may be more frequently used in patients with arrhythmia or heart failure. Therefore, the image quality of patients with cardiac diseases may differ from that obtained in our study.
In conclusion, we optimized the quality of F_0.6 images obtained with dual-source DECT and found it to be superior compared to that of similarly acquired VMI+. Therefore, we believe that the F_0.6 algorithm provides a clear benefit and should be utilized for cardiac vein imaging.
Footnotes
Declaration of conflicting interests
The author(s) declared no potential conflicts of interest with respect to the research, authorship, and/or publication of this article.
Funding
The author(s) received the following financial support for the research, authorship, and/or publication of this article: This study was supported by the DongKook Life Science. Co., Ltd., Republic of Korea.
