




Abstract
Background
Susceptibility-weighted imaging (SWI) is occasionally performed with intravenous gadolinium (Gd). It was reported that SWI can be performed after Gd injection without information loss or signal change.
Purpose
To investigate the diagnostic value of contrast-enhanced SWI (CE-SWI) in the assessment of intracranial brain neoplasm.
Material and Methods
After obtaining the approval of the local ethics committee, 35 brain neoplasm patients (24 with metastasis and 11 with glioblastoma multiforme [GBM]) were enrolled. In order to investigate the value of using CE-SWI, two neuroradiologists performed an evaluation of the frequency of the intratumoral susceptibility signals (ITSS) in SWI and CE-SWI with visual assessment using 5-grade scales. We evaluated the visibility of the tumor margins and the internal architecture of tumors on T1-weighted imaging (T1WI), contrast-enhanced T1 (CE-T1), SWI, and CE-SWI.
Results
The contrast-enhanced scans (CE-T1 and CE-SWI) showed statistically significant higher scores compared to non-enhanced scans (T1WI and SWI) for the analysis of the tumor margin in GBM and metastasis (P < 0.05, Wilcoxon signed rank test). Statistically significant higher scores are noted in GBMs compared to metastases in the visibility of the internal architecture of tumors on CE-SWI and the visibility of the tumor margin on CE-T1 (P < 0.05, Mann–Whitney test).
Conclusion
Based on our results, SWI can be performed after gadolinium injection without information loss or signal change. CE-SWI is useful in evaluating intracranial neoplasm due to its ability to simultaneously demonstrate both ITSS that are not visible with conventional magnetic resonance sequences and contrast enhancement.
Introduction
Susceptibility-weighted imaging (SWI) is a method of magnetic resonance imaging (MRI) that utilizes the susceptibility differences between tissues. These are three-dimensional (3D), spoiled gradient-echo sequences that use both magnitude and phase images, which provide high sensitivity for the detection of blood degradation products, calcifications, and iron deposits (1–4). SWI provides the enhancement of small vessels and microhemorrhages and the detection of iron in the brain. These characteristics allow SWI to demonstrate the anatomical and functional heterogeneity of brain tumors with exquisite sensitivity to blood products and venous vasculature (5–7). SWI is occasionally performed with intravenous gadolinium (Gd). In previous studies (8,9), it was reported that SWI can be performed after Gd injection without information loss or signal change. The aim of the present study was to investigate the benefit of using contrast-enhanced SWI (CE-SWI) in the assessment of intracranial brain neoplasm.
Material and Methods
After obtaining the approval of the local ethics committee (from January to December 2016), we retrospectively reviewed the brain MR images of 35 consecutive eligible patients (6 women, 29 men, age range = 52–83 years; mean age = 68.9 years at the time of diagnosis) with brain tumor lesions. The inclusion criteria for the selection of patients were as follows: (i) patients were referred for the preoperative or pretreatment assessment of brain tumor detected on conventional MRI; and (ii) patients underwent MR examinations that included SWI and CE-SWI on a 3T MR imager. Pathologic specimens had been obtained by means of either stereotactic resection or stereotactically guided biopsy. Histopathologic analysis of a resected tissue confirmed the diagnosis of glioblastoma multiforme (GBM) in 11 patients and brain metastasis (10 non-small cell lung carcinoma, five small cell lung carcinoma, two renal cell carcinoma [RCC], two breast carcinoma, one hepatocellular carcinoma, one melanoma, one follicular cell thyroid carcinoma, one gastric carcinoma, and one serous ovary carcinoma) in 24 patients.
MRI was performed on a 3T system (Siemens, Skyra, Erlangen, Germany) equipped with a 20-channel head coil. The MRI protocol included diffusion-weighted image (DWI) (TR/TE = 4700/66 ms, flip angle [FA] = 180°), gradient-echo image (TR/TE= 550/13 ms, FA = 20°), FLAIR (TR/TE = 9000/95 ms, FA = 150°), T2-weighted imaging (T2WI) (TR/TE = 4540/96 ms, FA = 150°), pre- and postcontrast T1-weighted imaging (T1WI)s (TR/TE = 2000/13 ms, FA = 150°), and pre- and postcontrast SWIs. The SWI sequence parameters for 3T Siemens Skyra are shown in Table 1. The SWI postprocessing schemes were single-echo SWI processing involving background phase removal using the homodyne method, generation of a phase mask, and conventional linear mask function. We also performed a contrast-enhanced SWI (CE-SWI) and contrast-enhanced T1WI (CE-T1) for brain tumors routinely. The acquisition time was 205 s for SWI and 205 s for CE-SWI. The total acquisition time of the MRI scan for brain tumors was 24–25 min (Table 2). This was a reasonable time for imaging of the brain tumor.
SWI sequence parameters for 3T Siemens Magnetom Skyra magnet.
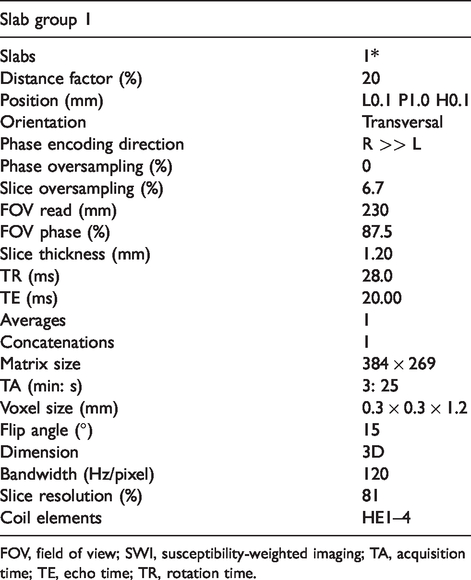
FOV, field of view; SWI, susceptibility-weighted imaging; TA, acquisition time; TE, echo time; TR, rotation time.
The total acquisition time of the MRI scan for brain tumors.

Values are given as min: s.
FLAIR, fluid-attenuated inversion recovery; SWI, susceptibility-weighted imaging; T1WI, T1-weighted imaging; T2WI, T2-weighted imaging.
The contrast agent used was gadoterate meglumine (Dotarem, Guerbet, Paris, France). A standard dose of gadoterate meglumine (0.1 mmol/kg body weight) was administered before the acquisition of CE-T1 and CE-SWI.
All the MR images were consensually evaluated and scored independently by two neuroradiologists with 15 years and 6 years of experience in neuroradiology. In cases of disagreement, the images were reviewed in consensus. Each of the two observers reviewed the MR images of 35 patients with brain tumors in order to assess the benefit of the use of CE-SWI for the evaluation of brain tumors. In the review, the observers were provided with MR images, including T1WI, CE-T1, SWI, and CE-SWI. The observers attempted to make a histopathologic diagnosis of the tumor type on the basis of MRI findings. A final decision was achieved by consensus.
Intratumoral calcifications or macrohemorrhages, which could cause susceptibility signals and mimic intralesional vascularity on SWI, were excluded on the basis of low signal in conventional MRI, including gradient-echo images, and susceptibility artifacts detected on DWI.
The visibility of the tumor margins and the visibility of the internal architecture of the tumor lesions on T1WI, CE-T1, SWI, and CE-SWI were evaluated. The internal architecture represents the ability of a sequence to show spatial signal heterogeneity within a lesion. The spatial signal heterogeneity within a lesion is thought to represent tissue changes that are related to the variance in structure and composition, and it was previously described as having increased in SWI (6). After contrast injection, tumor margins with BBB breakdown show enhancement and appear brighter on CE-SWI, similar to a CE-T1. The signal composition of tumor boundaries can appear different with CE-SWI compared to CE-T1 due to a variety of reasons such as the presence of hemorrhage, increased vascularity, or feeding vessels. Each category was assigned a numerical value according to a scale in the range of 0–4 as follows: grade 0 = no pertinent imaging characteristics compared with the surrounding brain parenchyma; grade 1 = poorly visualized characteristics (<25% of the tumor margins and internal architecture of the tumor lesions could be visible); grade 2 = fairly visualized characteristics (<50% of the tumor margins and internal architecture of the tumor lesions could be visible); grade 3 = good visualized characteristics (<75% of the tumor margins and internal architecture of the tumor lesions could be visible); and grade 4 = well-described, easily interpreted characteristics (>75% of the tumor margins and internal architecture of the tumor lesions could be visible) (Fig. 1).
The grades of visibility of tumor margin on SWI (a–d) (arrows). Grade 0 is defined as no pertinent imaging characteristics (a), grade 1 as poorly visualized characteristics (b), grade 2 as fairly visualized characteristics (c), and grade 3 as good visualized characteristics (d). SWI, susceptibility-weighted imaging.
Moreover, an evaluation of the frequency of the intratumoral susceptibility signals (ITSS) in the pre- and postcontrast SWIs was performed by visual assessment. ITSS was defined as a low signal intensity (SI) and a fine linear or dot-like structure, with or without conglomeration, seen within the tumor on the SWI. Histologically, the area with ITSS was defined as extensive tumor necrosis, microhemorrhages, and pathological vessels. Small vessels were cylindrical, low-signal structures that could be followed on contiguous slices, and irregular low-signal regions were assumed to represent hemorrhage on SWI. In case of an evaluation of the frequency of the ITSS, we were trying to assess cylindrical intratumoral susceptibility signals which were considered to be attributable to vascularity; other intratumoral susceptibility signals were excluded. The frequency of the ITSS was assessed and graded on a scale of 0–3: grade 0 was defined as no ITSS; grade 1 was defined as 1–5; grade 2 was defined as 6–10; and grade 3 was defined as >10 of either linear or focal foci of low SI on SWI and CE-SWI (Fig. 2).
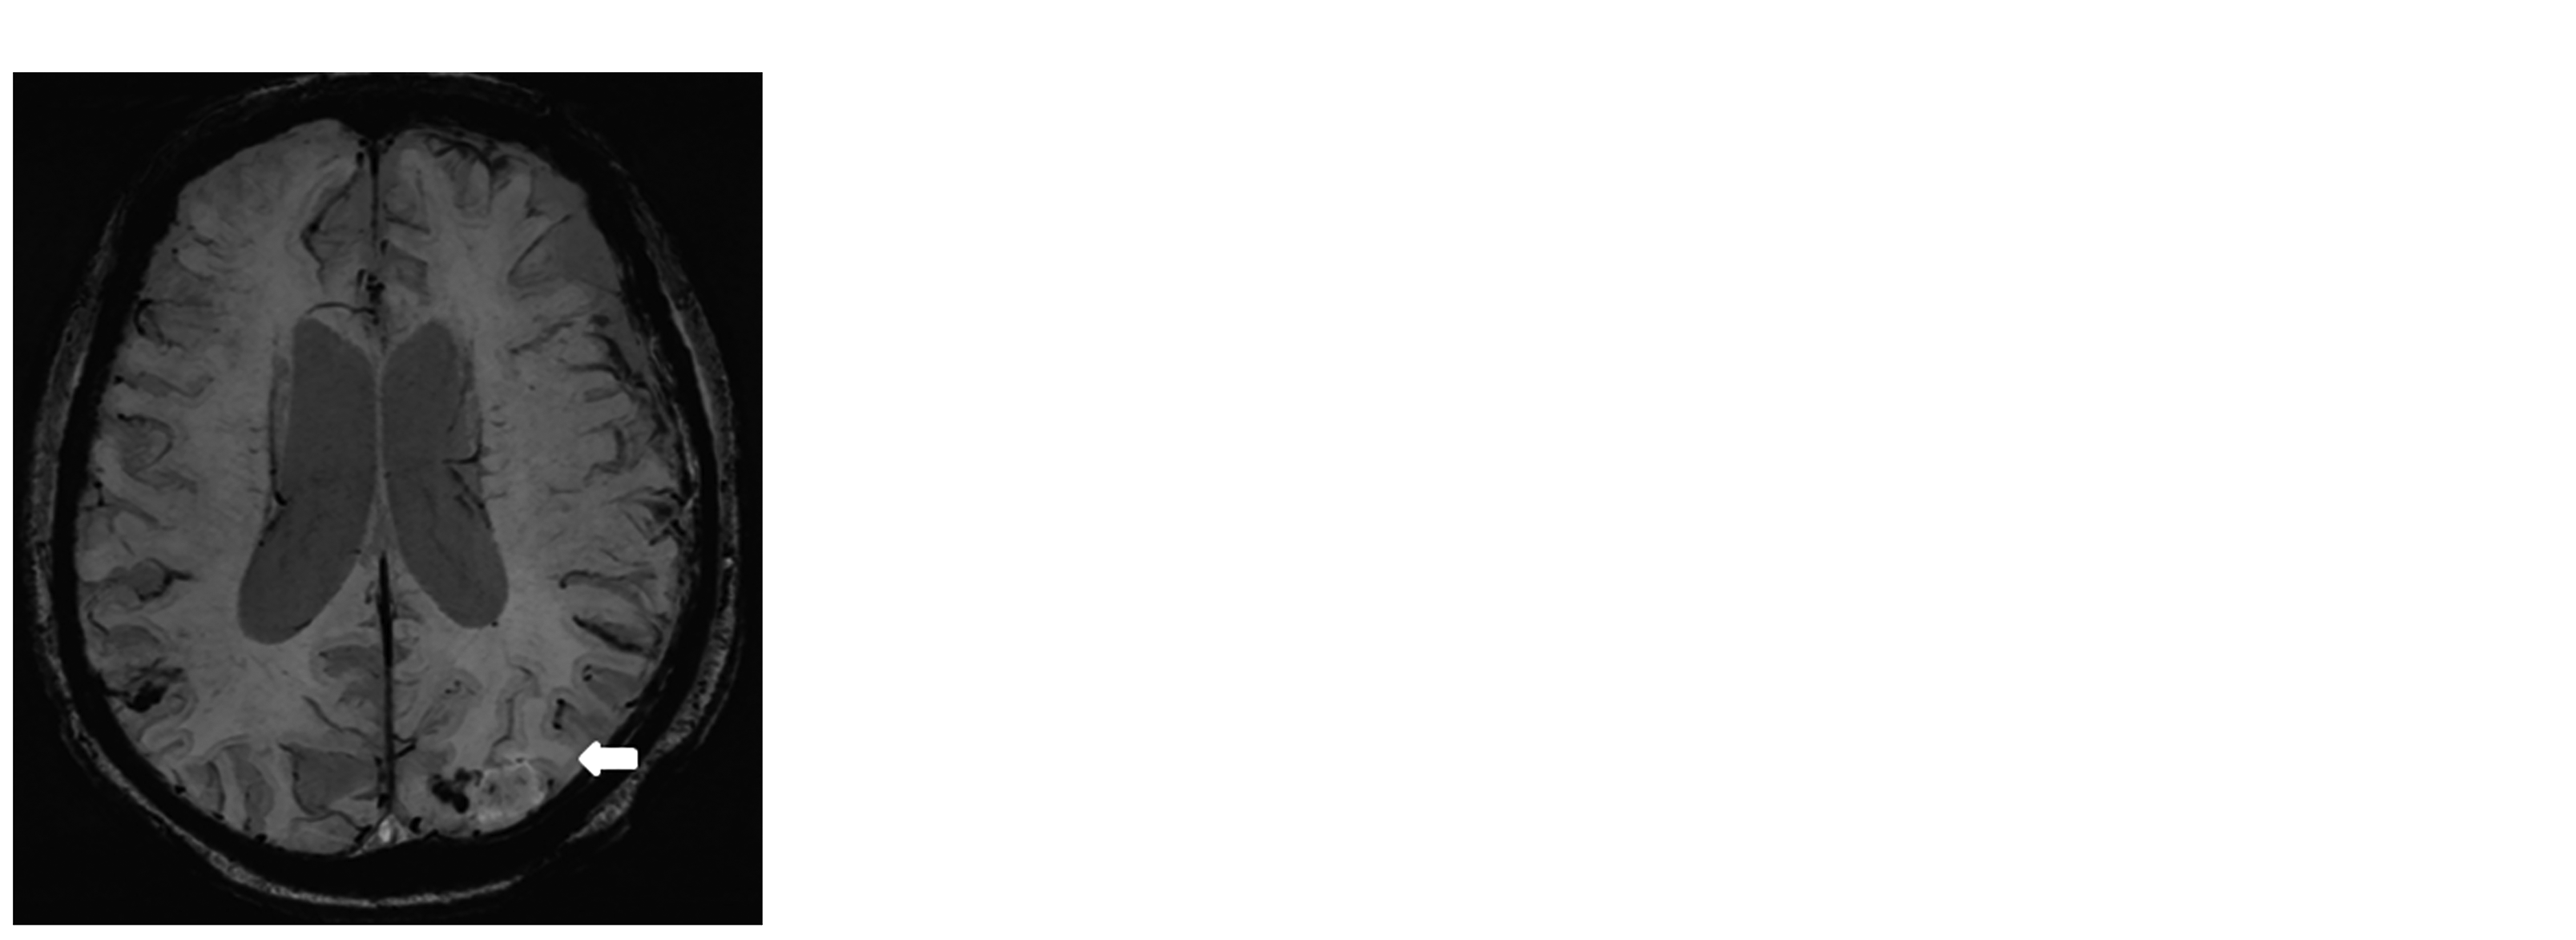
The magnetic ITSS are defined as either linear or focal foci of low signal intensity on SWI. The frequency of the ITSS is assessed and graded on a scale of 0–3 (a–c) (arrows). Grade 0 is defined as no ITSS, grade 1 as 1–5 (a), grade 2 as 6–10 (b), and grade 3 as >10 (c) of either linear or focal foci of low signal intensity on the SWI (arrows). ITSS, intratumoral susceptibility signals; SWI, susceptibility-weighted imaging.
For the statistical analysis, Statistical Package for the Social Sciences (SPSS) version 11.0 (SPSS, Chicago, IL, USA) was used. For the statistical assessment of the comparison of each sequence’s ratings of the visibility of the tumor margins and the visibility of the internal architecture of the tumors, the Wilcoxon signed rank test was used. For the statistical assessment of the comparison of each sequence’s ratings of the visibility of the tumor margins and the visibility of the internal architecture and ITSS of each tumor’s pathology, the Mann–Whitney test was used.
Results
There was no significant difference in the mean scores of the grading of the ITSS of the tumors on SWI and CE-SWI (Table 3). The results of the mean scores of the grading of the visibility of the tumor margins and the visibility of the internal architecture of the tumors in all four sequences are presented in Table 4.
The mean score of the grading of the ITSS (paired T-test).*

*The grading system is as follows: 0 = no ITSS, 1 = 1–5 ITSS, 2 = 6–10 ITSS, and 3 = >10 ITSS.
†Reference value: P < 0.05.
CE, contrast-enhanced; ITSS, intratumoral susceptibility signals; intratumoral susceptibility signals; SWI, susceptibility-weighted imaging.
The mean score of the grading of the visibility of tumor margins and the internal architecture of tumors.*
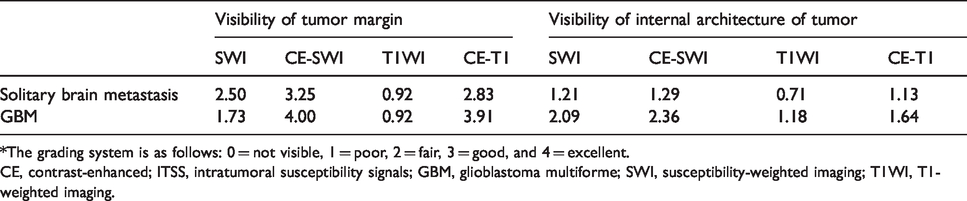
*The grading system is as follows: 0 = not visible, 1 = poor, 2 = fair, 3 = good, and 4 = excellent.
CE, contrast-enhanced; ITSS, intratumoral susceptibility signals; GBM, glioblastoma multiforme; SWI, susceptibility-weighted imaging; T1WI, T1-weighted imaging.
CE-SWI showed statistically higher values than SWI with regard to the visibility of the tumor margin of the GBMs and brain metastases (P < 0.05, Wilcoxon signed rank test) (Table 5) (Fig. 3).
Statistical analysis of the grading score of the visibility of tumor margins and the internal architecture of GBM and metastasis (P < 0.05, Wilcoxon signed rank test).*

*Postcontrast T1WI: CE-T1; postcontrast SWI: CE-SWI.
†Reference value: P < 0.05.
CE, contrast-enhanced; ITSS, intratumoral susceptibility signals; N/S, no statistical difference; SWI, susceptibility-weighted imaging; T1WI, T1-weighted imaging.
A 72-year-old male patient with GBM. (a) The lesion is barely visible with poor degree tumor margin delineation on T1WI (arrow, grade 1). (b) Postcontrast T1WI shows intratumoral heterogeneity (arrow, grade 4). Strong enhancement sharply delineates the margins of the lesion (grade 4). (c) Grade 2 ITSS indicates 6–10 dot-like or linear low intensity structures on SWI (arrowhead). (d) Postcontrast SWI shows the internal structure and the margins of the lesion more clearly than non-contrast SWI (arrow, grade 4). GBM, glioblastoma multiforme; SWI, susceptibility-weighted imaging; T1WI, T1-weighted imaging.
The CE-SWI scan was statistically superior to that of T1WI and CE-T1 with regard to the visibility of the internal architecture of tumors in GBM. In addition, the CE-SWI scan was statistically superior to that of T1WI with regard to the visibility of the internal architecture in metastases (Fig. 4). There was no statistical difference between CE-SWI and CE-T1 with regard to the visibility of the internal architecture of the brain metastases (P < 0.05, Wilcoxon signed rank test) (Table 5).
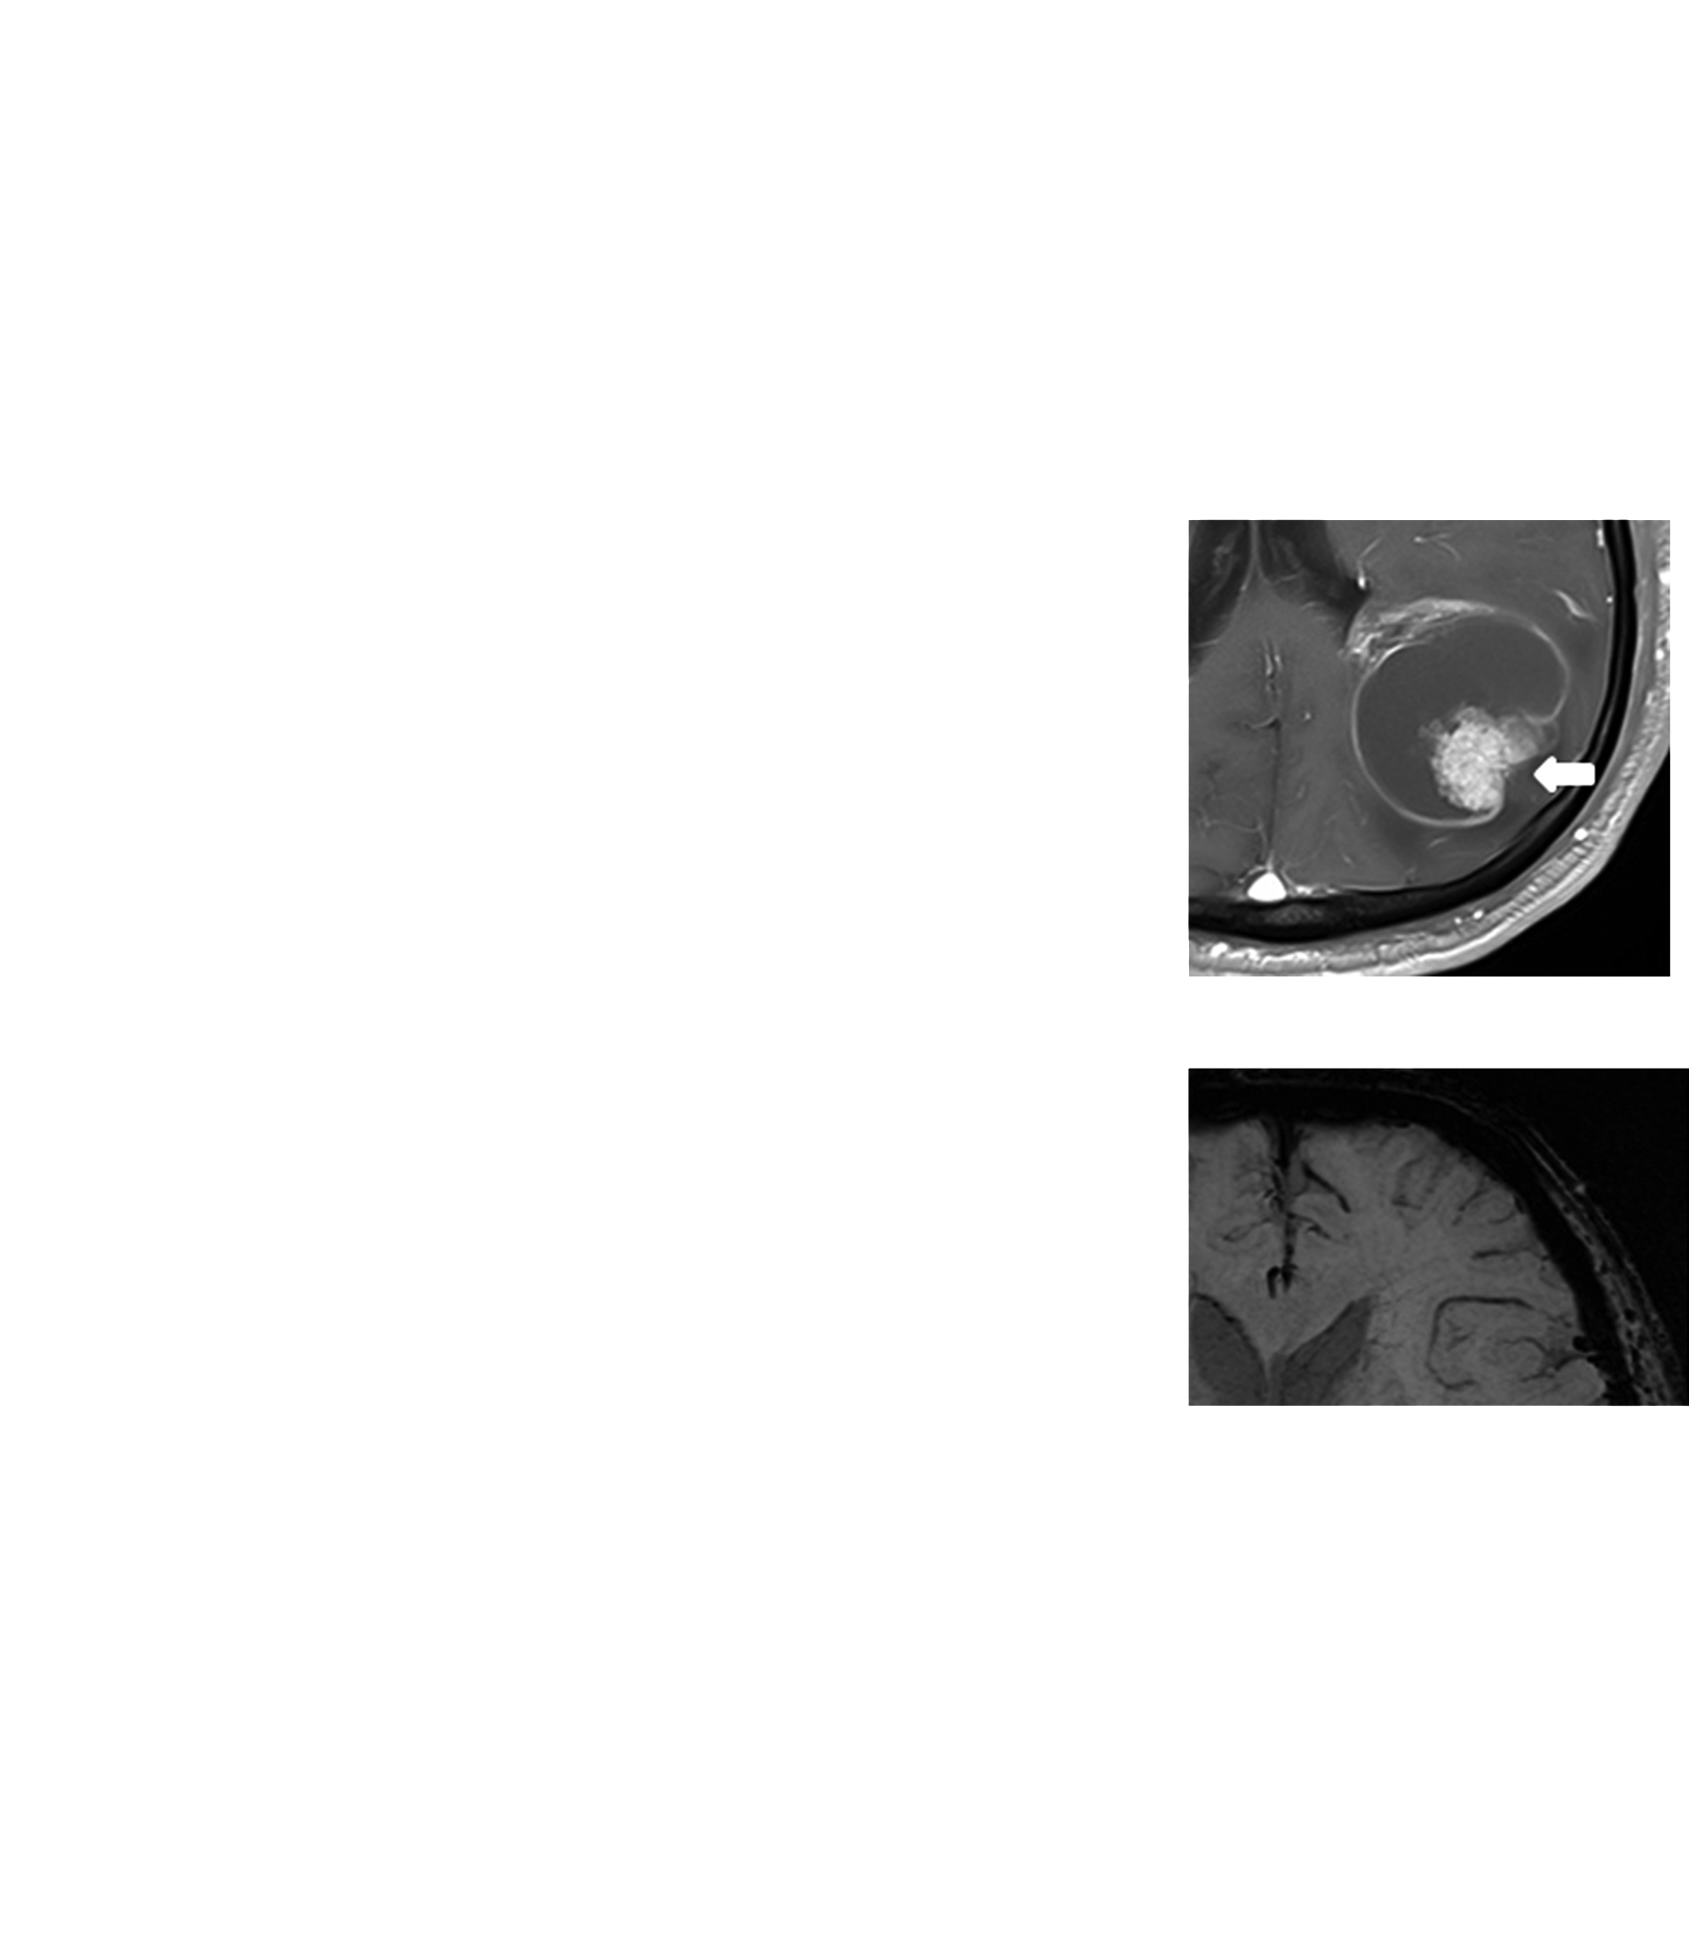
A 68-year-old male patient with brain metastasis of lung adenocarcinoma. (a) The lesion is barely visible with poor degree tumor margin delineation on T1WI (arrow). (b) Postcontrast T1WI. Strong enhancement sharply delineates the margins of the lesion (grade 4). Intense enhancing solid component and no enhancing necrotic portion are seen (arrow). (c) Marked hypointense foci are seen in a solid part of the lesion on SWI, suggesting an increased venous vasculature and hemorrhages (arrow). (d) Postcontrast SWI. Low signal foci are visible, which are interpreted to be hemorrhage with good degree tumor margin (arrow). Moreover, bright enhancement indicating both tumor parenchyma and breakdown of the blood–brain barrier are seen along the tumor (black arrow). SWI, susceptibility-weighted imaging; T1WI, T1-weighted imaging.
With regard to the statistical analysis of the pathological comparison of the tumors, statistically significant differentiation was achieved between brain metastases and GBMs by using the grading of the visibility of the internal architecture of the tumors on CE-SWI and by using the grading of the visibility of the tumor margins on the CE-T1 scan. In comparison with brain metastases, GBMs showed significantly higher scores of visibility of tumor margin on CE-T1 and significantly higher scores of visibility of the internal architecture of the tumor on CE-SWI (P < 0.05, Mann–Whitney test) (Table 6).
Statistical analysis of the pathological comparison of the grading of the visibility of tumor margins, the internal architecture of tumors (P < 0.05, Mann–Whitney test).
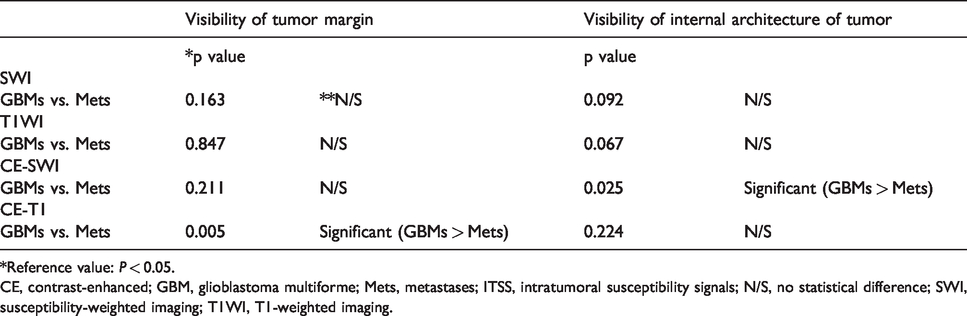
*Reference value: P < 0.05.
CE, contrast-enhanced; GBM, glioblastoma multiforme; Mets, metastases; ITSS, intratumoral susceptibility signals; N/S, no statistical difference; SWI, susceptibility-weighted imaging; T1WI, T1-weighted imaging.
Discussion
The present study illustrates that SWI could be performed with contrast enhancement without signal loss or signal cancellation and that CE-SWI is significantly useful to intracranial tumor characterization due to its unique sensitivity to blood products and venous vasculature.
As shown in a previous report (10), SWI is much more sensitive in terms of showing blood products, calcifications, and venous vasculature, which usually appear as low SI structures on SWI. These low SI structures detected with SWI may not be obvious with conventional MRI, but they could be useful in tumor characterization, tumor grading, or diagnosis of a specific tumor type (11–14). SWI is occasionally performed with intravenous Gd. A high concentration of paramagnetic contrast medium may influence the SWI data due to T2 shortening and additional signal loss (15,16). In fact, unlike the other MRI sequences, both enhancement and signal cancellation may be seen on CE-SWI, depending on the condition of the pathological lesion. When the blood–brain barrier (BBB) broke down, contrast enhancement was evident on CE-SWI, which was similar to what was noted on CE-T1. However, after the administration of Gd, brain parenchymal intensity was significantly reduced, thereby suggesting that intravascular contrast media reduce the intensities of vascular structures and surrounding tissues because of a T2* effect (17,18). El-Koussy et al. (19) demonstrated that there was neither quality degradation nor signal contamination observed after the Gd injection in the normal brain because the intact BBB prevented the passage of the Gd through the extravascular space. In one study (20), the magnitudes of the Gd‐associated susceptibility effects in gray and white matter were consistent with theoretical predictions. However, the disadvantages included its much lower contrast‐to‐noise ratio, artifacts due to respiration and other effects, and more complicated reconstruction methods. Fahrendorf et al. (13) assessed the CE-SWI findings in patients with GBM. Contrast enhancement was evident, which was caused by the damage to the BBB. In addition, new ITSS were evident when certain contrast media were used. In the present study, the mean score of the grading of the ITSS was higher on CE-SWI than on SWI, but there was no statistical significance between them (18).
Intracranial tumor detection involves the use of the pre- and postcontrast images to find lesions of enhancement that result from contrast material deposition due to a BBB breakdown or increased lesion vascularity. Tumor margins are often seen as a high signal on postcontrast images because of prominent feeding or draining vessels. In the present study, CE-T1 and CE-SWI were statistically equivalent to each other and superior to T1WI and SWI with regard to tumor margin visibility in intracranial tumors (Table 5).
Tumor core enhancement varies according to its composition. In the present study, the scoring results were equivalent between CE-T1 and CE-SWI for the analysis of the internal architecture in metastasis (Table 4), but CE-T1 and CE-SWI did not show the same details (Figs. 3 and 4). The internal architecture of CE-T1 is determined by the presence of necrosis, cysts, and internal walls, whereas the internal architecture of CE-SWI is determined primarily by blood products and vasculature. CE-SWI detects tumor core heterogeneity significantly better than CE-T1 because of its ability to highlight blood products and venous vasculature better and to reveal new internal architecture (Figs. 3 and 4). In the present study, CE-SWI was statistically superior to that of CE-T1 with regard to the visibility of the internal architecture of the GBM. These results mean that GBMs have prominent immature vasculature and blood products (Table 5). With CE-SWI, both contrast enhancement and ITSS can be evaluated with one sequence.
GBM and single brain metastasis often pose a diagnostic dilemma on anatomic MRI, and they may require a surgical biopsy for a definitive diagnosis. Accurate diagnosis and imaging are important because treatment depends on the nature of the tumors. However, it is frequently necessary to perform histopathological diagnosis on a biopsy. In a previous report (6), the results of the semi-quantitative analysis indicated that the grading scores for high-grade astrocytic tumors and malignant tumors (including metastatic brain tumors and central nervous system lymphoma) were high, and the grading scores for low-grade astrocytic tumors were low on pre- and postcontrast SWI. In the present study, statistically significant differentiation was achieved between brain metastases and GBMs by using the grading of the visibility of the internal architecture of tumors in CE-SWI and by using the grading of the visibility of tumor margins in the CE-T1 scan. Statistically significant higher scores are noted in GBMs compared to metastases in the visibility of the internal architecture of the tumors on CE-SWI and in the visibility of the tumor margin on CE-T1 (P < 0.05, Mann–Whitney test) (Table 6). These results mean that GBMs have more prominent immature new vasculatures in the tumor parenchyme and more prominent feeding or draining vessels in the tumor margins than metastases.
We believe that it would be worth commenting on the proportion of metastatic lesion types in the patient population as they are not entirely typical. Melanoma and RCC are slightly underrepresented, whereas gastric, ovarian, and hepatocellular carcinoma are slightly overrepresented compared with what one might expect in a large and random distribution (21). Furthermore, melanoma and RCC are highly vascular tumors, and they are presumed to present relatively good marginal visibility on contrast-enhanced scans. For this reason, we think that this may have an impact on the results, such as the observation of reduced marginal visibility on CE-T1 compared with GBM.
The present study has some limitations. This was a retrospective study and a small number of tumors were studied. More patients should be studied in order to establish the clinical usefulness of CE-SWI. A limited variety of metastases was also studied. Most of the metastatic tumor pathologies in the present study were lung cancer. The possibility remains that metastases of different histopathologic origins can exhibit different degrees of ITSS.
In conclusion, our results showed that CE-SWI clearly visualizes the characteristics and the architecture of brain neoplasms with good delineation of the tumor margins. CE-SWI showed both ITSS that were not visible with conventional MR sequences and contrast enhancement. The diagnostic performance of CE-SWI for brain tumors is comparable with that of CE-T1. With regard to clinical use, CE-SWI can be useful for differentiating GBM and single brain metastasis, but more patients should be studied in order to establish the clinical usefulness of CE-SWI.
Footnotes
Acknowledgements
The abstract of this article was published in the proceedings of the Joint Annual Meeting ISMRM-ESMRMB, 16–21 June 2018, Paris, France.
Declaration of conflicting interests
The author(s) declared no potential conflicts of interest with respect to the research, authorship, and/or publication of this article.
Funding
The author(s) received the following financial support for the research, authorship, and/or publication of this article: This study was supported by a VHS Medical Center Research Grant, Republic of Korea (grant no. VHSMC 16004).
