
Abstract
Background
A method for improving the accuracy of coronary computed tomography angiography (CCTA) is highly sought after as it would help to avoid unnecessary invasive coronary angiographies. Measurement of the transluminal attenuation gradient (TAG) has been proposed as an alternative to other existing methods, i.e. CT perfusion and CT fractional flow reserve (FFR).
Purpose
To evaluate the incremental value of three types of TAG in high-pitch spiral CCTA with invasive FFR measurements as reference.
Material and Methods
TAG was measured using two semi-automatic methods and one manual method. A receiver operating characteristic (ROC) analysis was made to determine the usefulness of TAG alone as well as TAG combined with CCTA for detection of significant coronary artery stenoses defined by an invasive FFR value ≤0.80.
Results
A total of 51 coronary vessels in 37 patients were included in this retrospective study. Hemodynamically significant stenoses were found in 13 vessels according to FFR. The ROC analysis TAG alone resulted in areas under the curve (AUCs) of 0.530 and 0.520 for the semi-automatic TAG and 0.557 for the manual TAG. TAG and CCTA combined resulted in AUCs of 0.567, 0.562 for semi-automatic TAG, and 0.569 for the manual TAG.
Conclusion
The results from our study showed no incremental value of TAG measured in single heartbeat CCTA in determining the severity of coronary artery stenosis degrees.
Keywords
Introduction
The diagnostic accuracy for coronary angiography is high and it is considered to be the reference standard for stenosis degree evaluation when the fractional flow reserve (FFR) is measured (1,2). However, due to its invasive nature, it is associated with a certain risk for complications (3) as well as being a relatively costly procedure (4). Coronary computed tomography angiography (CCTA) examinations have emerged as a non-invasive alternative primarily for patients with an intermediate or low pre-test likelihood for cardiovascular disease. According to the clinical practice guidelines (5) published in 2019 by the European Society of Cardiology, CCTA is to be used as the initial test to diagnose chronic coronary artery disease (CAD) in symptomatic patients when CAD cannot be ruled out by clinical assessment, thus replacing exercise stress ECG in the management of these patients (5). Several studies have shown good sensitivity for CCTA in detecting coronary artery stenoses (4,6). The specificity, on the other hand, has shown to be lower and more varying. Evaluations of calcified plaques are especially problematic as calcifications cause so called blooming artefacts that blur the edges of the plaque (4). This leads to overestimations of the stenosis degree and therefore also to unnecessary coronary angiographies (4,6). Methods that add functional information to the CCTA such as stress myocardial CT perfusion (CTP) and fractional flow reserve CT (CT-FFR) have been shown to improve the specificity (7,8). CTP does however require additional imaging and CT-FFR is still only available as an off-site analysis (9).
Another method that has been proposed for improvement of the accuracy of CCTA is measurement of the transluminal attenuation gradient (TAG). The theory behind TAG is that the contrast attenuation throughout the coronaries reflects the blood flow. By simply measuring the attenuation along the centreline of the vessel at several points a linear regression coefficient can be calculated. A stenosis will reduce the blood flow and contrast delivery thereby causing an increase of the regression coefficient (10–12). TAG can be measured manually using the same software used for standard CCTA evaluations or by using specialized semi- or fully automated software. Studies made so far have shown contradictory results (11,13–19). This is possibly due to the lack of an established standard for TAG regarding the CCTA scan protocol, the contrast injection protocol or the image reconstruction parameters. Using 320-slice detectors seems to give a slightly more reliable TAG result (15–17,20–22), likely thanks to a better temporal uniformity of the contrast phase as the entire heart is imaged during a single heartbeat. Another way to achieve single-beat CCTA acquisitions is to use a high-pitch spiral technique (23). This type of scan is available in dual-source CT systems and renders a scan speed fast enough to capture images of the entire heart during diastole in patients with a heart rate <65–70 bpm (24). TAG analysis has not previously been evaluated in high-pitch spiral CCTA however.
The aim of the present study was to evaluate manual and semi-automatic TAG in high-pitch spiral CCTA examinations for coronary stenosis evaluations with invasive FFR measurements as reference.
Material and Methods
Ethical approval for this retrospective cross-sectional study was granted by the regional ethical review board as an amendment (Dnr M6-09) to a previously approved application (Dnr 2013/278-32). All CCTA examinations had been performed at Linköping University hospital and were entered into the national SWEDEHEART registry. The included examinations were anonymized and provided with a study ID before any of the evaluations took place. The need for informed consent was waived according to Swedish legislation regarding national quality registries and due to the retrospective nature of the study.
Patients
CCTA examinations performed between August 2009 and March 2017 were eligible for inclusion in this analysis. Consecutive sampling was used to include high-pitch spiral examinations that had been followed up with coronary angiography and FFR within 90 days. Only one examination per patient was included. CCTAs of patients with congenital heart disease and patients that had undergone a heart transplantation or bypass surgery were excluded.
All the CT image evaluations were made by a cardiac imaging radiographer (LH) with level 1 training for cardiac CT reading as defined by the Society of Cardiovascular CT (25) and two years of experience of cardiac CT research reading. The image quality of the CCTAs was assessed by the reader and graded on a 5-point scale: non-assessable; poor; measurable; good; and excellent. Examinations fulfilling the three highest levels were included in the study. Only stenoses located in the right coronary artery (RCA), left anterior descending artery (LAD), or the circumflex (Cx) artery were assessed (Fig. 1.).
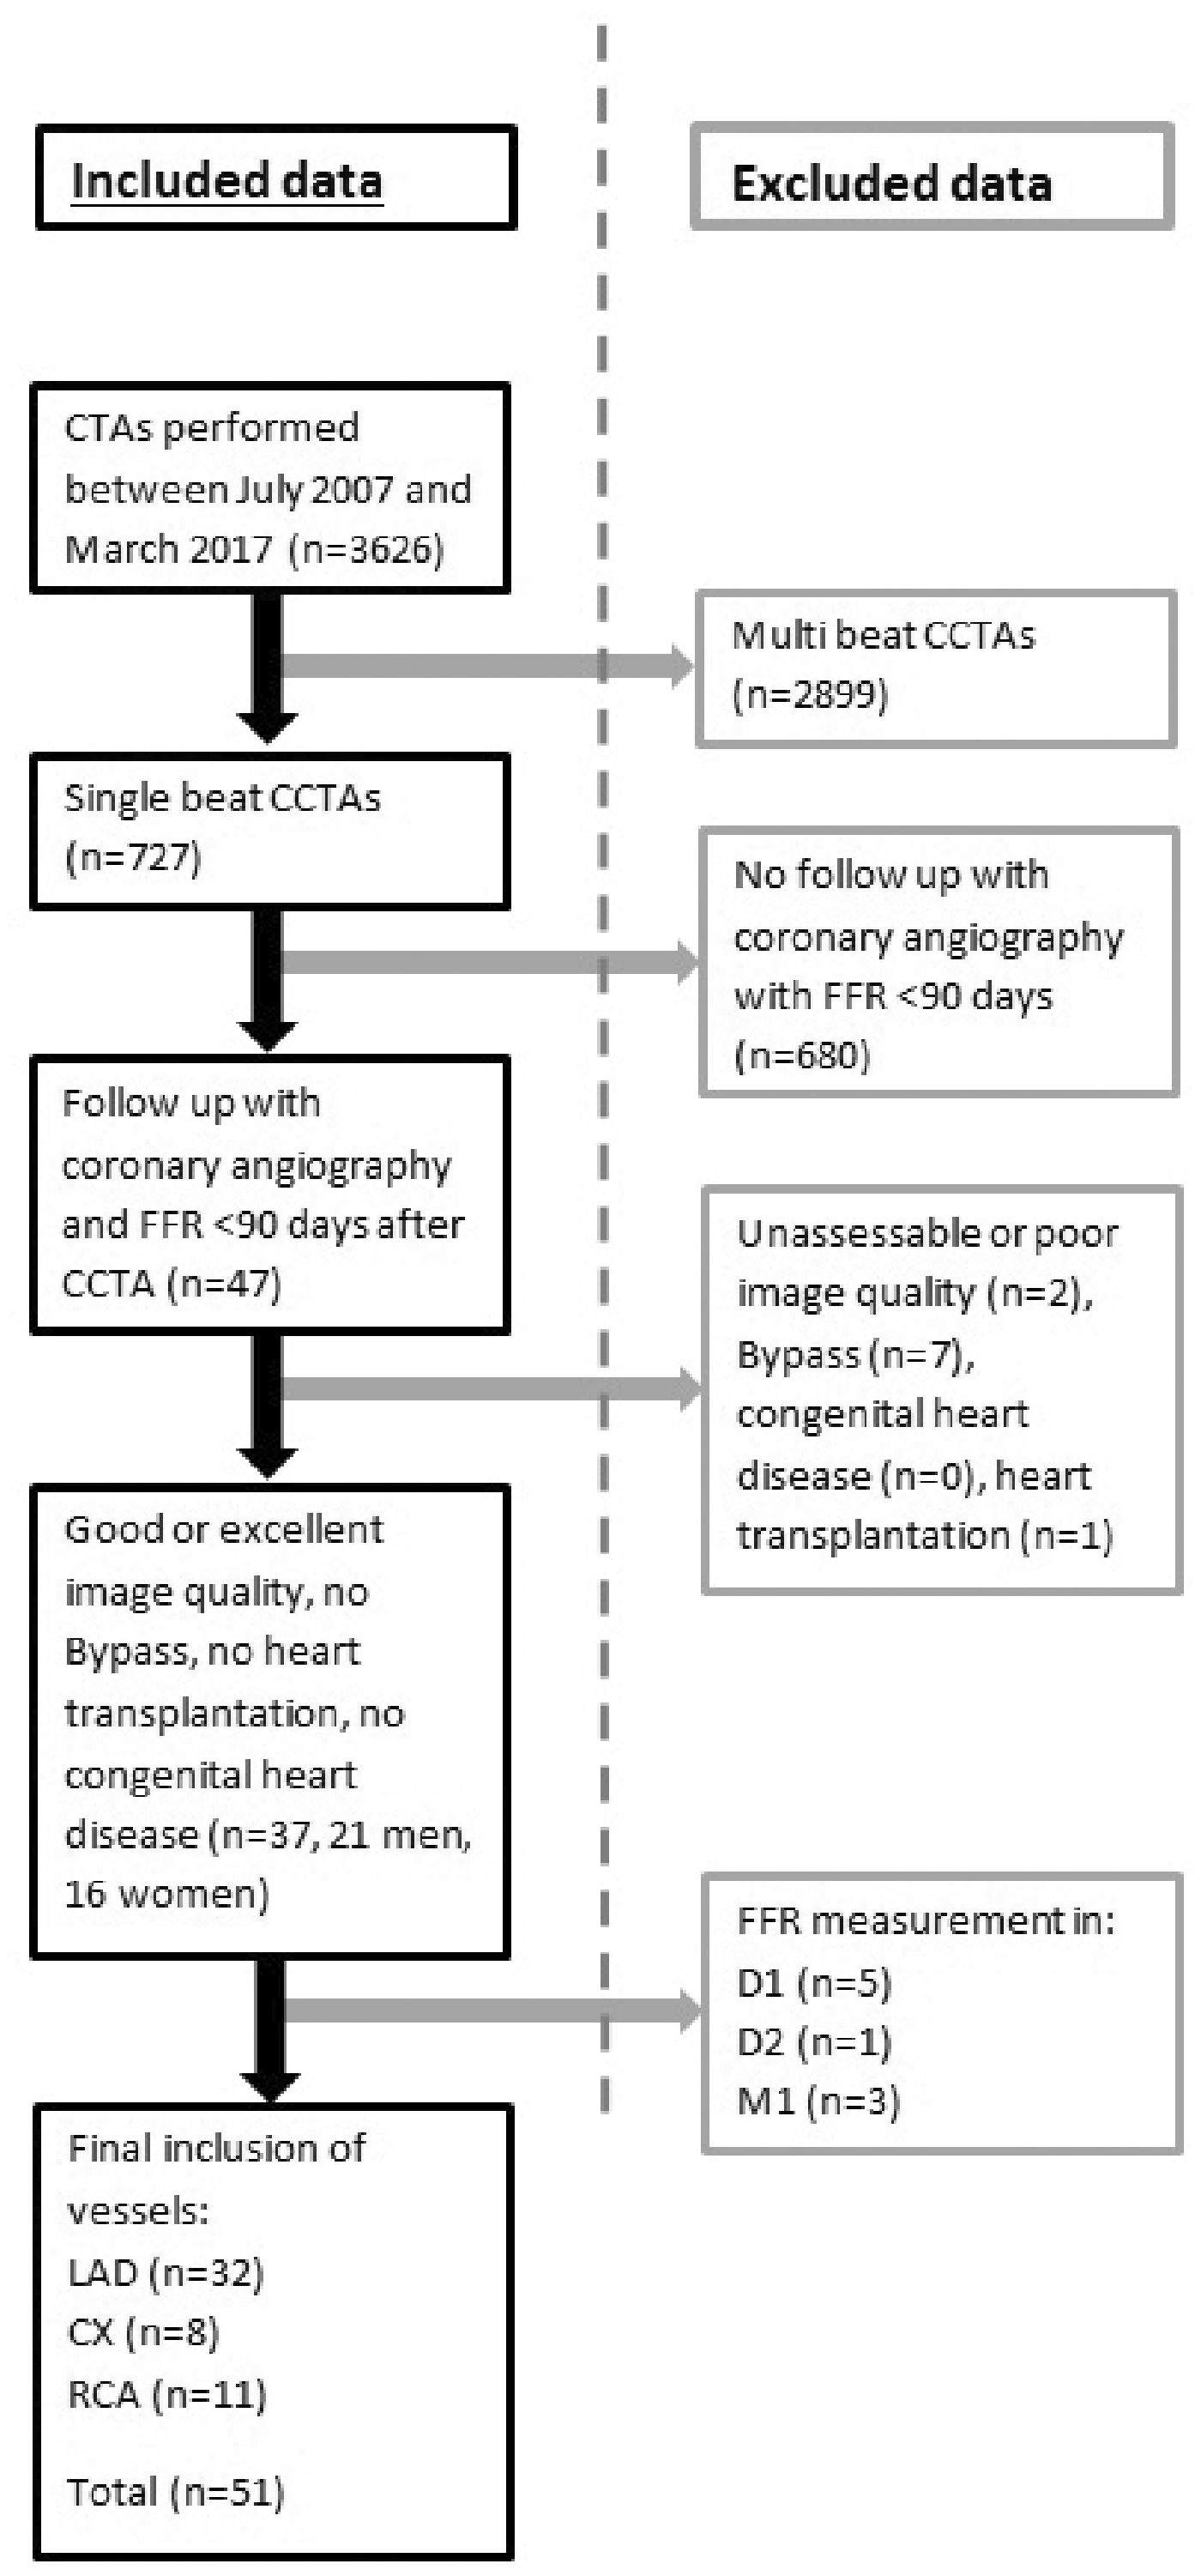
Inclusion and exclusion of CCTA examinations based on follow-up with coronary angiography and FFR, image quality assessment, and stenosis location. Stenoses in the LAD, CX, and right coronary arteries were included while stenoses in diagonal (D2, D2) and marginal branches (M1) were excluded. CCTA, coronary computed tomography angiography; CX, circumflex; FFR, fractional flow reserve; LAD, left anterior descending.
CCTA image acquisition and evaluation
Three different CT scanners were used for CCTA examinations throughout the inclusion period: two 2 × 128-channel dual-source scanners (SOMATOM Definition Flash and Definition Flash with Stellar detector, Siemens Healthineers, Forchheim, Germany 2009–2012 and 2012–2014, respectively) and one 2 × 192-channel dual-source scanner (Somatom Force, Siemens, 2014–). A prospectively ECG-gated high-pitch spiral protocol was used to acquire images of the entire heart during the diastolic phase in one heartbeat. Scan parameters used were: qRef. mAs 324; ref. kV 100 kV; pitch 3.4; TR 0.28 s (Flash) or 0.25 s (Force); temporal resolution 78 ms (Flash) or 66 ms (Force). Imaging of the heart started at 60% of the heart cycle and continued until about 90% depending on the scan length. A stable heart rate < 60 bpm was needed for this type of scan as there is a risk that higher more unstable heart rates will cause motion artefacts. Betablockers (up to 10 mg Metoprolol) were administered to lower the pulse in patients with a heart rate > 65 bpm. Nitroglycerine (up to 1.2 mg) was administered to optimize the contrast filling. A test bolus of 10 mL iodine contrast (Iopromide, Ultravist 370 mgI/mL, Schering, Berlin, Germany), followed by 50 mL saline solution was injected to calculate the optimal scan delay. The contrast dose was 335 mgI/kg (maximum weight 77 kg) and the injection time was 11.5 s.
The results for the CCTA examinations were retrieved from the clinical radiology reports. All evaluations had been made by radiologists specialized in CCTA image analysis. The reports did not contain quantitative evaluations of the stenosis degree instead the severity was reported as non-significant, possibly significant or significant.
Coronary angiography and FFR
Coronary angiographies were performed within 90 days after the CCTA for all included examinations. The FFR measurement was done using a dedicated guide wire (PressureWire Certus, St. Jude Medical Systems, Uppsala, Sweden) that was inserted in the vessel and advanced beyond the stenosis. Adenosine (140 μg/kg/min) was administered before the measurement to increase the blood flow. FFR was calculated as the mean pressure distally of the stenosis divided by the blood pressure in the aorta. An FFR ≤0.80 was considered hemodynamically significant.
TAG
All included examinations were anonymized and provided with a study ID before any of the evaluations took place. TAG measurements were made by the same reader (LH) who was blinded to the previous results from the CCTA, coronary angiography and FFR measurement. A training set of 10 CCTA examinations was evaluated before starting the evaluations of the study examinations. Results from the training set were not included in the study results.
The semi-automatic CT software (QAngio CT Research edition 2.0.5, Medis Medical Imaging Systems, The Netherlands) provided measurements of the attenuation at 0.5-mm intervals from the ostium until the cross-sectional area tapered <2 mm2. It automatically segmented the centerline as well as the outlines of the vessel wall. These segmentations were corrected by the reader when needed. Two types of TAG were derived by the software: one that included the attenuation of the entire ostium (TAG) at each measurement site and one only including the attenuation in a 3 × 3 pixel patch around the centerline (TAG_p).
The manual TAG (TAG_m) evaluation was performed using a server-based workstation (Syngo.via, Siemens Healthineers) and the applied method has been described in previous articles (16,17). A centerline was determined for each included vessel by the software and manually corrected if necessary. Regions of interest (ROIs) were positioned in cross-sectional images perpendicular to the centerline. The 1 mm2 ROIs were placed at a 5-mm distance from each other from the ostium until a vessel cross-sectional area <2 mm2 was reached.
The TAG value was defined as the linear regression line from the ostium until the end of the included part of the vessel. The final TAG was defined as HU/10 mm as in previous articles (11,16,19).
Statistical analysis
Statistical analyses were performed using IBM SPSS version 26.0.0.0 (IBM SPSS statistics, Armonk, NY, USA). Continuous variables with normal distribution are presented as mean ± SD and variables with non-normal distribution are presented as median and interquartile range. Categorical variables are presented as frequencies and percentages. Receiver operating characteristics (ROC) curves were used to demonstrate the value of TAG measurements alone for determining the significance of the stenosis degree according to the FFR results. The combined value of CCTA and TAG was checked by first using logistic regression to calculate the probability of TAG to correspond to the estimated stenosis significance level for each vessel. This probability was then evaluated against the FFR result using ROC analysis.
Results
Study population
The results are based on the inclusion of 37 patients (21 men, 16 women; age range 50–84 years, mean age 61.9 ± 8.0 years) and a total of 51 vessels (32 LAD, 8 Cx, 11 RCA), that were all considered to be of measurable, good, or excellent image quality. The mean time between the CCTA and the coronary angiography was 52 days. Participants had a mean body mass index of 27 ± 4.1 kg/m2. The mean heart rate during the CCTA was 57 ± 17 bpm and the mean radiation dose from the CCTA and invasive coronary angiography was 1.44 mSv and 6.6 mSv, respectively. Diabetes mellitus was found in three patients, dyslipidemia in 17 patients, and hypertension in 20 patients. Out of the 37 patients, four were smokers and 17 were ex-smokers. Patient characteristics are presented in Table 1.
Patient characteristics and radiation dose.

Values are given as n (%) or mean ± SD (range).
CCTA, coronary computed tomography angiography.
Coronary angiography and FFR
Hemodynamically significant stenoses according to the FFR measurements were detected in 13 (25.5%) vessels located in 13 (35.1%) patients.
Transluminal attenuation gradient and CCTA
There were slight mean differences between the TAG, TAG_p, and TAG_m values for vessels with FFR measurements <0.8 and >0.8; however, these differences were not statistically significant (Table 2). The ROC analysis of the TAG measurements alone resulted in areas under the curve (AUCs) of 0.530 (95% confidence interval [CI] 0.357–0.703), 0.520 (95% CI 0.341–0.699), and 0.557 (95% CI 0.385–0.728) for TAG, TAG_p, and TAG_m, respectively (Fig. 2). According to the radiology reports, 11 (22%) vessels contained non-significant stenoses, 37 (72%) contained possibly significant stenoses, and 3 (6%) contained significant stenoses. The probability values from the logistic regression analysis between TAG and CCTA resulted in ROC curves with AUCs of 0.567 (95% CI 0.395–0.738), 0.562 (95% CI 0.389–0.734), and 0.569 (95% CI 0.398–0.739) for TAG, TAG_p, and TAG_m, respectively (Fig. 3).
Transluminal attenuation gradients for vessels with FFR measurements < 0.8 and > 0.8.
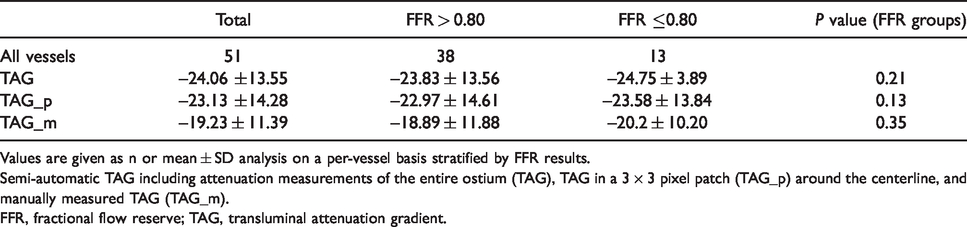
Values are given as n or mean ± SD analysis on a per-vessel basis stratified by FFR results.
Semi-automatic TAG including attenuation measurements of the entire ostium (TAG), TAG in a 3 × 3 pixel patch (TAG_p) around the centerline, and manually measured TAG (TAG_m).
FFR, fractional flow reserve; TAG, transluminal attenuation gradient.
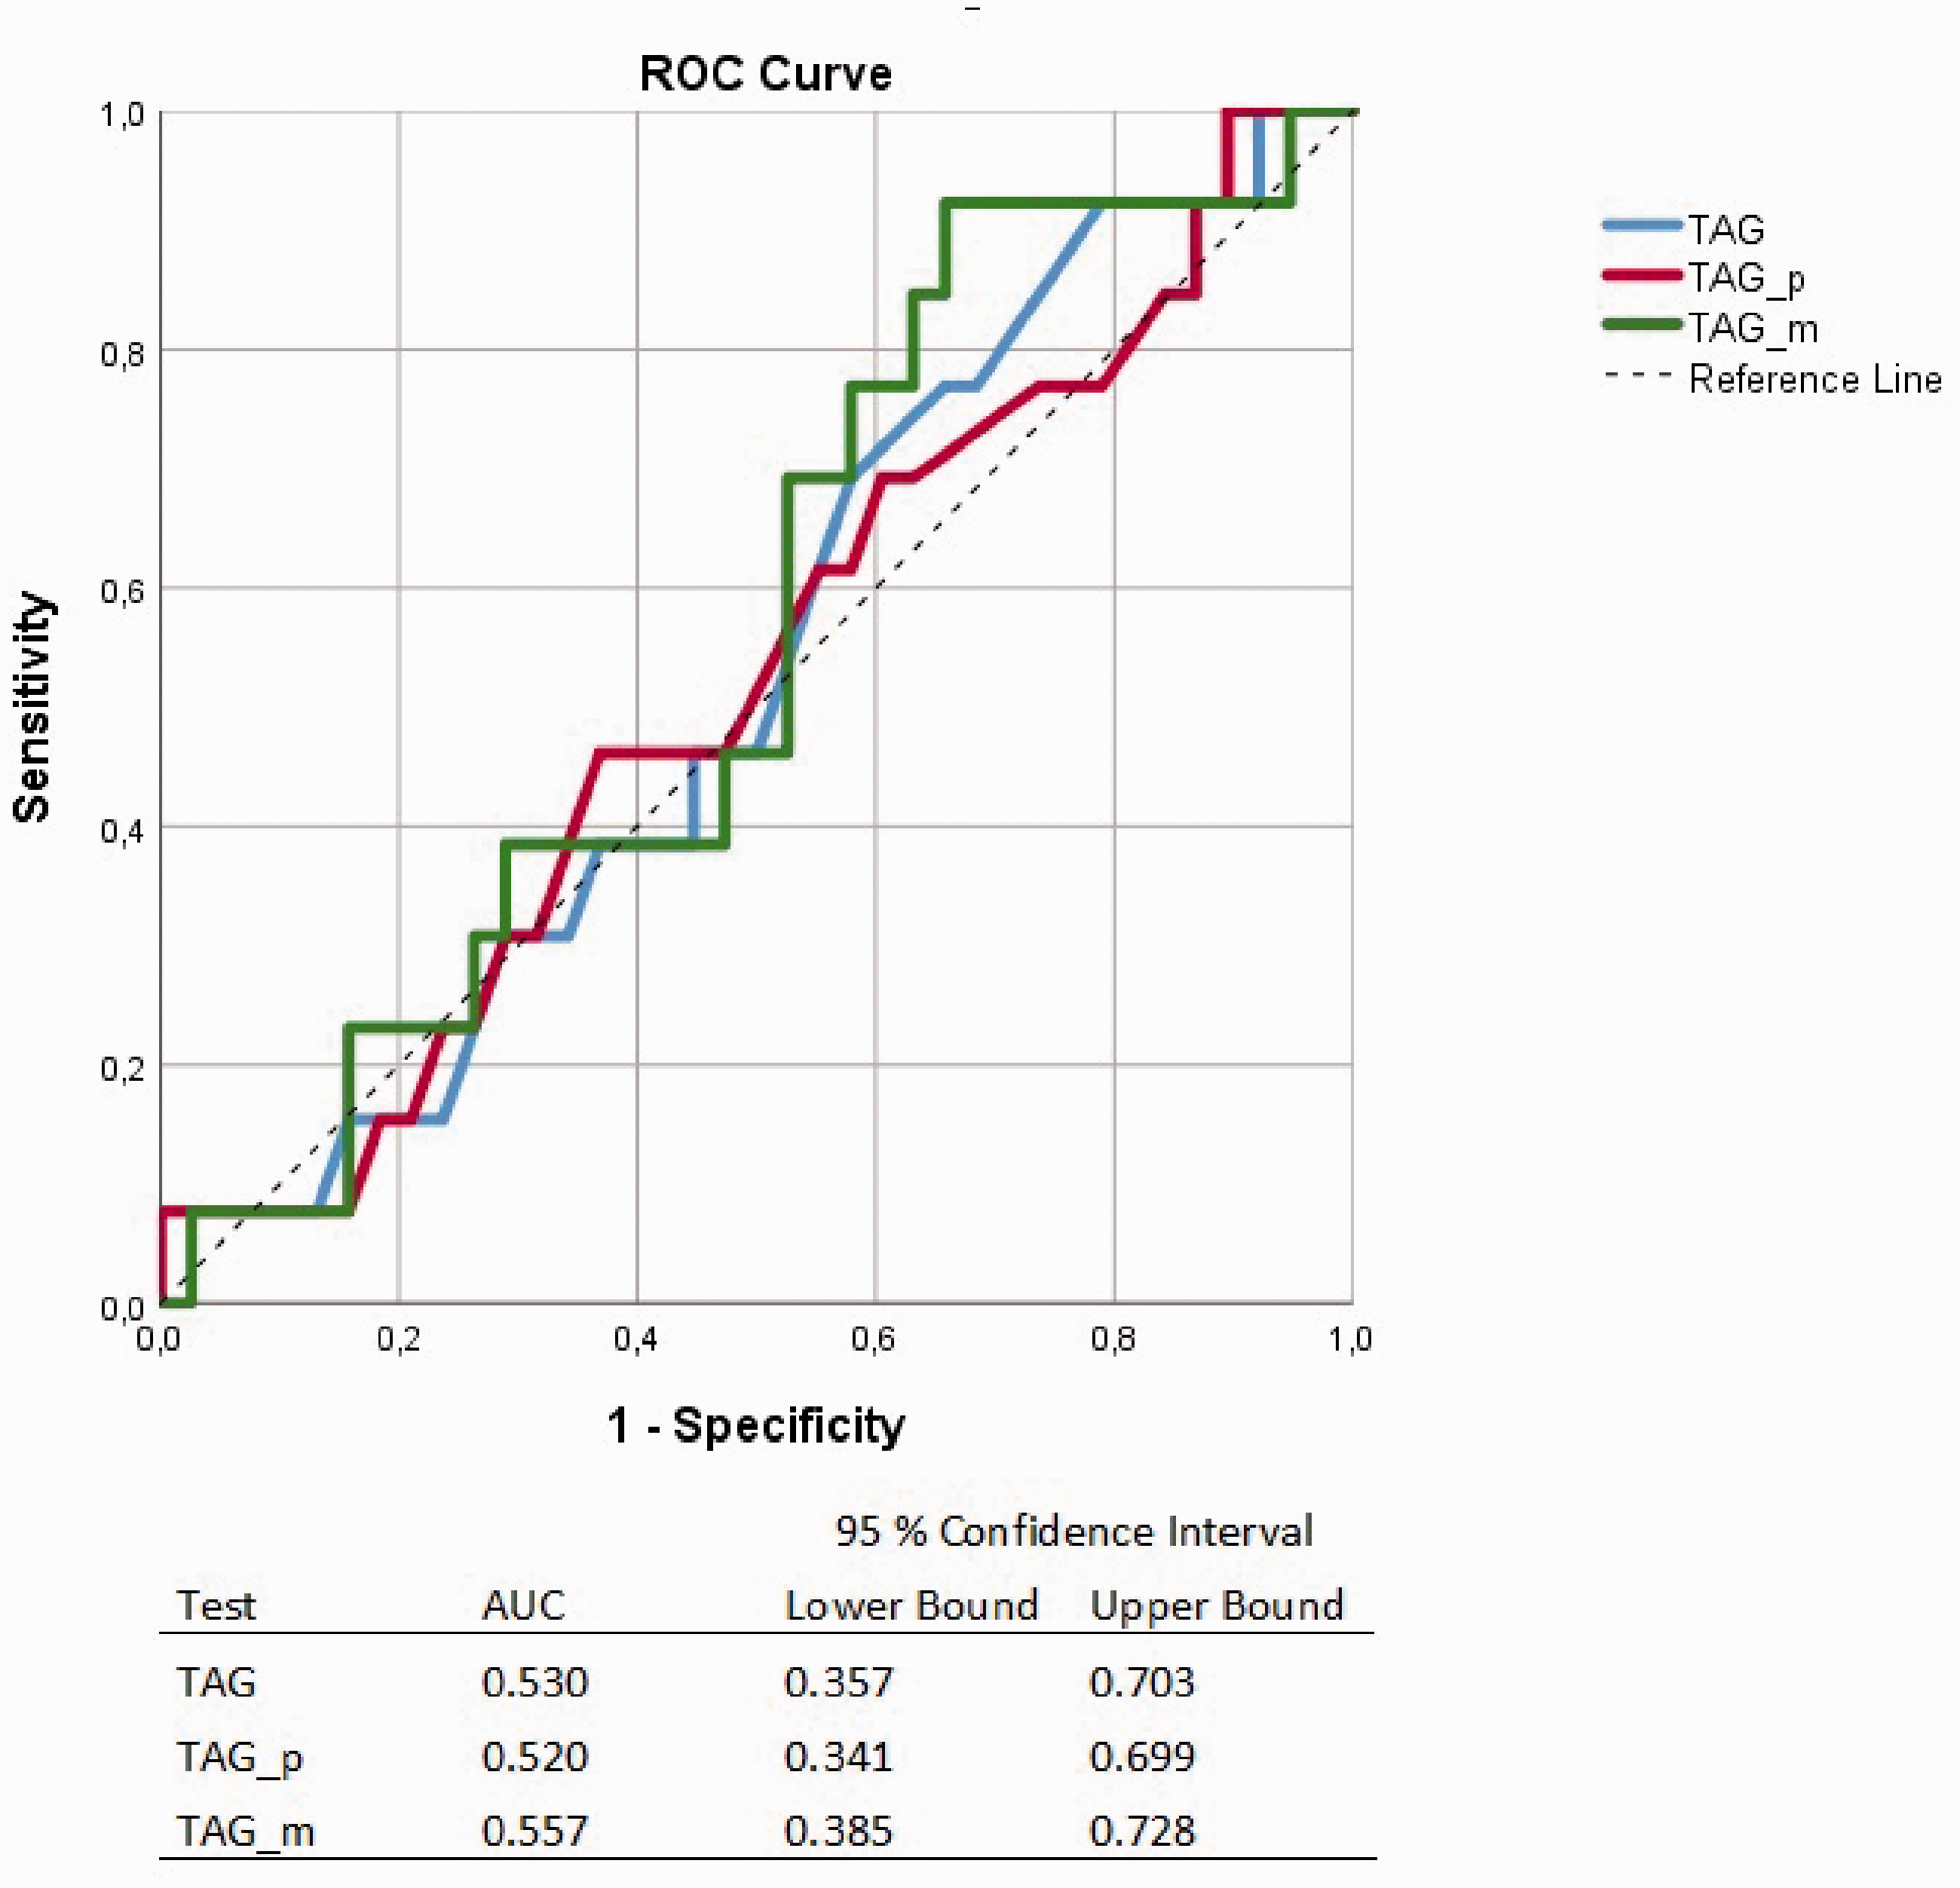
Receiver operating characteristic curves for the diagnostic accuracy of semi-automatic TAG including attenuation measurements of the entire ostium (TAG), TAG in a 3 × 3 pixel patch (TAG_p) around the centerline and manually measured TAG (TAG_m) using FFR measurements ≤0.80 as reference. FFR, fractional flow reserve; TAG, transluminal attenuation gradient.

Receiver operating characteristic curves for the diagnostic accuracy of probability values derived by logistic regression between the CCTA assessment and semi-automatic TAG including attenuation measurements of the entire ostium (Logreg TAG_sign), TAG in a 3 × 3 pixel patch (Logreg TAG_p_sign) around the centerline and manually measured TAG (Logreg TAG_m_sign) using FFR measurements ≤0.80 as reference. CCTA, coronary computed tomography angiography; FFR, fractional flow reserve; TAG, transluminal attenuation gradient.
Discussion
In the present study, neither TAG nor the combination of TAG and CCTA provided additional information in determining the significance of coronary artery stenoses. Improving the specificity of CCTAs can lead to more efficient use of hospital resources and save patients from possible complications associated with coronary angiography. CTP and CT-FFR both improve the specificity of CCTAs by adding functional information to the anatomical map provided by the CCTA (22). TAG would be an attractive alternative to CTP and CT-FFR as it is accessible on-site and does not require additional radiation exposure of the patient (11,13–19).
Results from previous TAG studies have been contradictory and difficult to compare as there is no established standard for TAG measurement. The use of different CT systems, scan techniques, reconstruction parameters, and contrast injection protocols could probably explain this some degree (26,27). A recently published meta-analysis that included TAG evaluations with FFR as reference method showed no significant improvement of the CCTA accuracy by using TAG. It did show a slight improvement when only 320-slice studies were included but the difference was still non-significant (22). Further studies including single heartbeat examinations have been warranted to evaluate TAG (28).
We tested three types of TAG, i.e. one manual and two types of semi-automatic measurements. The manual method has resulted in encouraging AUC values of 0.85 and 0.89 in two previous 320-slice TAG studies (16,17), which was higher than results from semi- and fully automatic 320-slice TAG studies (15,20,21). One advantage of manual measurements is the control of the ROI placement as it could help avoiding contamination from artefacts in the attenuation measurement. This cannot be avoided using the semi-automated software. Even though the segmentation of the vessel wall is checked and corrected, the lumen opacification will still be affected by, for example, blooming artefacts in areas of calcified plaques or other potential artefacts in the examination. The TAG_p evaluation might be able to avoid this to some degree by only including pixel values close to the centerline. Blooming artefacts are caused by the limited spatial resolution of the CT system and become especially prominent in CCTAs performed with a lower kV setting, i.e. 70 or 80 kV (29). Both semi-automatic measurements had the advantage of including attenuation values at every 0.5 mm which could contribute to a more exact gradient. Such frequent measurements would of course not be possible to do manually as it would be far too time-consuming.
TAG is based on the assumption that the contrast opacification corresponds to the blood flow throughout the coronary artery. However, it does not take into consideration physiological aspects that could influence the blood flow and mixing of the contrast, such as the stenosis location, the number of branches leaving the vessel, or the vessel diameter. This is all accounted for in CT-FFR (30) which also seems to be a method unaffected by vessel wall calcifications (31). Something that probably contributes to the gradient seen in TAG measurements is the small vessel diameter of the coronaries. This is indicated by the seeming correlation between TAG and the transluminal diameter gradient (TDG), i.e. the diameter change along the vessel length (28). If the vessel diameter becomes too small for the spatial resolution of the CT system, voxels adjacent to the vessel start to contribute to the vessel attenuation, i.e. partial volume effect. As the coronaries are surrounded by low attenuating soft tissues, such as fat, the result is a lowered attenuation and a potential overestimation of the TAG (27,28,32).
The present study has some limitations. First is the relatively low number of patients and included vessels. Only 25% of the included vessels had a significant stenosis according to the FFR measurement. However, there is currently a lack of previous TAG studies in flash technique CCTA and FFR measurements as reference. The main reason for the small number of examinations available for the present study is that the high-pitch spiral technique is only suitable for patients with a low and stable pulse. Imaging of the entire heart needs to take place during diastole to minimize the risk for motion artefacts. Second is the lack of a quantitative stenosis assessment in the CCTA images. This makes it impossible to assess the sensitivity and specificity for CCTA alone in the present study. It also affected the ROC analysis for the combination of CCTA and TAG and makes the AUCs for the CCTA and TAG combination and TAG alone more difficult to compare. The main reason no quantitative assessment has been performed is that such measurements are usually considered to be of little clinical importance due to errors caused by CCTA image resolution issues. Third is the retrospective nature of the study. The included examinations are performed on three different CT systems and even though they were all state of the art and the same scan technique was applied, there are differences between them. Most importantly improvements of the detector configuration for the second system compared to the first and then again for the third system compared to the two earlier. This probably led to a difference in spatial resolution for the included examinations. Different kV settings were also applied depending on the patient size. This could have contributed to blooming artefacts becoming more prominent in examinations performed with lower kV and thus also to a higher degree of error in the HU measurements.
The main strength of the study is the comparison of three types of TAG in single beat CCTA examinations using the gold standard reference, i.e. FFR.
In conclusion, the present study shows that TAG measurements from CCTA data collected during a single heartbeat do not provide information valuable to the CCTA evaluation. We believe that TAG, at least in the present form, should not be used as an alternative to CTP and CT-FFR.
Footnotes
Declaration of conflicting interests
The author(s) declared no potential conflicts of interest with respect to the research, authorship, and/or publication of this article.
Funding
The author(s) received no financial support for the research, authorship, and/or publication of this article.