
Abstract
Background
Since the 5th edition of BI-RADS was released, prior studies have compared BI-RADS and quantitative fully automated volumetric assessment, but with software packages that were not recalibrated according to the 5th edition.
Purpose
To investigate mammographic density assessment of automated volumetric measurements recalibrated according to the BI-RADS 5th edition compared with visual assessment.
Material and Methods
A total of 4000 full-field digital mammographic examinations were reviewed by three radiologists for the BI-RADS 5th edition density category by consensus after individual assessments. Volumetric density data obtained using Quantra and Volpara software were collected. The comparison of visual and volumetric density assessments was performed in total and according to the presence of cancer.
Results
Among 4000 examinations, 129 were mammograms of breast cancer. Compared to visual assessment, volumetric measurements showed higher category B (40.6% vs. 19.8%) in Quantra, and higher category D (40.4% vs. 14.7%) and lower category A (0.2% vs. 5.0%) in Volpara (P < 0.0001). All volumetric data showed a difference according to visually assessed categories and were correlated between the two volumetric measurements (P < 0.0001). The group with cancer showed a lower proportion of fatty breast than that without cancer: 17.8% vs. 46.9% for Quantra (P < 0.0001) and 9.3% vs. 21.5% for Volpara (P = 0.003). Both measurements showed significantly higher mean density data in the group with cancer than without cancer (P < 0.005 for all).
Conclusion
Automated volumetric measurements adapted for the BI-RADS 5th edition showed different but correlated results with visual assessment and each other. Recalibration of volumetric measurement has not completely reflected the visual assessment.
Introduction
Mammographic density indicates the proportion of radiologically dense fibroglandular tissue to fatty tissue in the breast (1). Dense breasts are associated with a higher risk of breast cancer than non-dense breasts (2). Both dense tissue and breast masses appear mammographically white and the masking of masses by dense tissue can lower mammographic sensitivity (1). In the literature, the overall sensitivity of screening mammography is in the approximate range of 80%–85%, which decreases to 50%–64% for extremely dense breasts (3–5). Currently, 38 states and the District of Columbia in the USA require some level of breast density notification after a mammogram (6).
For the assessment of mammographic density, the Breast Imaging-Reporting and Data System (BI-RADS) by the American College of Radiology, being the most widely used method, adopted a four-scale classification as a visual assessment (7). The 5th edition of BI-RADS, which is the most recently released, eliminated quartile ranges of percent tissue density from the breast composition to further emphasize the masking effect of breast density (8). The distribution of dense tissue and the likelihood of lesion obscuration is the mainstay of mammographic density assessment in the BI-RADS 5th edition. For instance, even a breast with dense tissue comprising <50% of the total breast is considered to be heterogeneously dense when the dense tissue is piled up in a single area with otherwise fatty tissue throughout the breast to indicate that this area may obscure a mass (8–10). However, a more objective and reproducible method of density measurement has been called for due to the drawbacks in visual assessment, including inter-observer variability and poor reproducibility (11). Several quantitative measurements of mammographic density are now available; semi-automated, automated, area-based, or volumetric, and two of the most well-known commercial software for fully automated volumetric assessment are Quantra and Volpara (1). Although BI-RADS and quantitative assessment by automated volumetric density measures have been investigated (9,10,12,13), the prior studies were performed with old versions of software for automated volumetric assessment that were not recalibrated according to the 5th edition of BI-RADS.
Therefore, the aim of the present study was to investigate the assessment of mammographic density of automated volumetric measurements recalibrated according to the BI-RADS 5th edition in comparison with visual assessment.
Material and Methods
This retrospective study was approved by the Institutional Review Board of Gangnam Severance Hospital with a waiver of the requirement for written informed consent from participants.
From January 2016 to July 2016, 4233 consecutive full-field digital mammography examinations with standard views of craniocaudal and mediolateral oblique views were performed at our institution. Digital mammographic examinations were performed on one of two full-field digital mammography units (Lorad Selenia, Hologic, Danbury, CT, USA) equipped with 24 × 29 cm amorphous selenium detectors with a pixel size of 70 μm. All of the volumetric density data obtained in these examinations were made available by use of both Quantra software, version 2.1.1 (Hologic, Bedford, MA, USA) and Volpara software, version 3.1 (Volpara Health Technologies, Wellington, New Zealand) (14,15). The exclusion criteria were as follows: examinations of breasts on which breast-conserving surgery or mastectomy for cancer treatment had been performed; examinations of augmented breasts; and examinations from which the software failed to obtain volumetric density data.
Visual assessment of mammographic density by radiologists
All mammographic images were downloaded to a review workstation (Selenia Softcopy Workstation, Hologic, Bedford, MA, USA) with soft-copy reading software (MeVis BreastCare version 6.0.5, MeVis Medical Solutions, Bremen, Germany). Three radiologists with 7, 10, and 14 years of experience in interpreting digital mammograms independently reviewed the images at the workstation. Each radiologist was blinded to the assessment of the other radiologists and to the volumetric breast density. Each mammogram was assessed for breast density per examination according to the 5th edition of BI-RADS. The following BI-RADS categories were used for mammographic interpretations: category A, almost entirely fatty; category B, scattered areas of fibroglandular densities; category C, heterogeneously dense; and category D, extremely dense (8) (Fig. 1). If the BI-RADS breast density category was different among the radiologists, consensus was reached by discussion.
Automated volumetric assessment of breast density
For automated volumetric analysis, both the Volpara software and the Quantra software were used. Both software algorithms determine and report the ratio of fibroglandular tissue as a percentage of total breast volume by the following procedure. First, these algorithms estimate two volumes, the volume of fibroglandular tissue in cubic centimeters and the volume of the breast in cubic centimeters. They then divide the volumes to produce a volumetric fraction of fibroglandular tissue as a percentage reported as the volumetric breast density (9). For the Volpara software, the volumetric data are provided per breast by averaging the craniocaudal and mediolateral oblique values. For each patient, a Volpara density grade (VDG) is also provided, which is the result of mapping the volumetric breast density corresponding to the BI-RADS 5th edition density category (8). The VDG is graded according to the percentage volumetric breast density as follows: VDG A = <3.5%; VDG B = 3.5%–7.5%; VDG C = 7.5%–15.5%; and VDG D = ≥15.5% (Fig. 1). Similarly, the Quantra software segregates breast density into the Quantra breast density categories (QDC) A through D with cut-off values as follows: QDC A = < 5.4%; QDC B = 5.4%–11.5%; QDC C = 11.5%–27.9%; and QDC D = ≥27.9% (Fig. 1). It provides numeric values of breast density per image, breast, and patient (9).
Data and statistical analysis
Medical records were reviewed and demographic data for personal history of breast augmentation, breast-conserving surgery, mastectomy, or neoadjuvant treatment were compiled. After the results of visual and volumetric assessments were compared in total, participants were dichotomized by the presence of cancer at the time of mammographic examination. Mammographic density category and volumetric density data (the volume of fibroglandular tissue, the volume of the breast, and the percentage volumetric breast density) were compared between the two groups.
Statistical comparisons were performed with ANOVA, the paired t-test, or Pearson’s test to correlate volumetric breast density data with visual assessment, the independent t-test to compare the volumetric breast density data between groups with cancer and without cancer, weighted κ statistics by using linear weighting for inter-observer agreement, and the chi-square or Fisher’s exact test to evaluate the distribution of density category. Statistical analyses were performed using statistical software programs (IBM SPSS Statistics, version 23.0.0, IBM, Armonk, NY, USA; MedCalc, version 12.2.1.0, MedCalc Software, Ostend, Belgium). Statistically significant differences were considered to exist at a significance level of 0.05.
Results
Of 4233 mammographic examinations, 4000 examinations of 4000 women aged 22–92 years (mean age = 52.7 ± 10.2 years) were included in the present study. The other 233 examinations were excluded because examinations were performed while the patient was receiving neoadjuvant chemotherapy (n = 52), the breasts were iatrogenically altered by bilateral cancer surgery (n = 42) or augmented with implants (n = 118) or foreign material injection (n = 11), or the software failed to obtain volumetric density data due to technical error (n = 10). Mammograms of only a unilateral breast were analyzed for 1271 women (31.8%) who had undergone cancer surgery on the contralateral breast. Of 4000 examinations, 129 were obtained from women with newly diagnosed or known breast cancer. There were 3800 (95%) screening and 200 (5%) diagnostic mammographic examinations.
Regarding visual assessment by radiologists, the distribution of density category significantly differed among the radiologists (P < 0.0001). Category C was the most frequently assigned designation, around 60% of all examinations (Table 1). Weighted κ values were 0.875 (standard error [SE] = 0.006; 95% confidence interval [CI] = 0.863–0.888) between Reviewers 1 and 2, 0.818 (SE = 0.007; 95% CI = 0.804–0.833) between Reviewers 2 and 3, and 0.820 (SE = 0.007; 95% CI = 0.806–0.834) between Reviewers 1 and 3. The distribution of density category assigned by both automated volumetric measurements was significantly different from visual assessment (P < 0.0001). VDG and QDC also showed different distributions (P < 0.0001). For Quantra, QDC B accounted for 40.6%, higher than BI-RADS category B (19.8%) and VDG B (21.0%) (Table 1). For Volpara, the lower percentage of VDG A (0.2%) and higher percentage of VDG D (40.4%) were distinct from BI-RADS category and QDC (Table 1). Weighted κ values were 0.538 (SE = 0.010; 95% CI = 0.519–0.557) between the reviewers and Quantra, 0.480 (SE = 0.009; 95% CI = 0.462–0.498) between the reviewers and Volpara, and 0.371 (SE = 0.008; 95% CI = 0.356–0.387) between Quantra and Volpara.
Examinations and categories of mammographic breast density assessed by three radiologists and two automated volumetric measurements.

Values are given as n (%).
Volumetric density data from two automated volumetric measurements are summarized in Table 2. All volumetric density showed significantly different mean values among the BI-RADS categories (P < 0.0001). As breast density was visually assigned as denser, both the mean volume of fibroglandular tissue and the mean volumetric breast density (%) increased, but the mean total breast volume decreased in both Quantra and Volpara. All mean volumetric data from Quantra were significantly higher than the data from Volpara (P < 0.0001), apart from volumetric breast density (%) in category A (P = 0.508) and category D (P = 0.746). The correlation with each other, however, was significant (γ = 0.848, 0.984, and 0.728 for volume of fibroglandular tissue, total breast volume, and volumetric breast density (%), respectively; P < 0.0001).
Volumetric breast density data from two different automated volumetric measurements according to category of mammographic breast density.

Values are given as mean ± standard deviation.
According to the presence of cancer, the distribution of density category significantly differed in BI-RADS (P < 0.0001), QDC (P < 0.0001), and VDG (P = 0.003). The proportion of non-dense breasts (categories A and B) in the group with cancer was lower than in the group without cancer: 10.1% vs. 25.3% for BI-RADS; 17.8% vs. 46.9% for QDC; and 9.3% vs. 21.5% for VDG (Table 3). Both automated volumetric measurements showed significantly higher mean volumetric density data in the group with cancer than in the group without cancer (Table 4).
Examinations and categories of mammographic breast density according to the presence of cancer.
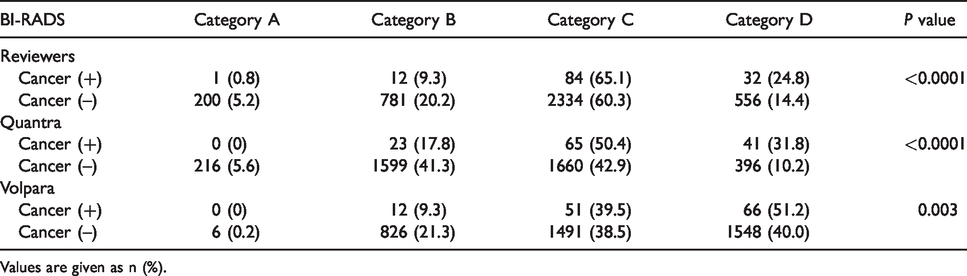
Values are given as n (%).
Volumetric breast density data from two different automated volumetric measurements according to the presence of cancer.

Values are given as mean ± standard deviation.
Discussion
Ever since the 5th edition of BI-RADS was released, several studies have evaluated the revised categories of mammographic density and their clinical implications (9,10,16–18). For fully automated volumetric assessment, however, very few studies were reported, even with software packages that were not recalibrated according to the 5th edition of BI-RADS (9,10,12,13). In the present study, we performed automated volumetric assessment of mammographic density with two different programs, Quantra and Volpara, that have been more recently released version and recalibrated according to the new BI-RADS.
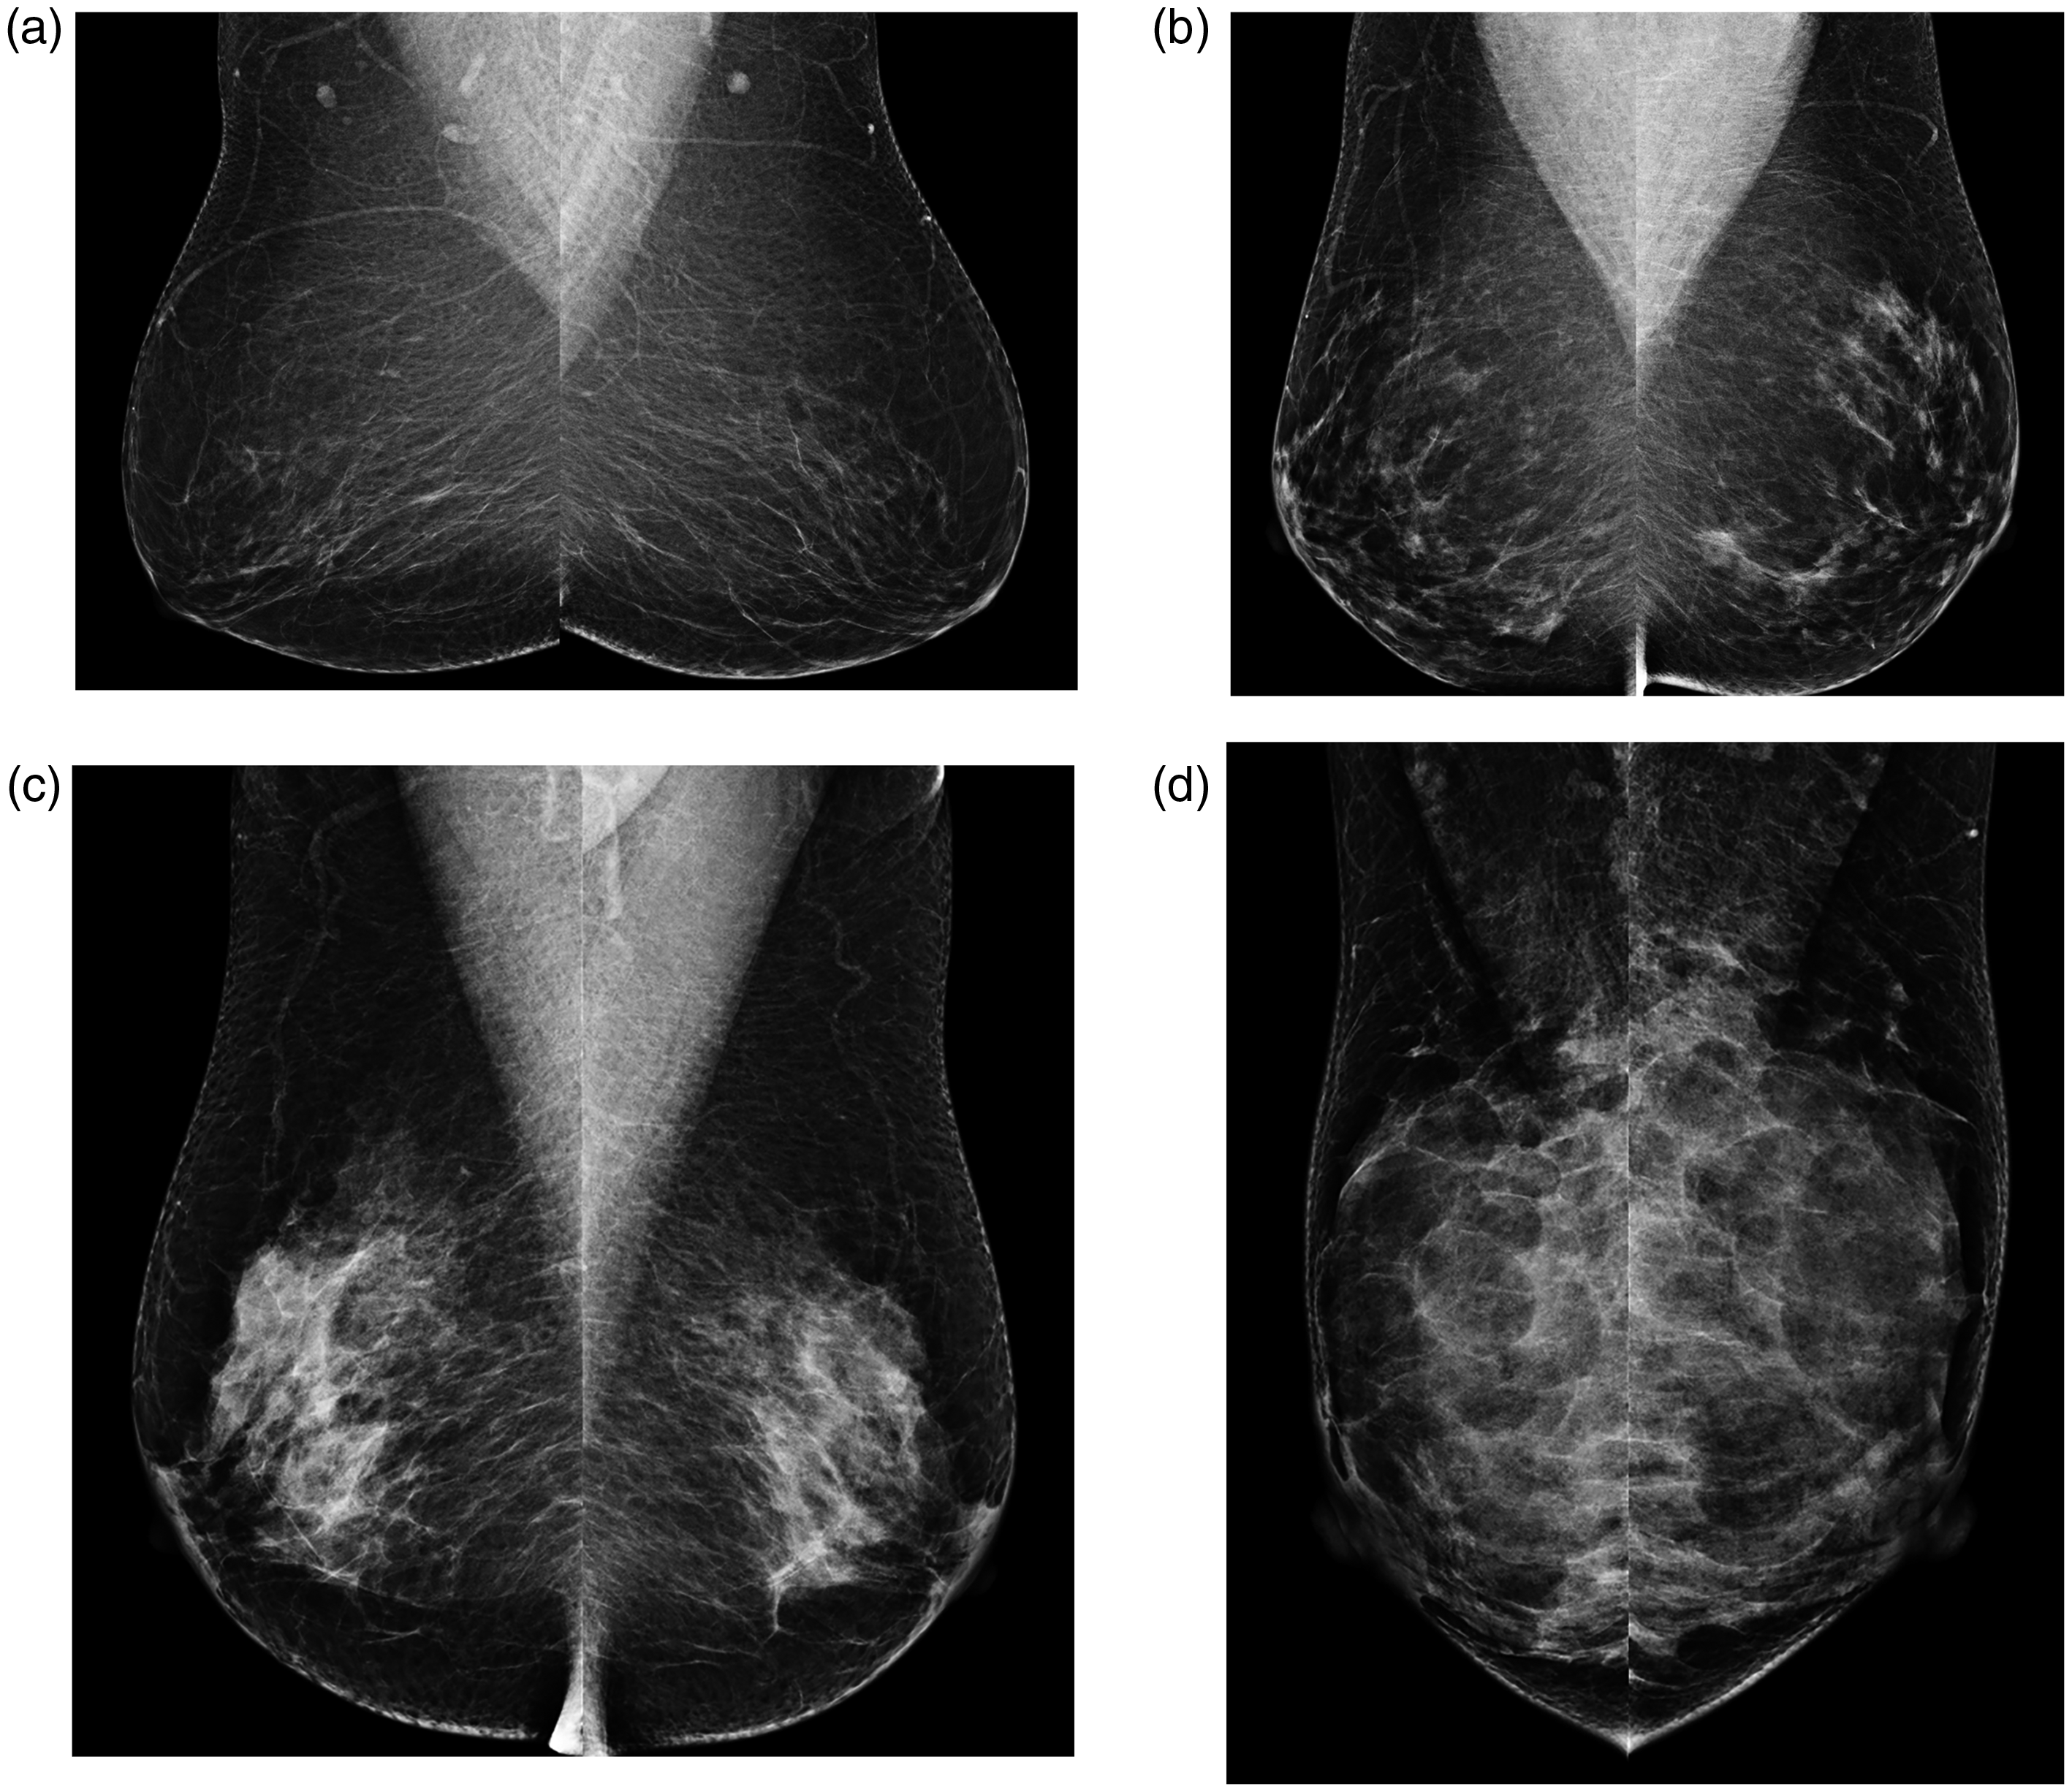
Category of mammographic density according to the BI-RADS 5th edition. (a) Category A was assigned by all radiologists, Quantra (volumetric breast density, 5%) and Volpara (volumetric breast density, 3%). (b) Category B was assigned by all radiologists, Quantra (volumetric breast density, 6%) and Volpara (volumetric breast density, 4.5%). (c) Category C was assigned by all radiologists, Quantra (volumetric breast density, 15%) and Volpara (volumetric breast density, 10%). (d) Category D was assigned by all radiologists, Quantra (volumetric breast density, 36%) and Volpara (volumetric breast density, 33.6%).
Regarding the agreement in mammographic density categories assigned by automated volumetric measurements with visual assessment, recalibrated measures in the present study showed similar result to earlier ones (9,19,20). The weighted κ value in our study was 0.54 for Quantra and 0.48 for Volpara, which was within the range of 0.54–0.61 for Quantra and 0.45–0.54 for Volpara in a previous study performed with programs that have not been recalibrated (9). Our weighted κ values were also in line with those of prior studies based on the BI-RADS 4th edition, which were in the range of 0.46–0.79 for Quantra and 0.40–0.80 for Volpara (9,19,20). Likewise, the distribution of mammographic density category in the present study was consistent with that in a prior study performed with programs that have not been recalibrated (Table 1) (9). With Quantra, categories B and C were evenly distributed, about 40%, and categories A and B—non-dense breast (46.0%)—were more frequently assigned than with visual assessment (24.8%) and Volpara (18.3%) (P < 0.0001). With Volpara, category A accounted for only 0.2%, while a higher proportion of category D designation (40.4%) was found than with visual assessment (14.7%) and Quantra (10.9%) (P < 0.0001). In the 5th edition of BI-RADS, dense breast assignment by radiologists increases as the definition of dense breast changes by emphasizing the masking effect of dense tissue (10,17). However, volumetric measurements showed consistent results with past studies of the agreement with visual assessment and the distribution in density assignment and even after recalibration (9,19,20). Recalibration of volumetric measurement has not yet completely gone along with the new BI-RADS. Its inherent limitation of measuring only the amount of dense tissue, not assessing the masking or distribution of the dense area within the breast, could be the reason for it. In contrast, radiologists are able to interpret not only the amount of dense tissue but also the masking or distribution of the dense area in accordance with the 5th edition of BI-RADS, which makes a difference in the distribution of the category of mammographic density between visual assessment and Quantra or Volpara. To satisfy this new terminology of BI-RADS, volumetric measurements must determine how dense the dense areas are and whether a few coalescent areas of dense tissue may be present that could obscure masses. However, it would be a much more difficult problem to solve for most automated volumetric measurements and may require artificial intelligence solutions.
According to visually assigned categories, all volumetric breast density data in Quantra and Volpara were well stratified and correlated with each other, but the different algorithms between two programs could lead to the difference in absolute values of volumetric data (Table 2) (9,21,22). Quantra adopts an absolute physics model of accumulating the fibroglandular tissue density per pixel with image acquisition parameters such as breast thickness, but Volpara adopts a relative physics model of the relative pixel values to a pixel of pure fat as an internal reference, less dependent on breast thickness (1,9,23). In addition, Quantra incorporates the skin when the volume of total breast is calculated but Volpara does not.
Regarding breast density according to the presence of breast cancer, women with cancer had a significantly lower proportion of non-dense breasts (categories A and B) than women without cancer in visual assessment (P < 0.0001) as well as volumetric assessment (QDC, P < 0.0001; VDG, P = 0.003), with a range of difference of 15%–28% (Table 3). The confounding factors for breast density such as age, body mass index (BMI), parity, menopausal status, or hormone replacement therapy were not adjusted because breast density as a cancer risk factor was beyond the scope of the present study. However, case-control studies reported the association of dense breasts with cancer after adjustment for those confounding factors (24,25). A previous study for VDG based on the 4th edition of BI-RADS showed a lower proportion of non-dense breasts (categories 1 and 2) in the cancer group (11.9%) than in the control group (27.9%) (P < 0.001) and the association of cancer with VDG 3 or 4 in postmenopausal women regardless of BMI (24). Another case-control study demonstrated that category of density according to the 4th edition of BI-RADS and volumetric breast density (%) obtained from Quantra and Volpara were positively associated with cancer after adjusting for age, BMI, and reproductive variables (25). Our results were consistent with the past results that all volumetric density data were significantly different between the control and cancer groups, and volumetric breast density (%) obtained from Quantra and Volpara was significantly higher in the cancer group than in the control group (Table 4).
The present study has some limitations. First, this is a single-institution study performed with single-vendor mammographic units, which might limit the generalizability of the results. The distributions of visually assigned category in this study (5% to category A, 20% to category B, 60% to category C, and 15% to category D) were different from those reported by the American College of Radiology (10% to category 1, 45% to category 2, 35% to category 3, and 10% to category 4) (7) and a previous study (7% to category A, 35% to category B, 40% to category C, and 18% to category D) (17). This may reflect the limitation by individual practice from a single institution within a particular healthcare system. In addition, only Volpara and Quantra software programs available in our institution were used in this study. Further evaluation is needed for other useful software programs for the automated measurement of breast density. Lastly, results of a consensus group might be biased by having readers specifically focusing only on mammographic density, rather than noting density in passing as is done and focusing more attention on detection of abnormalities in a real clinical setting.
In conclusion, automated volumetric measurements adapted for the BI-RADS 5th edition showed different but correlated results with visual assessment and each other. Recalibration of volumetric measurement has not completely reflected the visual assessment. When interpreting the mammographic density assessment using Volpara and Quantra, radiologists and physicians should take into account the difference from visual assessment, even in the recalibrated version for the BI-RADS 5th edition.
Footnotes
Declaration of conflicting interests
The author(s) declared no potential conflicts of interest with respect to the research, authorship, and/or publication of this article
Funding
The author(s) disclosed receipt of the following financial support for the research, authorship and/or publication of this article: This study was supported by a faculty research grant of Yonsei University College of Medicine (6-2017-0046).