
Abstract
Background
Ultrasound (US) elastography has become a routine instrument in ultrasonographic diagnosis that measures the consistency and stiffness of tissues.
Purpose
To distinguish benign and malignant breast masses using a single US system by comparing the diagnostic parameters of three kinds of breast elastography simultaneously added to B-mode ultrasonography.
Material and Methods
A total of 163 breast lesions in 159 consecutive women who underwent US-guided core needle biopsy were included in this prospective study. Before the biopsy, the lesions were examined with B-mode ultrasonography and strain (SE), shear wave (SWE), and point shear wave (STQ) elastography. The strain ratio was computed and the Tsukuba score determined. The mean elasticity values using SWE and STQ were computed and converted to Young’s modulus E (kPa).
Results
All SE, SWE, and STQ parameters showed similar diagnostic performance. The SE score, SE ratio, SWEmean, SWEmax, STQmean, and STQmax yielded higher specificity than B-mode US alone to differentiate benign and malignant masses. The sensitivity of B-mode US, SWE, and STQ was slightly higher than that of the SE score and SE ratio. The SE score, SE ratio, SWEmean, SWEmax, STQmean, and STQmax had significantly higher positive predictive value and diagnostic accuracy than B-mode US alone. The area under the curve for each of these elastography methods in differentiating benign and malignant breast lesions was 0.93, 0.93, 0.98, 0.97, 0.98, and 0.96, respectively; P<0.001 for all measurements.
Conclusion
SE (ratio and score), SWE, and STQ had higher diagnostic performance individually than B-mode US alone in distinguishing between malignant and benign breast masses.
Introduction
Ultrasound (US) elastography has become a routine instrument in ultrasonographic diagnosis that can measure the consistency and stiffness of tissues non-invasively to distinguish benign and malignant breast lesions (1). There are many different elastography techniques to qualitatively or quantitatively measure and display elastography. Common techniques used for breast tissue are strain elastography (SE), shear wave elastography (SWE), and point shear wave elastography (pSWE) (2,3). These elastography modalities are complementary systems for US and helpful for obtaining a better description of breast masses.
In SE, the investigator applies compression (either manually or via respiratory movements or cardiac pulses), and images are created by measuring the applied stress resulting from the induced tissue displacement. A semi-quantitative measurement, named the strain ratio (SR), is calculated by dividing the strain of a nearby reference tissue by the strain of the tissue under examination (4). Images resulting from measurements are represented as a translucent color map called an elastogram that is placed over the B-mode image. The Tsukuba score (elasticity score) is a commonly used method for distinguishing benign and breast lesions (5). The Tsukuba score (a 5-point color classification system) is a system built on variations in the hardness of the lesion and surrounding tissues, and it creates a map by computing the hardness of the lesion relative to the hardness of the background tissue (6).
SWE uses a set of shear waves to measure tissue stiffness based on pressure values determined by the machine. Measuring shear wave velocity leads to a quantitative and qualitative estimation of tissue elasticity. The rate of shear wave propagation is proportional to Young’s modulus (kilopascals [kPa]), which is a measure of tissue resistance to shearing and is usually used to quantify tissue elasticity (1,6).
In pSWE, a set of shear waves is used to induce normal and directional tissue displacement at a single focal point. The velocity of the shear waves vertical to the plane of induction is calculated and immediately transformed by Young’s modulus E (kPa) to quantify the stiffness (7).
The American College of Radiology proposed qualitative, but not quantitative, tissue elasticity as a related property on the last published Breast Imaging Reporting and Data System (BI-RADS) guidelines (8). US elastography imaging adds qualitative/semi-quantitative or quantitative information to traditional B-mode US and extends diagnostic knowledge (9).
Many studies have determined that adding one of these elastography methods to traditional B-mode US enhances its diagnostic performance in distinguishing benign and malignant breast lesions (10–19). However, studies directly comparing all three elastography techniques using a single US system are rare in the same population (10–12,17–19).
The aim of the present study was to distinguish benign and malignant breast masses by qualitative and quantitative evaluations using a single US system by concurrently comparing the diagnostic parameters of three kinds of breast elastography combined with traditional B-mode ultrasonography.
Material and Methods
This prospective study was approved by the Clinical Ethics Board and informed consent was obtained from all patients. Between January 2019 and February 2020, 163 breast lesions in a total of 159 consecutive women who underwent US-guided core needle biopsy were included in the study. Before the biopsy, the lesions were examined with B-mode ultrasonography, SE, SWE, and pSWE (Fig. 1). Histopathological results after biopsy or surgery were considered the gold standard. Patients with no mass lesion or calcification without a mass, pure cystic lesion, or previous treatment history, such as breast surgery, chemotherapy and/or radiotherapy were excluded. The distribution of lesions allocated to the BI-RADS category in B-mode ultrasonography was as follows: 97 BI-RADS 3 (59.5%); 18 BI-RADS 4A (11.1%); 13 BI-RADS 4B (8.0%); 14 BI-RADS 4C (8.6%); and 21 BI-RADS 5 (12.8%). Biopsy indications of BI-RADS 3 lesions were as follows: presence of high-risk factors for breast carcinoma; the request of the attending physician and/or the patient; relief of excessive anxiety and fear of the patient; and lesions that could not be followed regularly with a short interval.
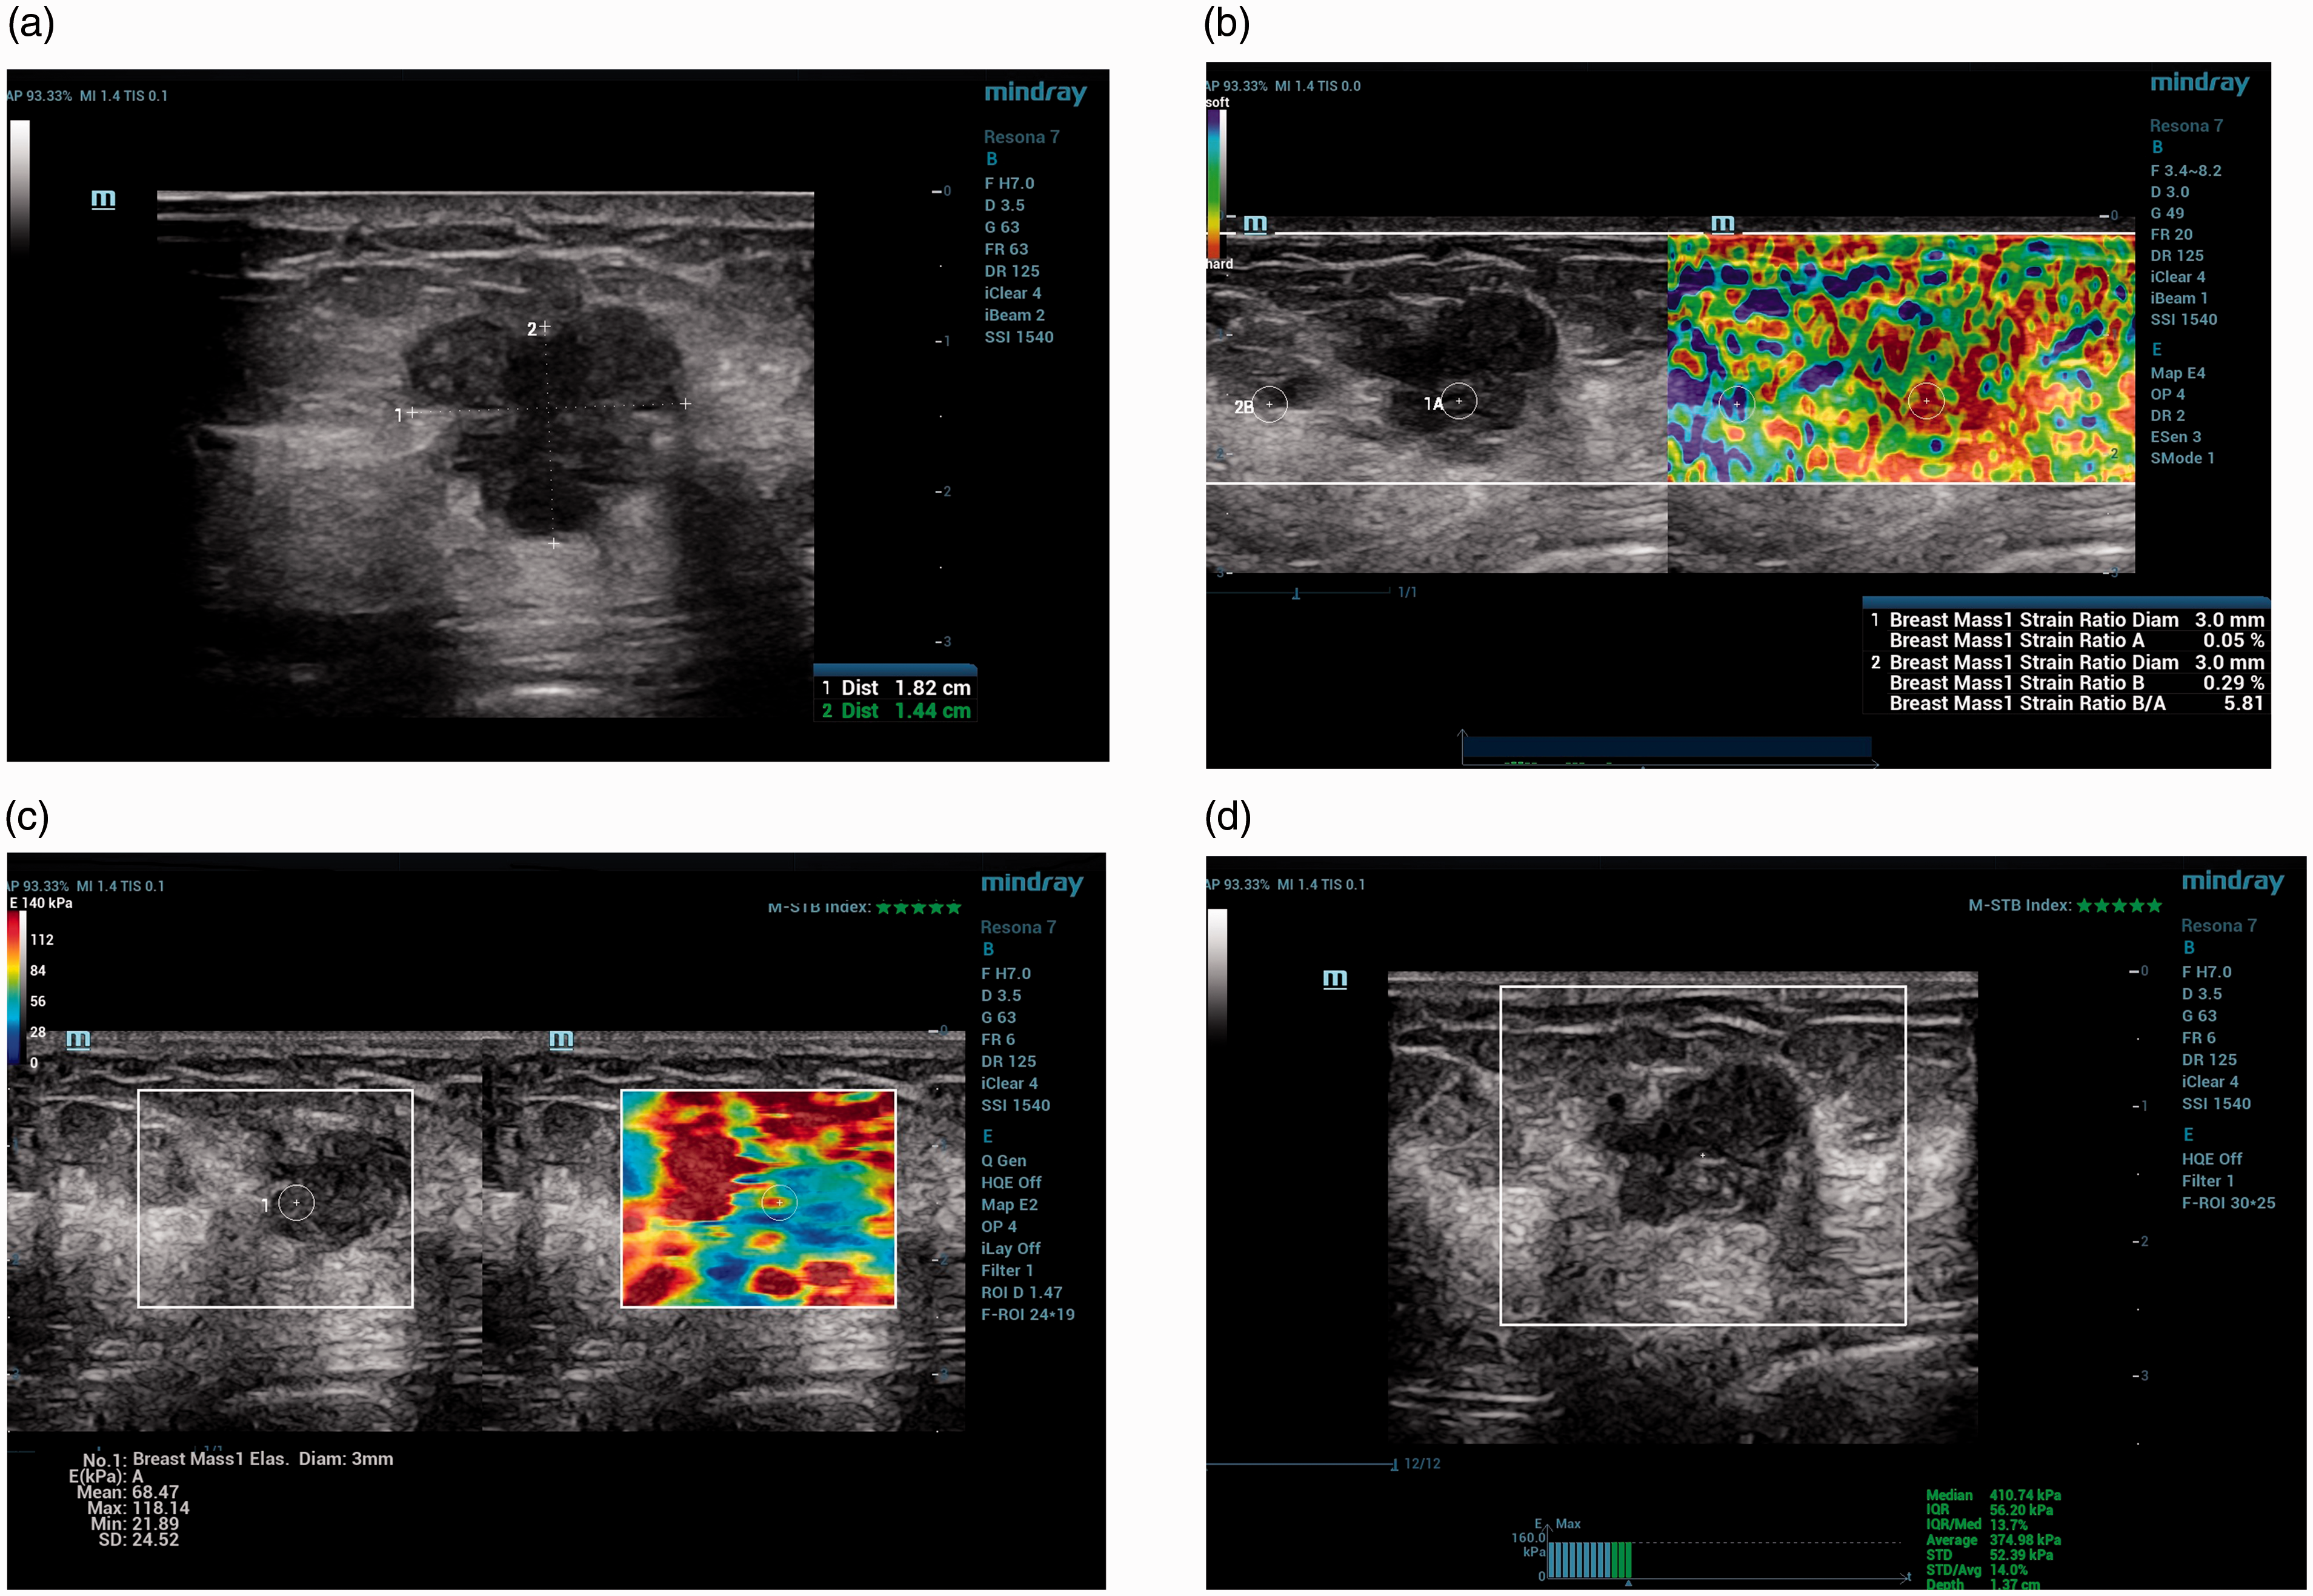
SE ratio, SE score, and SWE and STQ elastography results in a 51-year-old woman with breast cancer. (a) B-mode US demonstrated a 1.8-cm irregular, lobulated hypoechoic mass in the left breast at the 3 o’clock position with a category of BI-RADS 5. (b) The SE ratio was 5.81 and the SE score was 4. Both accurately predicted malignancy. (c) The SWEmean elasticity value was 169.45 kPa, the SWEmax elasticity was 252.28 kPa, and both correctly diagnosed malignancies (the number stated is the mean of the 5 SWE mean and SWE max measurements). (d) STQ elastography coded the mass with a mean elasticity value of 151.29 kPa, suggesting a malignant lesion. STQ, point shear wave elastography; SE, strain elastography; SWE, shear wave elastography; US, ultrasound.
Ultrasonography examinations
B mode, SE, SWE, and pSWE examinations were performed using the Mindray Resona 7 system with a linear probe (L6–14 Hz) (Mindray, PR China). Since the pSWE was named Sound Touch Quantification (STQ) on the Mindray Resona 7, we will use this term from now on. SE images were obtained first. Then, SWE and STQ images were obtained without changing the position of the patient. At least five measurements were made using each of the breast elastography techniques in the study, and the mean of these measurements was used.
A rectangular region of interest (ROI) was placed, focusing on the target tissue and including the nearby fat tissue. Compression was applied gently manually with the transducer perpendicular to the targeted lesion (20). Two ROIs were examined: first, the circle ROI with a diameter of 3–5 mm was placed in the hardest part of the target lesion; and then the second, rectangular ROI of the same diameter was inserted in nearby adipose tissue at the same depth, or if this was not possible, in subcutaneous adipose tissue. The system calculated one strain ratio per acquisition. The mean strain ratio, i.e. the ratio of fat strain to target strain (SE ratio), in the ROIs was computed by the system itself. In addition, the lesion was visually given a score of 1, 2, 3, 4, or 5 according to the Tsukuba score (SE score).
Two-dimensional SWE examinations were performed using the Sound Touch Elastography function on the Mindray Resona 7 US system. SWE images were obtained from the transducer without any compression. The system’s embedded ROI was adjusted to cover the lesion and normal surrounding tissue. Elasticity measurements were represented as colors varying from blue to red on the screen; dark blue showed the lowest elasticity value, while red was the highest (0–140 kPa). The fixed ROI was placed on the hardest part of the target lesion by the radiologist. When STQ was activated on the Resona 7 device, an examination area (ROI box) appeared for placement on the suspicious lesion. The ROI box has a fixed area when it is first selected, but the user can then change this area to be larger or smaller than the size selections available on the touch panel. The results obtained in STQ can be viewed simultaneously on the screen. For both SWE and STQ parameters, Young’s modulus E (kPa) is employed to quantify the hardness (6).
Image interpretation
B-mode ultrasonography, SWE, pSWE, and SE examinations of breast lesions were performed by a radiologist who had 14 years of breast US and two years of breast elastography experience. The examinations were performed over 20–30 min. For B-mode ultrasonography images, lesions were categorized as 3, 4a, 4b, 4c, or 5 according to the BI-RADS 5th edition. The cut-off values of the B-mode, shear wave, SE, and pSWE obtained from the data were evaluated and assessed as benign when below the cut-off value and as malignant when above the cut-off value. The radiologist performed an ultrasonographic examination, taking into account the clinical and mammographic findings of the patient. All modalities were evaluated separately.
A core needle biopsy was performed on all breast lesions included in this study using US and a 14-G biopsy needle (22-mm excursion; Geotek, Maxicore, Ankara, Turkey). The final diagnosis was based on the histopathological results.
Statistical analysis
SPSS software (IBM SPSS Statistics for Windows, Version 25.0, IBM Corp, Armonk, NY, USA) was used for statistical analysis of the data. A Mann–Whitney U test was used for data that were not normally distributed to compare groups. Categorical measurements are summarized as numbers and percentages, and continuous measurements are summarized as the mean ± SD (median and range where necessary). Receiver operating characteristic (ROC) curves were calculated to assign sensitivity, specificity, and cut-off values. The areas under the receiver operating characteristic curve (AUCs) were compared. The categorical variables between the methods were analyzed using McNemar’s test. In the present study, sensitivity, specificity, positive predictive values (PPV), and negative predictive values (NPV) between SWE, STQ, the SE ratio, the SE score (Tsukuba score), the BI-RADS category, and the pathologic outcome were evaluated, and differences between the methods were evaluated with 2019 MedCalc Software version 14.8.1 (MedCalc Software bvba, Ostend, Belgium). Statistical significance was taken as 0.05 in all tests.
Results
The mean age of the 159 patients enrolled in this cohort was 45.5 ± 15.9 years (age range = 16–83 years). The number of examined and biopsied lesions was 163, and two patients had two lesions. A total of 47 lesions (28.8%) were malignant, and 116 (71.2%) were benign.
Benign lesions comprised fibroadenoma (n = 72), inflammation and/or mastitis (n = 12), tubular adenoma (n = 10), fibrocystic changes (n = 7), benign phyllodes tumor (n = 1), and others (n = 14). Malignant lesions consisted of invasive ductal carcinoma (n = 36), invasive lobular carcinoma (n = 6), ductal carcinoma in situ (n = 4), and malignant lymphoma (n = 1).
The AUC, cut-off, and P values of the strain ratio, strain score, and SWE and STQ parameters in distinguishing benign and malignant breast lesions are demonstrated in Table 1.
Quantitative analysis of the differentiation of benign and malignant breast lesions.
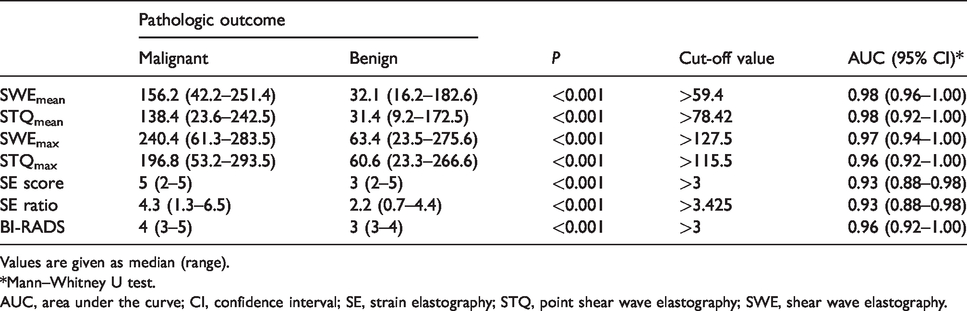
Values are given as median (range).
*Mann–Whitney U test.
AUC, area under the curve; CI, confidence interval; SE, strain elastography; STQ, point shear wave elastography; SWE, shear wave elastography.
Employing a cut-off value of over BI-RADS 3, the AUC value was 0.96. The median SE ratio for malignant masses was 4.3 and was in the range of 1.3–6.5. For benign masses, the median SE ratio was 2.2 (range = 0.7–4.4). Malignant lesions showed an SWEmax of 240.4 kPa (range = 61.3–283.5 kPa) and benign lesions showed an SWEmax of 63.4 kPa (range = 23.5–275.6 kPa). Malignant masses demonstrated a mean STQ of 138.4 kPa (range = 23.6–242.5 kPa) and benign masses demonstrated a mean STQ of 31.4 kPa (range = 9.2–172.5 kPa) (Table 1).
The distinctions between benign and malignant masses for the different modalities according to McNemar’s test was presented in Table 2. Among these four elastography modalities, there was no significance, but they showed close diagnostic performance to each other, but BI-RADS had statistically lower diagnostic performance due to the high false-positive rate. SWEmean, SWEmax, STQmean, and STQmax had notably higher specificity than B-mode US alone to differentiate benign and malignant masses (P < 0.001). Although not statistically significant, B-mode US showed a (marginally) higher AUC, sensitivity, and NPV than the SE techniques; however, SE revealed a higher diagnostic accuracy. The sensitivity of B-mode US, SWE, and STQ was slightly higher than that of the SE score and SE ratio but not significant. The SE score, SE ratio, SWE mean, SWE max, STQ mean and STQ max had a significantly higher PPV and diagnostic accuracy than B-mode US alone (Table 2).
Comparison of SWE, STQ, the SE ratio, the SE score, and BI-RADS for distinguishing benign and malignant breast lesions.
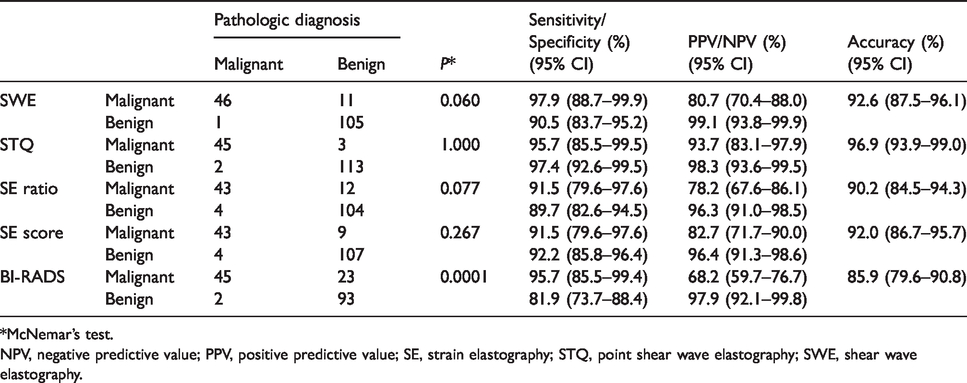
*McNemar’s test.
NPV, negative predictive value; PPV, positive predictive value; SE, strain elastography; STQ, point shear wave elastography; SWE, shear wave elastography.
The NPV of B-mode US and the SE score, SE ratio, SWEmean, SWEmax, STQmean, and STQmax were similar (Table 2). SWE and STQ parameters had the highest AUC values, while the SE score and SE ratio had the lowest AUC value (Table 1). ROC curves are shown in Fig. 2. The SE ratio demonstrated a similar diagnostic performance (P > 0.05) to the quantitative SWE and STQ parameters, that is, SWEmax, SWEmean, STQmax, and STQmean.
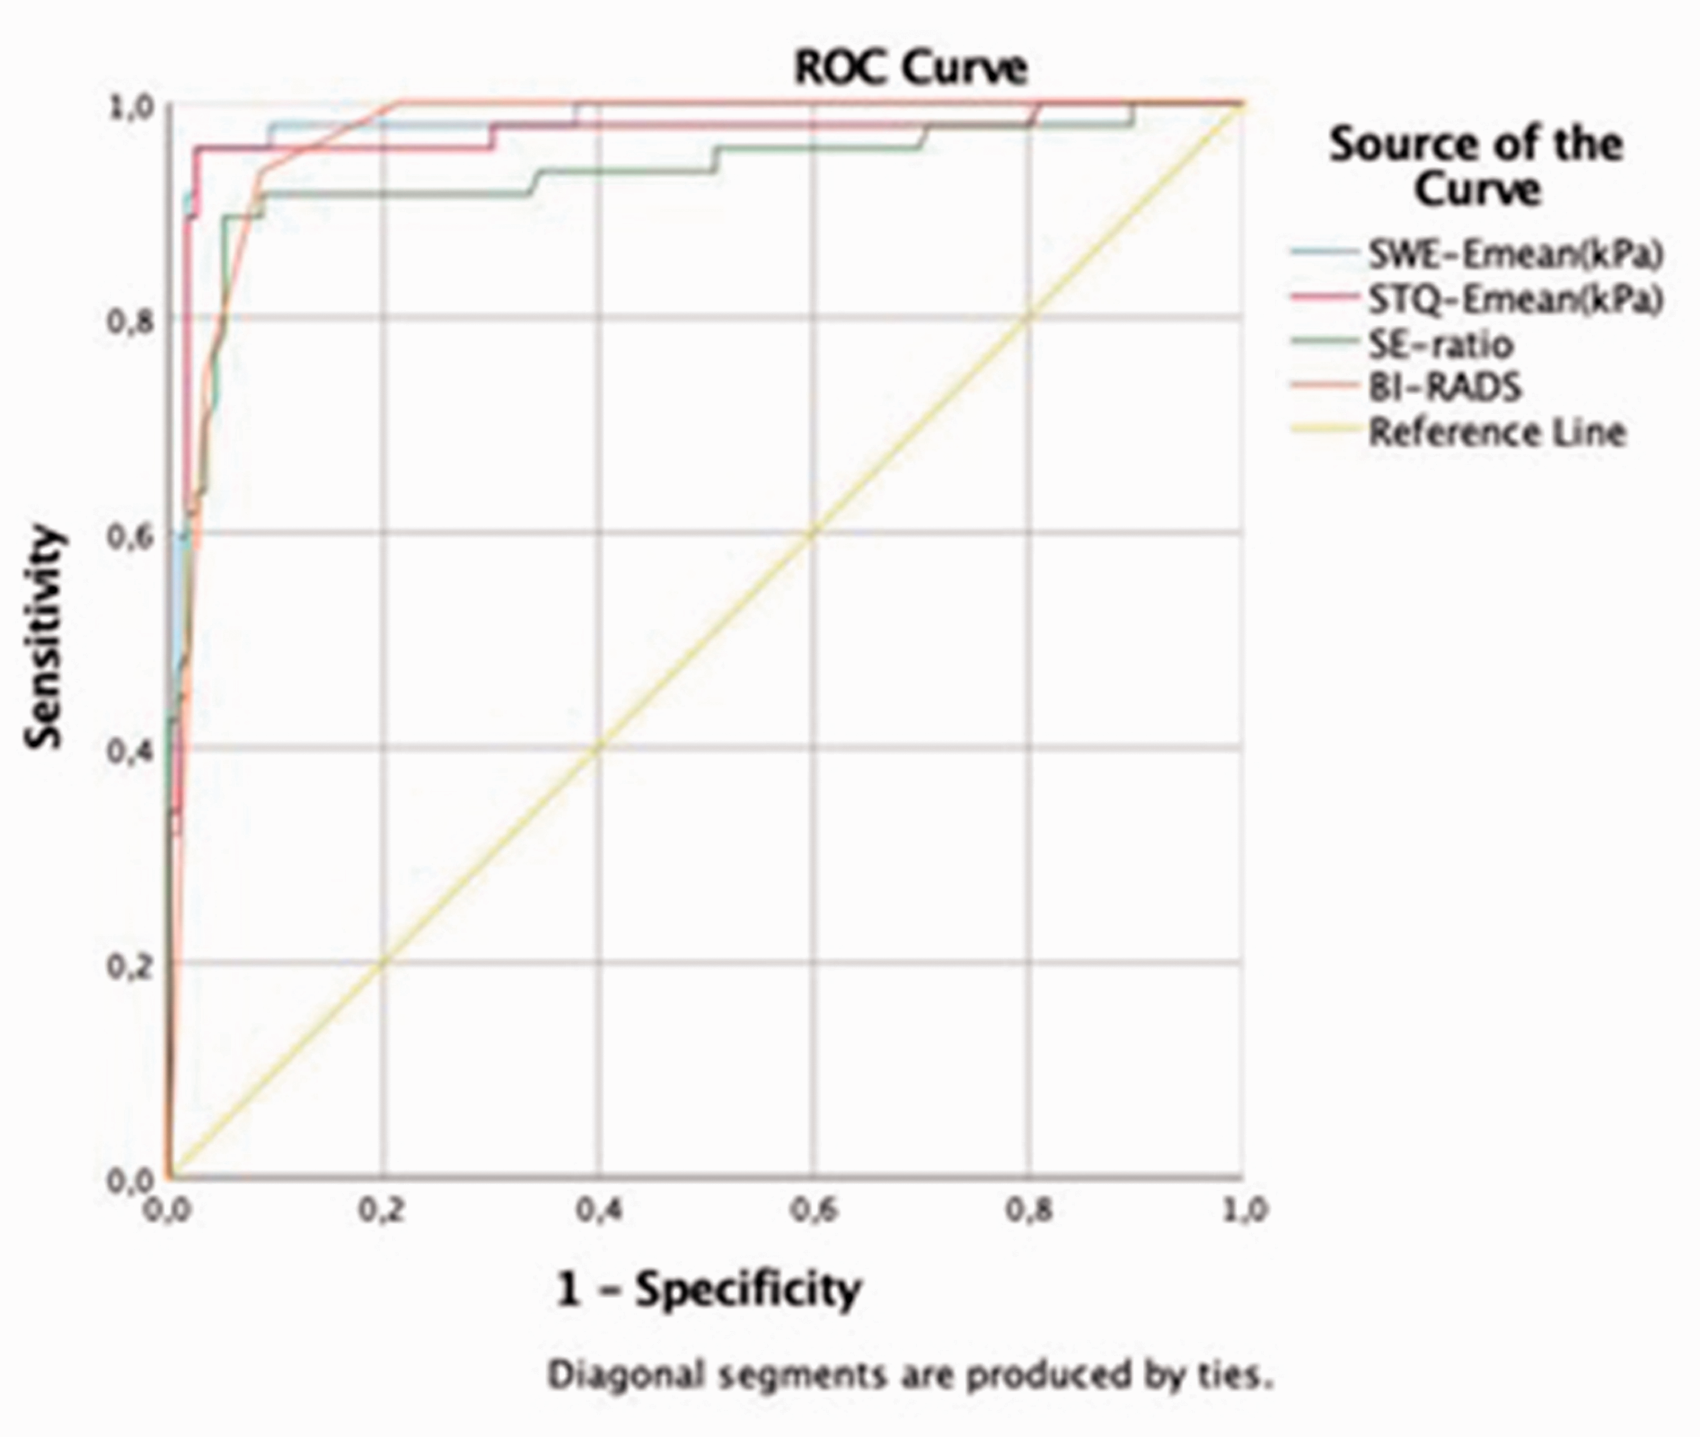
Receiver operating characteristic curves for SWE, STQ, the SE ratio, and B-mode US (BI-RADS). STQ, point shear wave elastography; SE, strain elastography; SWE, shear wave elastography; US, ultrasound.
Discrepant results for 24 (14.7%) breast lesions via BI-RADS, SWE, STQ, the SE ratio, and SE scores are shown in Table 3. In one benign phyllodes tumor, the SWE and STQ parameters were diagnosed correctly, but the SE ratio and SE score were false positives. Accurate results in three ductal carcinomas in situ were obtained on SWE and STQ. In these cases, the SE ratio was 2.19, 2.68, and 1.03, and the SE score was 3. In a case diagnosed with invasive ductal carcinoma, the SE rate and SE score correctly diagnosed malignancy, while the SWE and STQ parameters failed (Fig. 3).
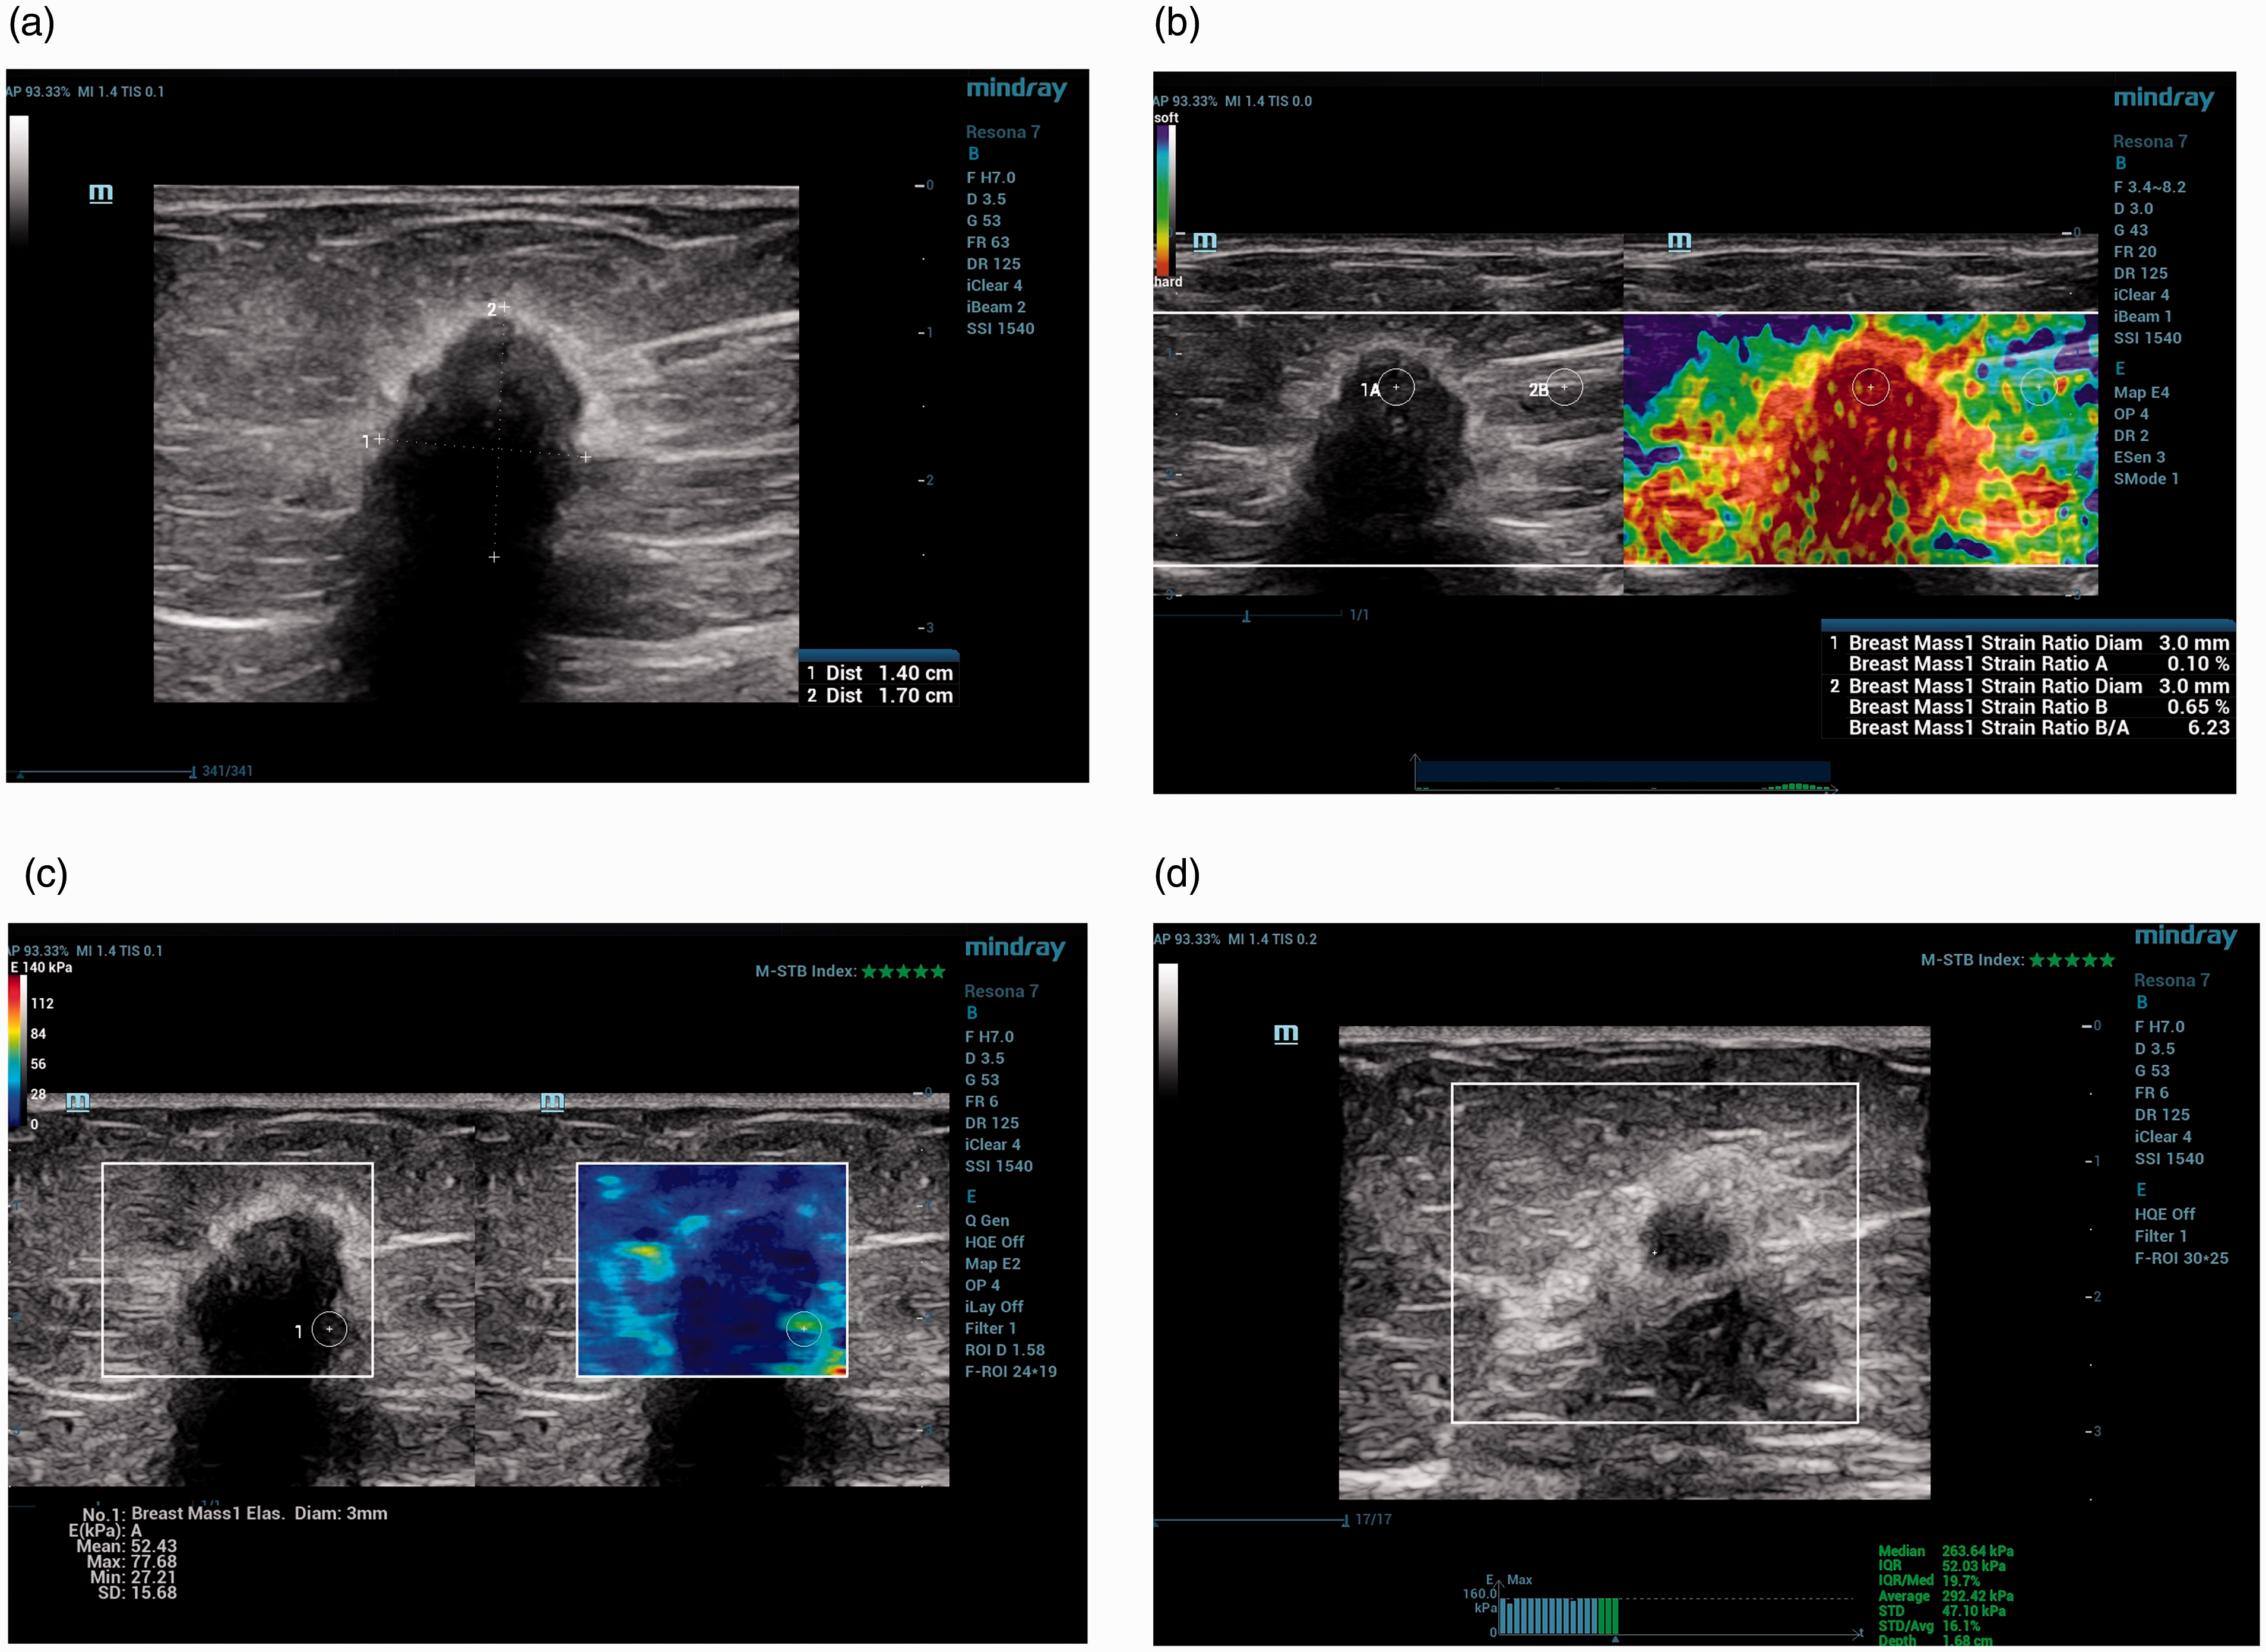
Comparison of discrepant results for SWE, STQ, the SE ratio, and the SE score.
DCIS, ductal carcinoma in situ; FA, fibroadenoma; FC, fibrocystic change; GM, granulomatosis mastitis; IDC, invasive ductal carcinoma; SE, strain elastography; STQ, point shear wave elastography; SWE, shear wave elastography.
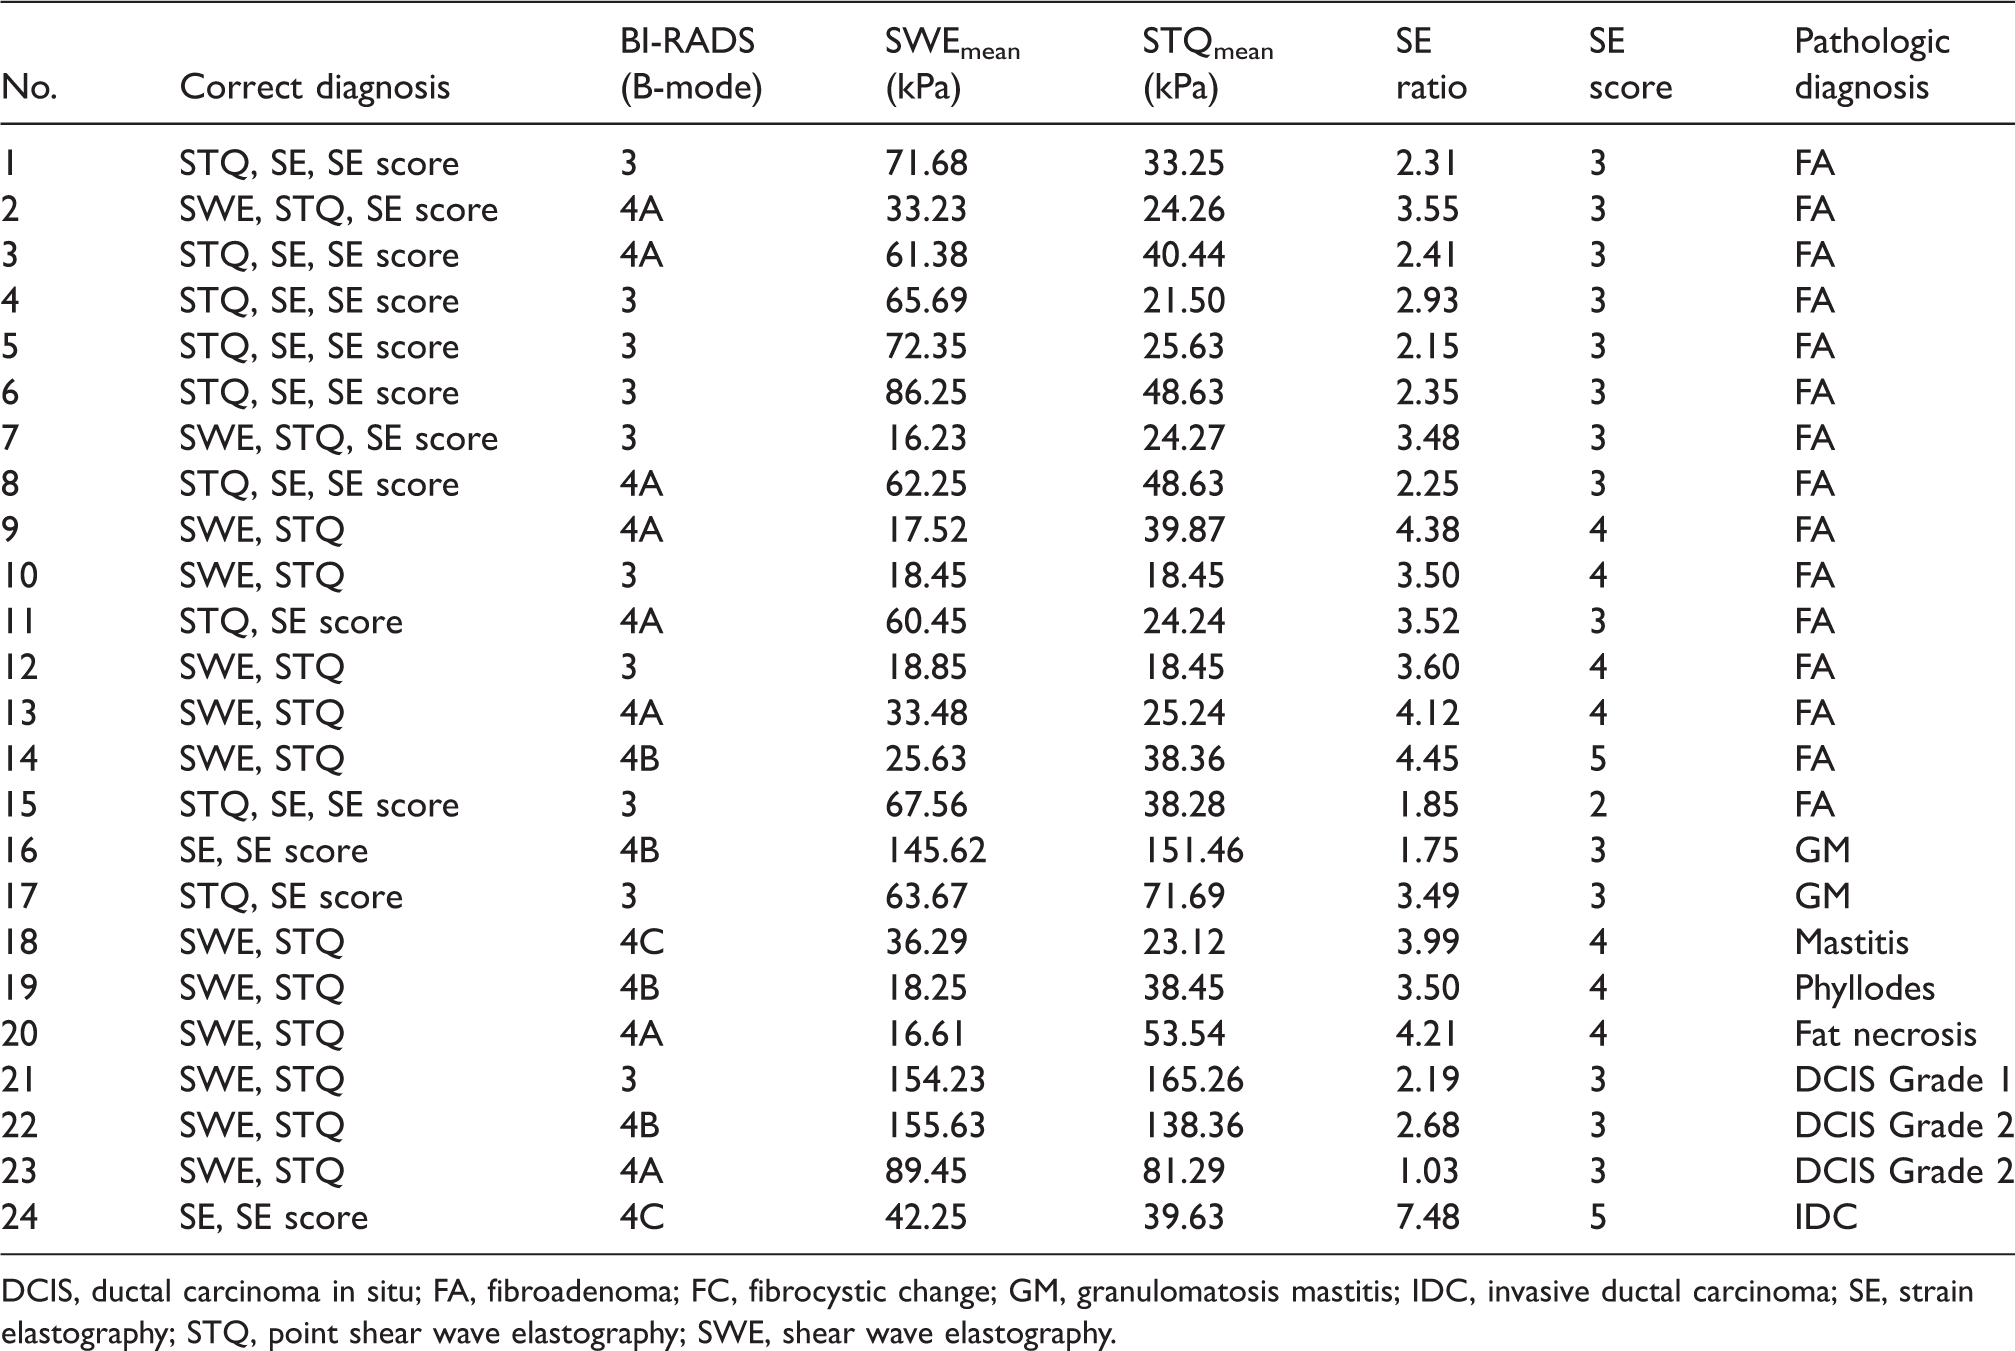
Discrepant results related to the SE ratio, SE score, SWE, and STQ in a 57-year-old woman with breast cancer. (a) B-mode US showed a 1.7-cm irregular spiculated hypoechoic mass in the right breast at the 11 o’clock position with a category of BI-RADS 5. (b) The SE ratio and SE score correctly diagnosed malignancy. The strain ratio was 6.23 and the SE score (Tsukuba score) was 5. (c) The SWEmean elasticity value was 42.25 kPa and the SWEmax elasticity 61.35, both of which were under the cut-off value, suggesting a benign lesion (the number stated is the mean of the 5 SWEmean and SWEmax measurements). (d) STQ measured the lesion with a mean elasticity of 39.63 kPa, suggesting a benign lesion. STQ, point shear wave elastography; SE, strain elastography; SWE, shear wave elastography; US, ultrasound.
Discussion
Previous studies determined that the sensitivity of US was high, even 100%, but the specificity was low (21). Therefore, due to the low specificity of US, there is a requirement for less invasive procedures that can ensure greater accuracy for distinguishing benign and malignant breast lesions (2,22).
In the present cohort, additional diagnostic values of three breast elastography methods on traditional B-mode US were assessed concurrently to distinguish benign and malignant breast lesions during a single US. SE (ratio and score) or SWE and pSWE (STQ) with B-mode US enhanced the diagnostic success with improved specificity, and SWE and pSWE were notably more helpful than SE; however, there was no important difference between qualitative and quantitative evaluations. B-mode US showed a (marginally) higher AUC, sensitivity, and NPV than the SE techniques; however, SE revealed a higher diagnostic accuracy. The specificity and PPV of B-mode US were 81.9% and 68.2%, respectively, but adding SE, SWE, and STQ to B-mode US increased the specificity and PPV.
Various studies have shown that combining an elastography method with traditional B-mode US enhances diagnostic performance to distinguish benign and malignant breast lesions. Cohorts comparing SE (score and ratio) directly with SWE and STQ in the same patients are limited (10,11,17–19). In the study by Chang et al. (17), the sensitivity of SWE was higher than that of SE, and the specificity of SE was higher than that of SWE. However, the overall diagnostic performances of those two elastography techniques were similar. Barr and Zhang (23) reported superior diagnostic performance for SE over shear wave velocity imaging. Kim et al. (24) applied SWE and SE on the same breast lesions and combined B-mode US findings with SWE and SE findings. The SWE and SE yielded higher specificity, accuracy, and PPV than B-mode US alone. In their study, both SWE and SE succeeded in differentiating benign and malignant lesions; however, the authors did not compare the diagnostic success of each elastography technique. In the present study, when the sensitivity, specificity, PPV, NPV, and diagnostic accuracies were compared, there was no statistically significant difference among the SE ratio, SE score, and the SWE and STQ techniques, but all of them increased the diagnostic performance of B-mode US. Chang et al. (17) and Kim et al. (24) used US systems by different vendors, but in the present study, we used only one US system to simultaneously obtain SE, SWE, and STQ images. Singla et al. (10) reported that the SE score, SE ratio, SWEmean, and SWEmax yielded importantly higher specificity than the B-mode-based BI-RADS alone to differentiate malignant and benign masses. These findings were consistent with our study. However, unlike their study, in our study, we also applied the pSWE technique, which had the highest AUC, PPV, and diagnostic performance values. To the best of our knowledge, this is the first study to assess the comparison of SE (both score and ratio), SWE, and pSWE to evaluate breast lesions with qualitative and quantitative methods using a single US system. In the present cohort, the SE score, SE ratio, SWE mean, SWE max, STQ mean and STQ max with B-mode US had higher diagnostic success then B-mode US alone; however, STQ and SWE were more helpful than SE. Although not significant, SWEmax showed better diagnostic performance than SWEmean.
In the present study, in two patients, B-mode US had false-negative malignant lesions, including ductal carcinoma and ductal carcinoma in situ. In the case of invasive ductal carcinoma, only the SE score and SE ratio and in ductal carcinoma in situ, only SWE and STQ made the correct diagnosis (Table 3). Chang et al. (17) and Fujiko et al. (11) reported that mildly aggressive tumors may be considered to have low stiffness values on US elastography even if the tumor is malignant (11–17). In 11 cases, there were false-positive findings among the discrepant results on B-mode ultrasonography. In these cases, with the addition of elastography to the B-mode US, the correct diagnosis was made with STQ in 10 (90.9%) cases, SWE in 7 (63.6%) cases, SE score in 5 (45.4%) cases, and SE ratio in 3 (27.2%) cases.
The limitation of the present study was that inter-observer variability could not be evaluated, as only one radiologist was included in the breast elastography assessment.
In conclusion, B-mode US with SE (ratio and score), SWE, and STQ (pSWE) increased diagnostic performance for distinguishing between malignant and benign breast masses. SE (score and ratio), SWE, and STQ had better specificity, PPV, and diagnostic accuracy than B-mode alone based on BI-RADS. STQ had the highest PPV, NPV, and diagnostic accuracy. SWE and STQ were more helpful than SE; however, there was no important difference between the qualitative and quantitative evaluations.
Footnotes
Declaration of conflicting interests
The author(s) declared no potential conflicts of interest with respect to the research, authorship, and/or publication of this article.
Funding
The author(s) received no financial support for the research, authorship, and/or publication of this article.