



Abstract
Background
Renal oncocytoma (RO) and chromophobe renal cell carcinoma (chRCC) have a common cellular origin and different clinical management and prognosis.
Purpose
To explore the utility of computed tomography (CT) in the differentiation of RO and chRCC.
Material and Methods
Twenty-five patients with RO and 73 patients with chRCC presenting with the central scar were included retrospectively. Two experienced radiologists independently reviewed the CT imaging features, including location, tumor size, relative density ratio, segmental enhancement inversion (SEI), necrosis, and perirenal fascia thickening, among others. Interclass correlation coefficient (ICC, for continuous variables) or Kappa coefficient test (for categorical variables) was used to determine intra-observer and inter-observer bias between the two radiologists.
Results
The inter- and intra-reader reproducibility of the other CT imaging parameters were nearly perfect (>0.81) except for the measurements of fat (0.662). RO differed from chRCC in the cortical or medullary side (P = 0.005), relative density ratio (P = 0.020), SEI (P < 0.001), and necrosis (P = 0.045). The logistic regression model showed that location (right kidney), hypo-density on non-enhanced CT, SEI, and perirenal fascia thickening were highly predictive of RO. The combined indicators from logistic regression model were used for ROC analysis. The area under the ROC curve was 0.923 (P < 0.001). The sensitivity and specificity of the four factors combined for diagnosing RO were 88% and 86.3%, respectively. The correlation coefficient between necrosis and tumor size in all tumors including both of RO and chRCC was 0.584, indicating a positive correlation (P < 0.001).
Conclusion
The CT imaging features of location (right kidney), hypo-density on non-enhanced CT, SEI, and perirenal fascia thickening were valuable indicators in distinguishing RO from chRCC.
Keywords
Introduction
Renal oncocytoma (RO), the second most common benign renal tumor, originates from the epithelial cells of the proximal renal tubule and accounts for 3%–7% of all renal lesions (1,2). It was first reported by Klein and Valensi in 1976. RO is usually asymptomatic and observed incidentally during routine examination. Chromophobe renal cell carcinoma (chRCC) is the third most frequent subtype of renal cell carcinoma, which shares a common cellular origin with renal oncocytoma. Although chRCC was considered less aggressive than other renal cell neoplasms, it still has a metastatic potential and could lead to death (1). Differentiation of RO from chRCC would be important before surgery as RO could be observed or managed conservatively (3) and the complication burden associated with surgical removal is not negligible (4), whereas chRCC should be treated by partial or radical nephrectomy (5). Due to the common cellular origin, overlapping morphological characteristics and different clinical treatments, the accurate preoperative distinction between RO and chRCC would be of great interest. Due to the limited sample and tumor cell seeding in the needle track, biopsy is not preferred for the preoperative diagnosis as an invasive examination (6). In contrast, as a non-invasive method, radiology examination is considered the first-line option for the diagnosis of RO before surgery. Studies have shown that chRCC and RO overlap not only in morphological and immunological manifestations, but also in similar imaging manifestations (1), including central scar. Some previous studies (7,8) have reported that central scar is not a specific feature. Therefore, it is hard to distinguish RO from chRCC solely by the presence of the central scar.
The aim of the present study was to review the computed tomography (CT) imaging features of RO and chRCC, in both of which the central scar was present, and to determine if there are some characteristics except the central scar that can help to differentiate the two tumors.
Material and Methods
Patients
This study was approved by the Institutional Review Board of our hospital, and informed consent was waived due to retrospective nature of the study. The inclusion criteria were as follows: (i) the cases were collected between January 2000 and May 2020 (n = 496); (ii) all pathological reports were proven by histology through partial nephrectomy or radical nephrectomy; (iii) multidetector CT (MDCT) using non-enhanced protocol and triphasic contrast-enhanced protocol was used for all cases before surgery; (iv) the central scar was present in each case in both the RO and chRCC groups and which had been confirmed by histopathological findings. The exclusion criteria were as follows: (i) pathological reports originating from fine needle biopsies were excluded (n = 56); (ii) MDCT using non-enhanced protocol was not available before surgery (n = 102); (iii) MDCT using triphasic contrast-enhanced protocol was not available before surgery (n = 89); (iv) the central scar was not present on CT imaging (n = 151). A total of 98 patients with RO (n = 25) and chRCC (n = 73) were enrolled in the present study. The flow diagram of the study population is shown in Fig. 1.

The flow diagram of the study population.
CT image acquisition
CT examinations, including non-enhanced CT and a triphasic contrast-enhanced CT, were performed on a 64-channel MDCT scanner (Discovery CT 750 HD, GE Healthcare, Chicago, IL, USA). The acquisition parameters were 120 kVp, automatic tube current modulation, and tube rotation of 0.5 s. Axial images were acquired with a section thickness of 2.5 mm and reconstructed in the coronal and sagittal planes from the source data with a section thickness of 2 mm. All images were sent to a picture archiving and communication system (PACS) to be reviewed on workstations.
Non-ionic intravenous contrast material (80–100 mL, iopromide, Ultravist 370, Bayer Schering Pharma, Berlin, Germany) was administered with a power injector at a rate of 3.0 mL/s. The corticomedullary phase was acquired at 35–40 s after the start of contrast injection according to bolus tracking. The nephrographic phase and excretory phase were acquired at 90 s and 7–9 min, respectively.
CT features evaluation
Two abdominal radiologists with 10 years of experience, who were blinded to the final diagnosis, reviewed the image on PACS. The intra-observer and inter-observer bias between the two observers were evaluated. When disagreement was present, a consensus would be reached. The following features were described independently: laterality (left or right kidney); cortical or medullary side; tumor size (the maximum diameter); relative density ratio on non-enhanced CT; segmental enhancement inversion (SEI) (yes or no, “SEI” was defined as to be present when there are two differently enhancing segments on the corticomedullary phase images with the relative degree of enhancement reversed on the nephrographic phase images) (9); necrosis (yes or no, “necrosis” was defined as the lesion shows irregular and heterogeneous hypo-density area with none enhancement on contrast-enhanced CT); cystic components (yes or no, “cystic components” was referred as round and homogeneous hypo-density area with none enhancement on contrast-enhanced CT); hemorrhage (yes or no); calcification (yes or no); fat (yes or no, “fat” was defined as CT value in the range of –90 HU to –30 HU); perirenal fascia thickening (yes or no, “perirenal fascia thickening” was referred as focal lesion with a well-defined interface between fat and tumor) (10); lymph node enlargement (yes or no, “lymph node enlargement” was referred to as the short diameter >1 cm); renal vein thrombosis (yes or no); and ascites (yes or no).
To normalize the variations due to individual patient factors and technical factors, the relative density ratio (the lesion attenuation/the parenchyma attenuation) was calculated by the absolute measurement of the lesion dividing that of adjacent normal renal parenchyma on non-enhanced CT. The region of interest (ROI) of approximately 15–20 mm2 was placed at the tumor parenchyma area to avoid partial volume effects, necrosis, cystic components, hemorrhage, calcification, and fat. The ROI was also placed in the adjacent normal renal parenchyma (Fig. 2a). Each ROI was measured three times during the three continuous slides for each case and the mean value was used. When the ratio was <1.0, it was called hypo-density. When the ratio was ≥1.0, it was called hyper-density or iso-density.
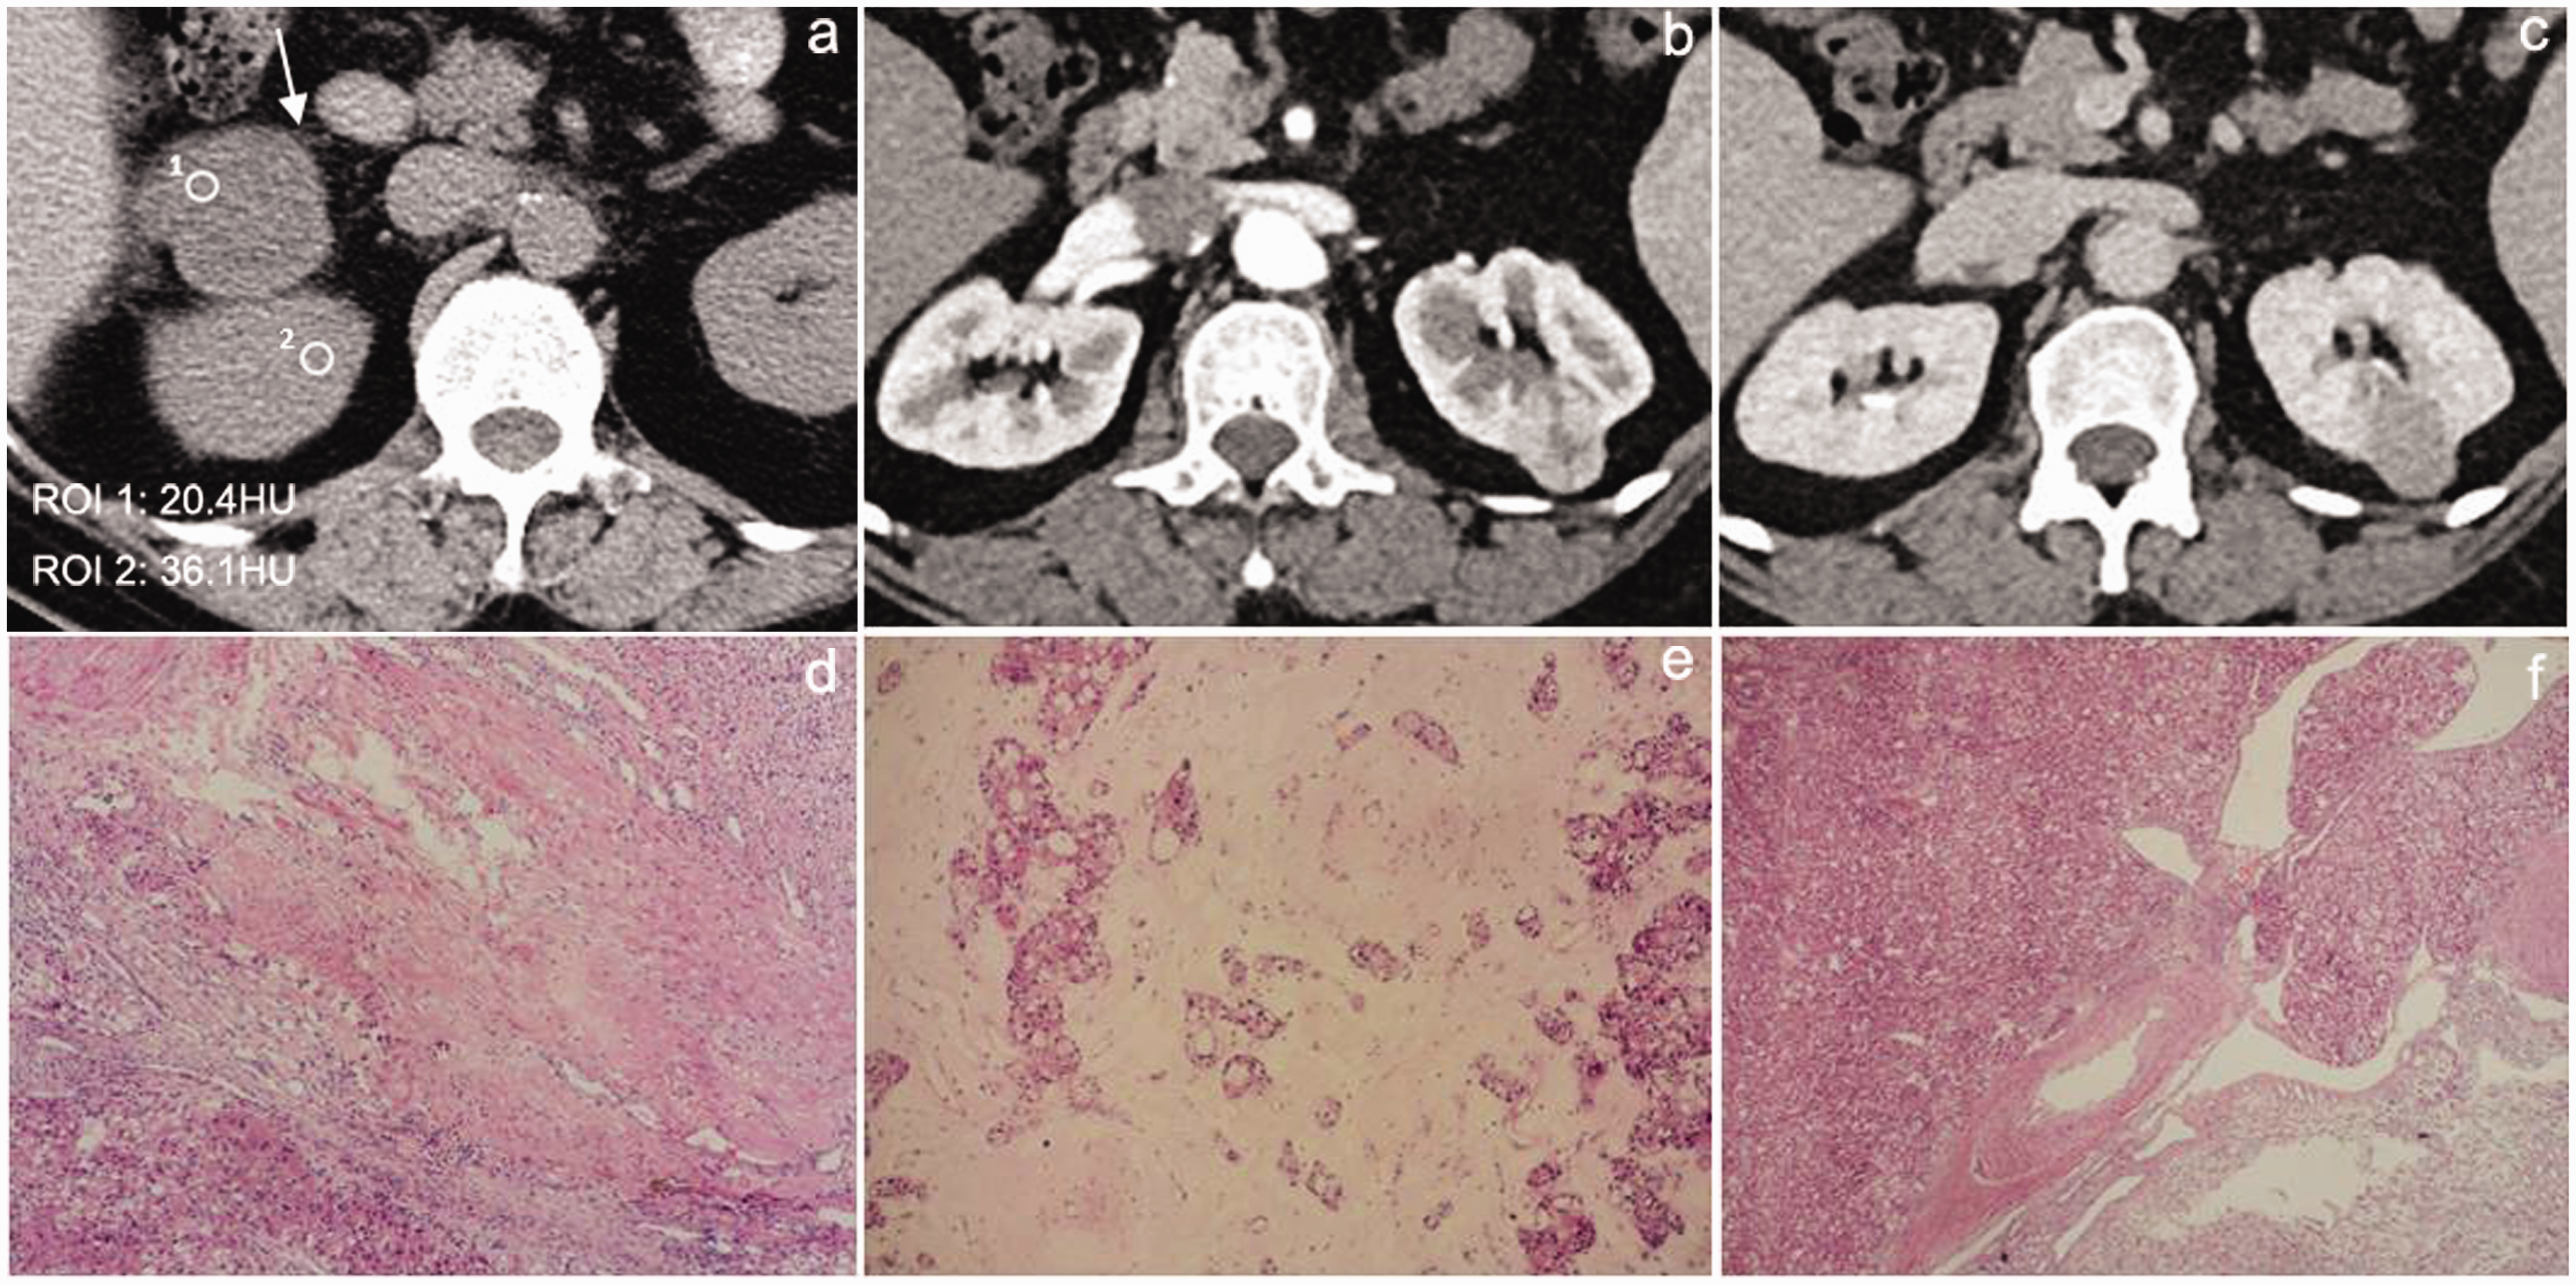
RO of a 56-year-old woman in the upper polar of right kidney (a). Unenhanced CT scan showed a hypo-density soft-tissue mass together with perirenal fascia thickening (white arrow); “ROI 1” represents the lesion attenuation and “ROI 2” represents the parenchyma attenuation. Then, the relative density ratio (ROI 1/ROI 2) was calculated (20.4 HU/36.1 HU=0.57). (b, c) Another 49-year-old patient with RO: contrast-enhanced CT scan showed SEI on corticomedullary (b) and excretory phase images (c); a central stellate scar displayed progressive enhancement. (d–f) Histological examination of RO: the tumor shows the central scar (d, magnification × 100), tumor cells distributed in fibrous connective tissue with sparse cells and stromal edema (e, magnification × 100), and incomplete pseudocapsule (f, magnification × 100). CT, computed tomography; RO, renal oncocytoma; ROI, region of interest; SEI, segmental enhancement inversion.
Statistical analysis
All statistical analyses were performed by SPSS statistical software (version 20.0, IBM Corp., Armonk, NY, USA). Interclass correlation coefficient (ICC, for continuous variables) or Kappa coefficient test (for categorical variables) was used to determine intra-observer and inter-observer bias between the two radiologists. The following convention was used to interpret the intra-observer and inter-observer agreements: <0.20 = poor; 0.21–0.40 = fair; 0.41–0.60 =moderate; 0.61–0.80 = substantial; and 0.81–1.00 =nearly perfect.
For quantitative variables, the values are described as the mean ± standard deviation (SD), and two independent samples t-tests were used for comparison between the two groups. The categorical variables are described as frequency rates and percentages, and the chi-square test or Fisher’s exact test were used for comparison. For logistic regression analysis, quantitative variables were transformed into categorical variables. Then binary logistic regression analysis was used to screen for the independent predictors of RO. Receiver operating characteristic (ROC) analysis were employed to investigate the diagnostic ability of the combined parameters, which had statistical significance from logistic regression model. The sensitivity and specificity were calculated. Kendall’s tau-b correlation coefficient was used to analyze the correlation between necrosis and tumor size. P < 0.05 was considered statistically significant.
Results
There were 25 patients in the RO group (10 men, 15 women; age range = 15–77 years; mean age = 57 years). In contrast, there were 73 patients in the chRCC group (28 men; 45 women; age range = 21–77 years; mean age = 52 years). The tumor sizes of RO and chRCC were 37.29 ± 5.79 mm and 53.20 ± 3.22 mm, respectively (t = 1.515, P = 0.134).
Table 1 showed the inter- and intra-reader reproducibility for measurements of CT imaging features between two radiologists. Apart from the measurement of fat, the reproducibility of the other parameters was nearly perfect (>0.81).
The inter- and intra-reader reproducibility for measurements of CT imaging features between the RO and chRCC groups.
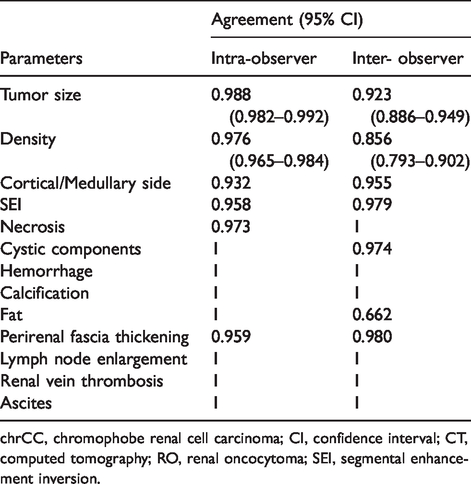
chrCC, chromophobe renal cell carcinoma; CI, confidence interval; CT, computed tomography; RO, renal oncocytoma; SEI, segmental enhancement inversion.
Table 2 summarized the detailed comparison of CT imaging features between RO and chRCC. The cortical/medullary side (P = 0.005), density (P = 0.020), SEI (P < 0.001), and necrosis (P = 0.045) between the two groups were statistically significant. However, the other clinical and CT features, including sex, laterality (left or right), cystic components, hemorrhage, calcification, fat, perirenal fascia thickening, lymph node enlargement, renal vein thrombosis, and ascites had no statistical differences between the two groups.
CT imaging findings between the RO and chRCC groups.

Values are given as n (%) or mean ± SD.
chrCC, chromophobe renal cell carcinoma; CI, confidence interval; CT, computed tomography; RO, renal oncocytoma; SEI, segmental enhancement inversion.
In the RO group, most tumors were located in the right kidney (n = 16, 64.0%), compared to only 43.8% in the chRCC group. Fifteen cases (60%) were in the cortical side in the RO group, which was higher than that of chRCC (n = 21, 28.8%). In the RO group, 23 cases (92.0%) showed hypo-density and 22 cases (88.0%) presented SEI, whereas only 68.5% of cases presented hypo-density and 20 cases (27.4%) showed SEI in the chRCC group. In addition, the chRCC group exhibited higher necrosis (27.4%) than the RO group (n = 2, 8.0%).
Table 3 presented the results of binary logistic regression analysis in relation to RO. The laterality (right kidney), hypo-density on non-enhanced CT, SEI, and perirenal fascia thickening were four independent predictors of RO (P < 0.05). ROC analysis was based on the combined parameters from logistic regression model. The area under the ROC curve (AUC) was 0.923 (95% confidence interval [CI] = 0.865–0.981; P < 0.001) (Fig. 3). The sensitivity and specificity of the four factors combined for diagnosing RO were 88% and 86.3%, respectively.
Univariate logistic analysis of CT features for RO.

CI, confidence interval; CT, computed tomography; RO, renal oncocytoma; SEI, segmental enhancement inversion.

Receiver operating characteristic curve.
The cut-off value of tumor size was 5 cm, including both of RO and chRCC. Twenty-two cases (two of RO and 20 of chRCC) were >5 cm, of which 20 cases (20/22, 90.09%) presented with necrosis. The correlation coefficient between necrosis and tumor size was 0.584, indicating a positive correlation (P < 0.001). Characteristic imaging findings of RO and chRCC in different CT phases and pathological changes are shown in Figs. 2 and 4.

A 47-year-old male patient with chRCC in the right kidney. (a) Axial corticomedullary, (b) nephrographic, and (c) excretory phase images in the middle of the lesion demonstrate an area of central stellate scar that is under-enhanced. In all three phases, the degree of contrast enhancement of the tumor is less than that of the normal renal cortex. (d–f) Histological examination of chRCC: the tumor shows the central scar (d, magnification × 100), tumor cells with prominent cell border, clear to slightly eosinophilic cytoplasm and perinuclear halo (e, magnification × 200), and complete pseudocapsule (f, magnification × 200). chRcc, chromophobe renal cell carcinoma.
Discussion
The present study elicited four main findings. First, SEI was more common in RO (n = 22, 88.0%) than in chRCC (n = 20, 27.4%). Second, perirenal fascia thickening was a critical CT imaging feature for the differential diagnosis of RO from chRCC. Third, hypo-density on non-enhanced CT was present in 92.0% of RO, compared with only 68.5% of chRCC. Finally, necrosis was also helpful in distinguishing RO from chRCC.
Much effort has been made to identify imaging characteristics that could be useful in distinguishing RO from chRCC (6,11–14). In previous studies (9,15–18), investigators demonstrated that SEI in contrast-enhanced CT is helpful in diagnosing RO and differentiating it from chRCC. Schieda et al. (14) reported the prevalence of SEI as 87%–100%, which agreed with our report. In the present study, SEI was present in 88% of ROs (22/25) and in 27.4% of chRCCs (20/73). Although SEI was helpful in diagnosing RO, it was an imaging characteristic which was present only on contrast-enhanced CT. Apart from SEI, we found some other useful CT imaging features that could distinguish these two tumors, such as perirenal fascia thickening, hypo-density, and necrosis. As we have seen, perirenal fascia thickening, hypo-density, and necrosis had been reported from an imaging perspective in only a few previous studies.
Perirenal fascia thickening was also a critical CT imaging feature for the diagnosis of RO. As far as we know, it had been mentioned from an imaging perspective in few previous reports. Renal oncocytomas can be locally invasive and protrude into perinephric adipose tissue (10). It might be related to the incomplete or absent tumor pseudocapsule of RO. Alma et al. (19) reported that the tumor fibrous capsule was present in 66.7% cases of chRCC and in only 10.5% cases of RO. Oleksandr (20) reported that 96% of RO characteristically exhibited an incomplete or absent tumor peritumoral pseudocapsule compared with only 72% of chRCC. Furthermore, the average thickness of the capsule in RO (115.4 µm) was thinner than that of chRCC (337.7 µm) (19). Besides the local invasion of the tumor, the growth pattern of RO might also contribute to perirenal fascia thickening (21). Perez-Ordonez et al. (21) reported that ROs were slow-growing tumors with pushing borders that compress adjacent tissue. Due to the growth pattern described above, the tumors compress the adjacent renal parenchyma and perinephric adipose tissue and cause ischemic and hypoxic change. Then, a zone of fat induration of perinephric adipose tissue will come up, which would display perirenal fascia thickening on CT imaging. In addition, we supposed that perirenal fascia thickening might be also related to the location of the tumor. In the present study, 15 of 25 cases in the RO group were located in the cortical side of kidney, and it might make the tumor more likely to contact, even invade or compress the perirenal fascia. In the present study, the tumor fibrous capsule was incomplete or absent in 14 cases of RO and in 36 cases of chRCC by pathological analysis, which was consistent with the literature above. We speculated that the perirenal fascia thickening of RO might be related to the incomplete or absent tumor peritumoral pseudocapsule and growth pattern of the tumor. Unlike SEI, the sign of perirenal fascia thickening could be easily observed on non-enhanced CT, which would allow significant reductions in CT scanning time and healthcare costs.
In the present study, hypo-density was also a distinct feature of RO. As far as we know, it had not been discussed in previous reports from an imaging perspective. It might be related to the pathological differences between RO and chRCC: (i) RO is a benign tumor, and its pathological characteristic is that nested tumor cells are distributed in fibrous connective tissue with sparse cells and stromal edema (or hyalinization) (22) while chRCC is a malignant tumor, and stromal edema or hyalinization was uncommon; (ii) Sung et al. (22) found that the nuclear diameter ratio and the nearest nuclear distance were significantly larger in chRCC than in RO, and the larger nearest nuclear distance means a larger cell size. Given the above points, both cell density and cell size could result in hypo-density of the tumor, which was more often in RO than in chRCC.
In addition, to the best of our knowledge, there are few studies on distinguishing RO from chRCC by the CT imaging feature of necrosis. Although the sign of necrosis was uncommon, it was still found that necrosis was more common in chRCC (20/73, 27.4%) than in RO (2/25, 8.0%) (P = 0.045). When the tumor size was > 5 cm, it was prone to necrosis.
The present study has some limitations. First, the study was performed retrospectively and had some selection bias. We compared only RO and chRCC, and evaluations of other renal masses were not conducted. A prospective study might be needed to support these results. Second, the number of renal oncocytomas selected was relatively small. Larger-scale studies with more patients should be able to further corroborate our results. Third, it might be interesting to compare the results with other correcting attenuation methods (23). We plan to do this in a future study. Fourth, the criteria of “fat” was based only on the CT attenuation in the present study, and further protocol of measurement needs to be solved.
In conclusion, CT imaging features such as right laterality, hypo-density, SEI, and perirenal fascia thickening were more common in RO than in chRCC. Most of all, the features of hypo-density and perirenal fascia thickening may be helpful in differentiating RO from chRCC, which had been seldom reported in previous studies.
Footnotes
Declaration of conflicting interests
The author(s) declared no potential conflicts of interest with respect to the research, authorship, and/or publication of this article.
Funding
The author(s) received no financial support for the research, authorship, and/or publication of this article.
