
Abstract
Background
Apparent diffusion coefficient (ADC) measurements are not incorporated in BI-RADS classification.
Purpose
To assess the probability of malignancy of breast lesions at magnetic resonance mammography (MRM) at 3 T, by combining ADC measurements with the BI-RADS score, in order to improve the specificity of MRM.
Material and Methods
A total of 296 biopsy-proven breast lesions were included in this prospective study. MRM was performed at 3 T, using a standard protocol with dynamic sequence (DCE-MRI) and an extra echo-planar diffusion-weighted sequence. A freehand region of interest was drawn inside the lesion, and ADC values were calculated. Each lesion was categorized according to the BI-RADS classification. Logistic regression analysis was employed to predict the probability of malignancy of a lesion. The model combined the BI-RADS classification and the ADC value. Sensitivity, specificity, positive predictive value, negative predictive value, and diagnostic accuracy were calculated.
Results
In total, 153 malignant and 143 benign lesions were analyzed; 257 lesions were masses and 39 lesions were non-mass-like enhancements. The sensitivity and specificity of the combined method were 96% and 86%, respectively, in contrast to 95% and 81% with BI-RADS classification alone.
Conclusion
We propose a method of assessing the probability of malignancy in breast lesions by combining BI-RADS score and ADC values into a single formula, increasing sensitivity and specificity compared to BI-RADS classification alone.
Keywords
Introduction
Magnetic resonance mammography (MRM) is an established method for the evaluation of breast lesions. It is increasingly used to evaluate inconclusive breast lesions detected in mammography and ultrasonography, preoperative evaluation of certain histologic types of newly diagnosed breast cancer, and screening women at high risk of developing breast cancer. The main advantage of MRM is the very high sensitivity (89%–100%) (1–4) and negative predictive value (97%–100%) (5), which indicate that MRM excludes malignancy reliably in the majority of cases.
On the other hand, standard MRM's specificity is not so high, although satisfactory at 89%, with a variable positive predictive value (PPV) in the range of 26%–96% (6). These findings may increase unnecessary biopsies and restrict the reliable use of MRM as a problem-solving method (7).
Several studies have concluded that diffusion-weighted imaging (DWI) can significantly improve the differentiation between malignant and benign breast lesions (8–10). The use of additional sequences to the standard MRM protocol results in multiparametric magnetic resonance imaging (mp-MRI), which provides information on breast lesions' morphological, perfusion, and diffusion characteristics. Perfusion characteristics are provided by dynamic contrast-enhanced MRI (DCE-MRI) and diffusion characteristics by DWI sequences. The diffusion characteristics are quantified in the apparent diffusion coefficient (ADC) maps derived from DWI sequences, then the Stejskal Tanner equation is applied to each DWI voxel (11).
The Breast Imaging Reporting and Data System (BI-RADS) is a standardized system of reporting breast lesions found on mammography, ultrasonography, and MRI. The current BI-RADS edition is the fifth, and it was released in 2013 (12). DWI findings are currently not included in the BI-RADS categorization.
Previous studies have attempted to combine the different MRM sequences under a unified classification with varying results (13,14). Currently, there is no commonly accepted, standardized technique that combines perfusion and diffusion characteristics.
The aim of the present study was to propose a method that combines ADC measurements with the BI-RADS classification and test whether this combination is a better predictor of malignancy than BI-RADS alone and, consequently, to increase the overall specificity of MRM (15).
Material and Methods
Patients
In the present study, approved by the local ethics committee, 310 consecutive patients who underwent MRM between 2015 and 2017 were evaluated. Fourteen examinations were excluded from the study because of motion artefacts. Thus, a total of 296 examinations were included in the study. The data selection process is shown in Fig. 1. The indications for MRI examinations were the preoperative evaluation of the extent of a newly diagnosed breast cancer, unclear findings in mammography or ultrasonography, and screening of a high-risk population. MRI examinations for all premenopausal women were performed during the second week of the menstrual cycle and for postmenopausal women under hormone replacement therapy, six weeks after the discontinuation of treatment.
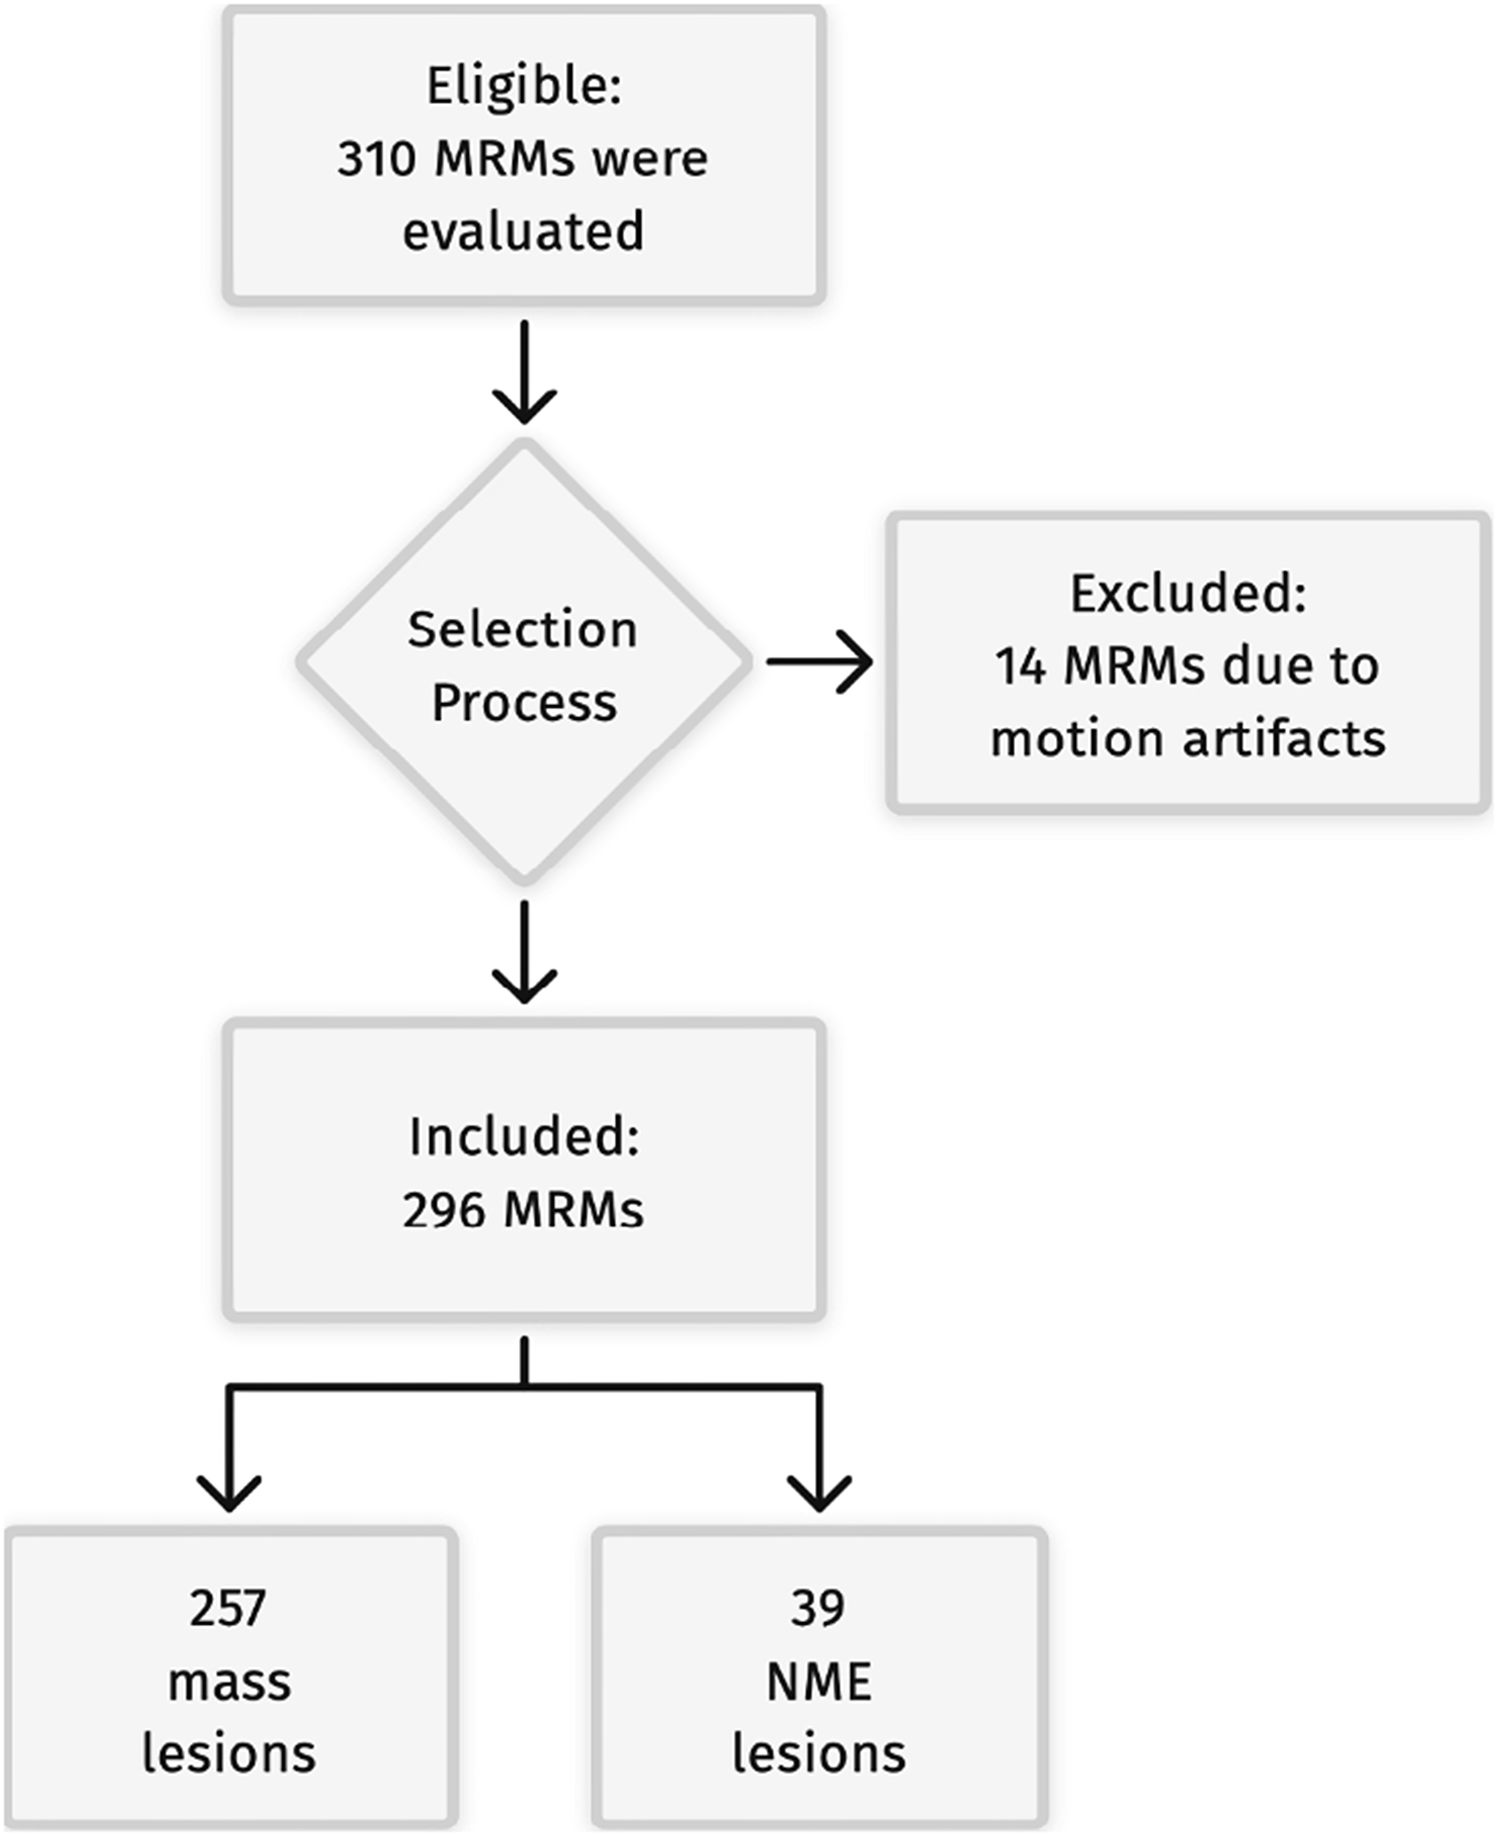
Flowchart of the included and excluded cases.
MR protocol
The MRI examinations were carried out on a 3-T system (Signa HDx; GE Healthcare, Milwaukee, WI, USA), with a dedicated bilateral phased-array breast coil (four-element two-channel coil, one channel per breast) and the woman in the prone position. All patients were carefully instructed to breathe normally and not to move during the entire examination.
All malignant lesions were confirmed histologically, and benign lesions were confirmed either histologically or by at least three years of follow-up.
Breast MRI protocol included axial T2-weighted fast spin echo sequence (TR/TE = 3600/100 ms, matrix = 416 × 256, slice thickness = 4 mm, spacing = 0 mm), axial short TI inversion recovery sequence (TR/TE = 3860/90 ms, matrix = 512 × 256, slice thickness = 4 mm, spacing = 0 mm), and a three-dimensional T1-weighted fat-suppressed VIBRANT, dynamic sequence (flip angle = 10°, TR/TE = 4900/2 ms, slice thickness = 1.2 mm, matrix = 350 × 350) in the axial plane, both before and five times at regular time intervals after the intravenous injection of 0.1 mmol/kg bodyweight of gadopenate dimeglumine (Magnevist®; Bayer Schering Pharma, Berlin, Germany) or gadodiamide (Omniscan®; GE Healthcare, Milwaukee, WI, USA) with a power injector, followed by a 20-mL saline solution flush, for 5–8 s. Each sequence lasted 1.3 min. During the dynamic series, the system's imaging parameters remained unchanged. Axial DWΙ sequence was acquired before intravenous contrast administration using a two-dimensional spin-echo echo-planar imaging (EPI) sequence (TR/TE = 6.000/90 ms, slice thickness = 4 mm, matrix = 96 × 128, spacing = 4 mm). Diffusion-sensitizing gradients were applied in three orthogonal directions with b values of 0 and 850 s/mm2. The DWI images were postprocessed on a dedicated DICOM workstation (Advantage Windows, version 4.2; GE Healthcare). The ADC maps were calculated automatically. The DWI protocol was in accordance with the recommendations of the EUSOBI International Breast Diffusion-Weighted Imaging working group (16).
Image and data analysis
Two radiologists reviewed the MRM studies in consensus, one radiologist with >15 years of experience in breast MRI and the other with eight years of experience in general radiology, including the reading of MRMs. The image and data analysis were performed using a dedicated workstation.
On the dynamic contrast-enhanced MRM series, regions of interest (ROI) were drawn and placed selectively on lesion areas with the most rapid, homogenous, and intense enhancement. Furthermore, the size of the ROI was adjusted to include as much of the enhancing part of the tumor as possible, yet excluding potential artefacts. Morphologic and dynamic lesion assessment was performed according to the MRI lexicon of BI-RADS 5th edition (12).
To identify the lesions at DWI, the dynamic postcontrast T1 sequences were taken into account. The ADC value was obtained by drawing a ROI manually on ADC maps within the lesion borders, excluding cystic or necrotic components to avoid artefacts. When more than one ROI was drawn on the same lesion, the one with the lowest ADC value was accepted.
Statistical analysis
Logistic regression was performed to ascertain the effects of BI-RADS classification and ADC values on the likelihood of malignancy. The predictor variables were the BI-RADS categories and the ADC value for each lesion. For model training, 70% of the cases were randomly assigned to the training sample, while 30% were assigned to the test sample. A 10-fold cross-validation was used to optimize the model. The Hosmer–Lemeshow test was used to determine the goodness of fit of the logistic regression model. The Likelihood Ratio test was used to assess whether the model including BI-RADS and ADC provides a significantly better fit than a logistic regression model with BI-RADS or ADC alone. The Wald test was used to explore if the two explanatory variables in the model are significant. Probabilities of malignancy were calculated for each BI-RADS category for all lesions. To compare the diagnostic accuracy of the combined method against BI-RADS only classification, BI-RADS 4 and 5 lesions were assumed to be malignant, whereas BI-RADS 3 lesions were assumed to be benign. BI-RADS 2 lesions were considered benign, as per BI-RADS definition. Furthermore, ADC thresholds for each BI-RADS category were calculated for 100% specificity. Subsequently, receiver operating characteristic (ROC) curve analysis was performed to define the optimal ADC threshold for DWI. Sensitivity, specificity, PPV, negative predictive value (NPV), and accuracy were calculated. Test–retest reliability was conducted to determine the level of agreement in BI-RADS and ADC measurements using the Pearson correlation coefficient. BI-RADS and ADC were evaluated in all cases and then re-evaluated after eight weeks to eliminate memory effects. For all tests a P value <0.05 was considered significant. The statistical analysis was conducted in R (R Core Team 2021, Vienna, Austria) (17).
Results
In the present study, 296 lesions (257 mass lesions and 39 non-mass-enhancing [NME] lesions) were included. Lesions by histopathological type are presented in Table 1.
Lesions by histopathological type.

Values are given as n (%).
DCIS, ductal carcinoma in situ; IDC, invasive ductal carcinoma; ILC, invasive lobular carcinoma; LCIS, lobular carcinoma in situ.
The mean size of all benign lesions was 2.21 cm (range = 1.39–9.41 cm) with mean size of mass lesions at 2.11 cm (range = 1.39–7.83 cm) and mean size of NME lesions at 2.98 cm (range = 1.83–9.4 cm). The mean size of all malignant lesions was 5.02 cm (range = 1.31–10.38 cm) with mean size of mass lesions at 4.81 cm (range = 1.31–10.23 cm) and mean size of NME lesions at 5.32 cm (range = 3.58–10.38 cm).
DCE-MRI
A total of 95 lesions were categorized as BI-RADS 2, 28 as BI-RADS 3, 76 as BI-RADS 4, and 97 as BI-RADS 5 (Table 2). The PPV for each BI-RADS category was estimated as follows: 89% for BI-RADS 3; 78% for BI-RADS 4; and 97% for BI-RADS 5 (Table 3). With the assumption that BI-RADS 2 and 3 lesions are considered benign, and BI-RADS 4 and 5 lesions are considered malignant, BI-RADS sensitivity, specificity, PPV, NPV, diagnostic accuracy, and area under the ROC curve (AUC) were 95%, 81%, 81%, 96%, 88%, and 0.89%, respectively. Further statistics on mass and NME lesions are presented in Table 4.
Lesions by BI-RADS classification.

Values are given as n (%).
NMLE, non-mass-like enhancement.
Total number of lesions, lesions correctly characterized, lesions falsely characterized, and PPV of different BI-RADS* classifications versus the combined method.
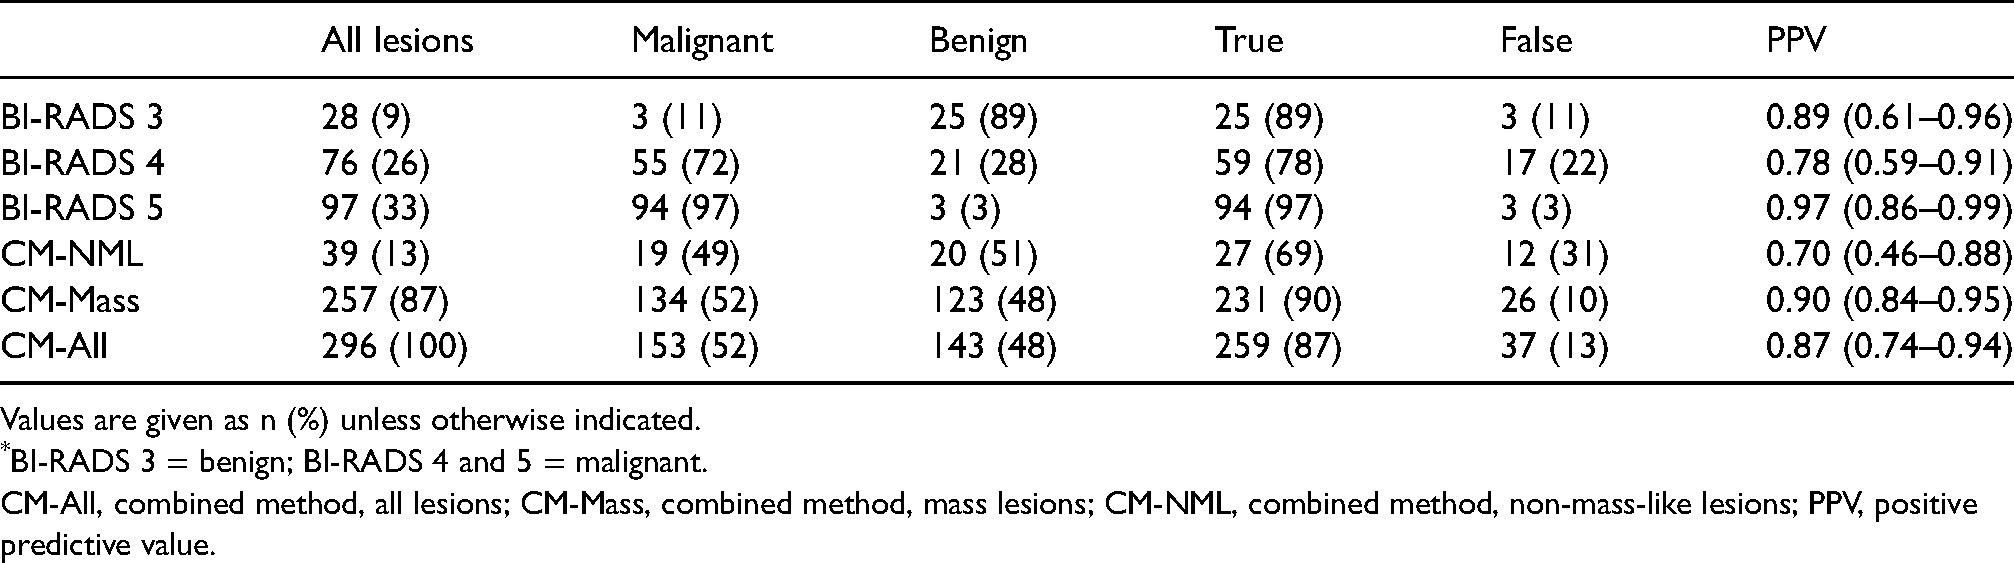
Values are given as n (%) unless otherwise indicated.
BI-RADS 3 = benign; BI-RADS 4 and 5 = malignant.
CM-All, combined method, all lesions; CM-Mass, combined method, mass lesions; CM-NML, combined method, non-mass-like lesions; PPV, positive predictive value.
Results for BI-RADS classification only,* DWI only,† and the combined method‡ for all lesions, masses, and NMLEs.
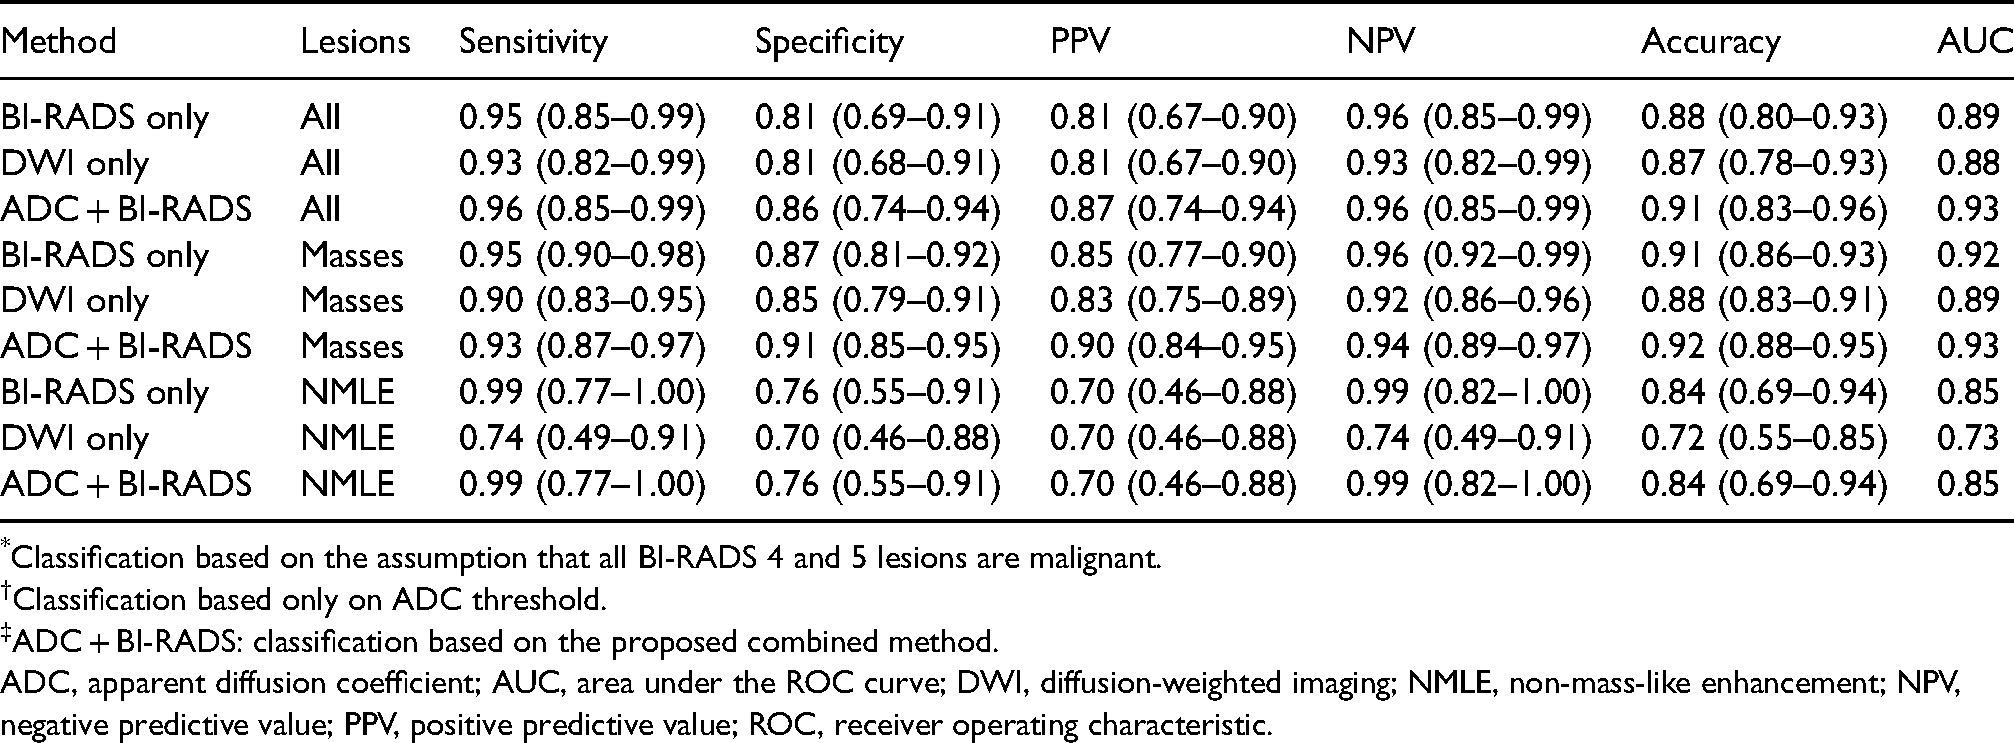
Classification based on the assumption that all BI-RADS 4 and 5 lesions are malignant.
Classification based only on ADC threshold.
ADC + BI-RADS: classification based on the proposed combined method.
ADC, apparent diffusion coefficient; AUC, area under the ROC curve; DWI, diffusion-weighted imaging; NMLE, non-mass-like enhancement; NPV, negative predictive value; PPV, positive predictive value; ROC, receiver operating characteristic.
DWI
ROC curve analysis was performed, and Youden's index was used to define the optimal ADC threshold for highest specificity without decreasing sensitivity. For all lesions and masses only, the threshold was set at 1.26 × 10⁻³ mm2/s. For NME lesions, it was set at 1.2 × 10⁻³ mm2/s (Fig. 2). The mean ADC value for the benign lesions was 1.47 × 10⁻³ mm2/s, and for the malignant lesions was 1.04 × 10⁻³ mm2/s.
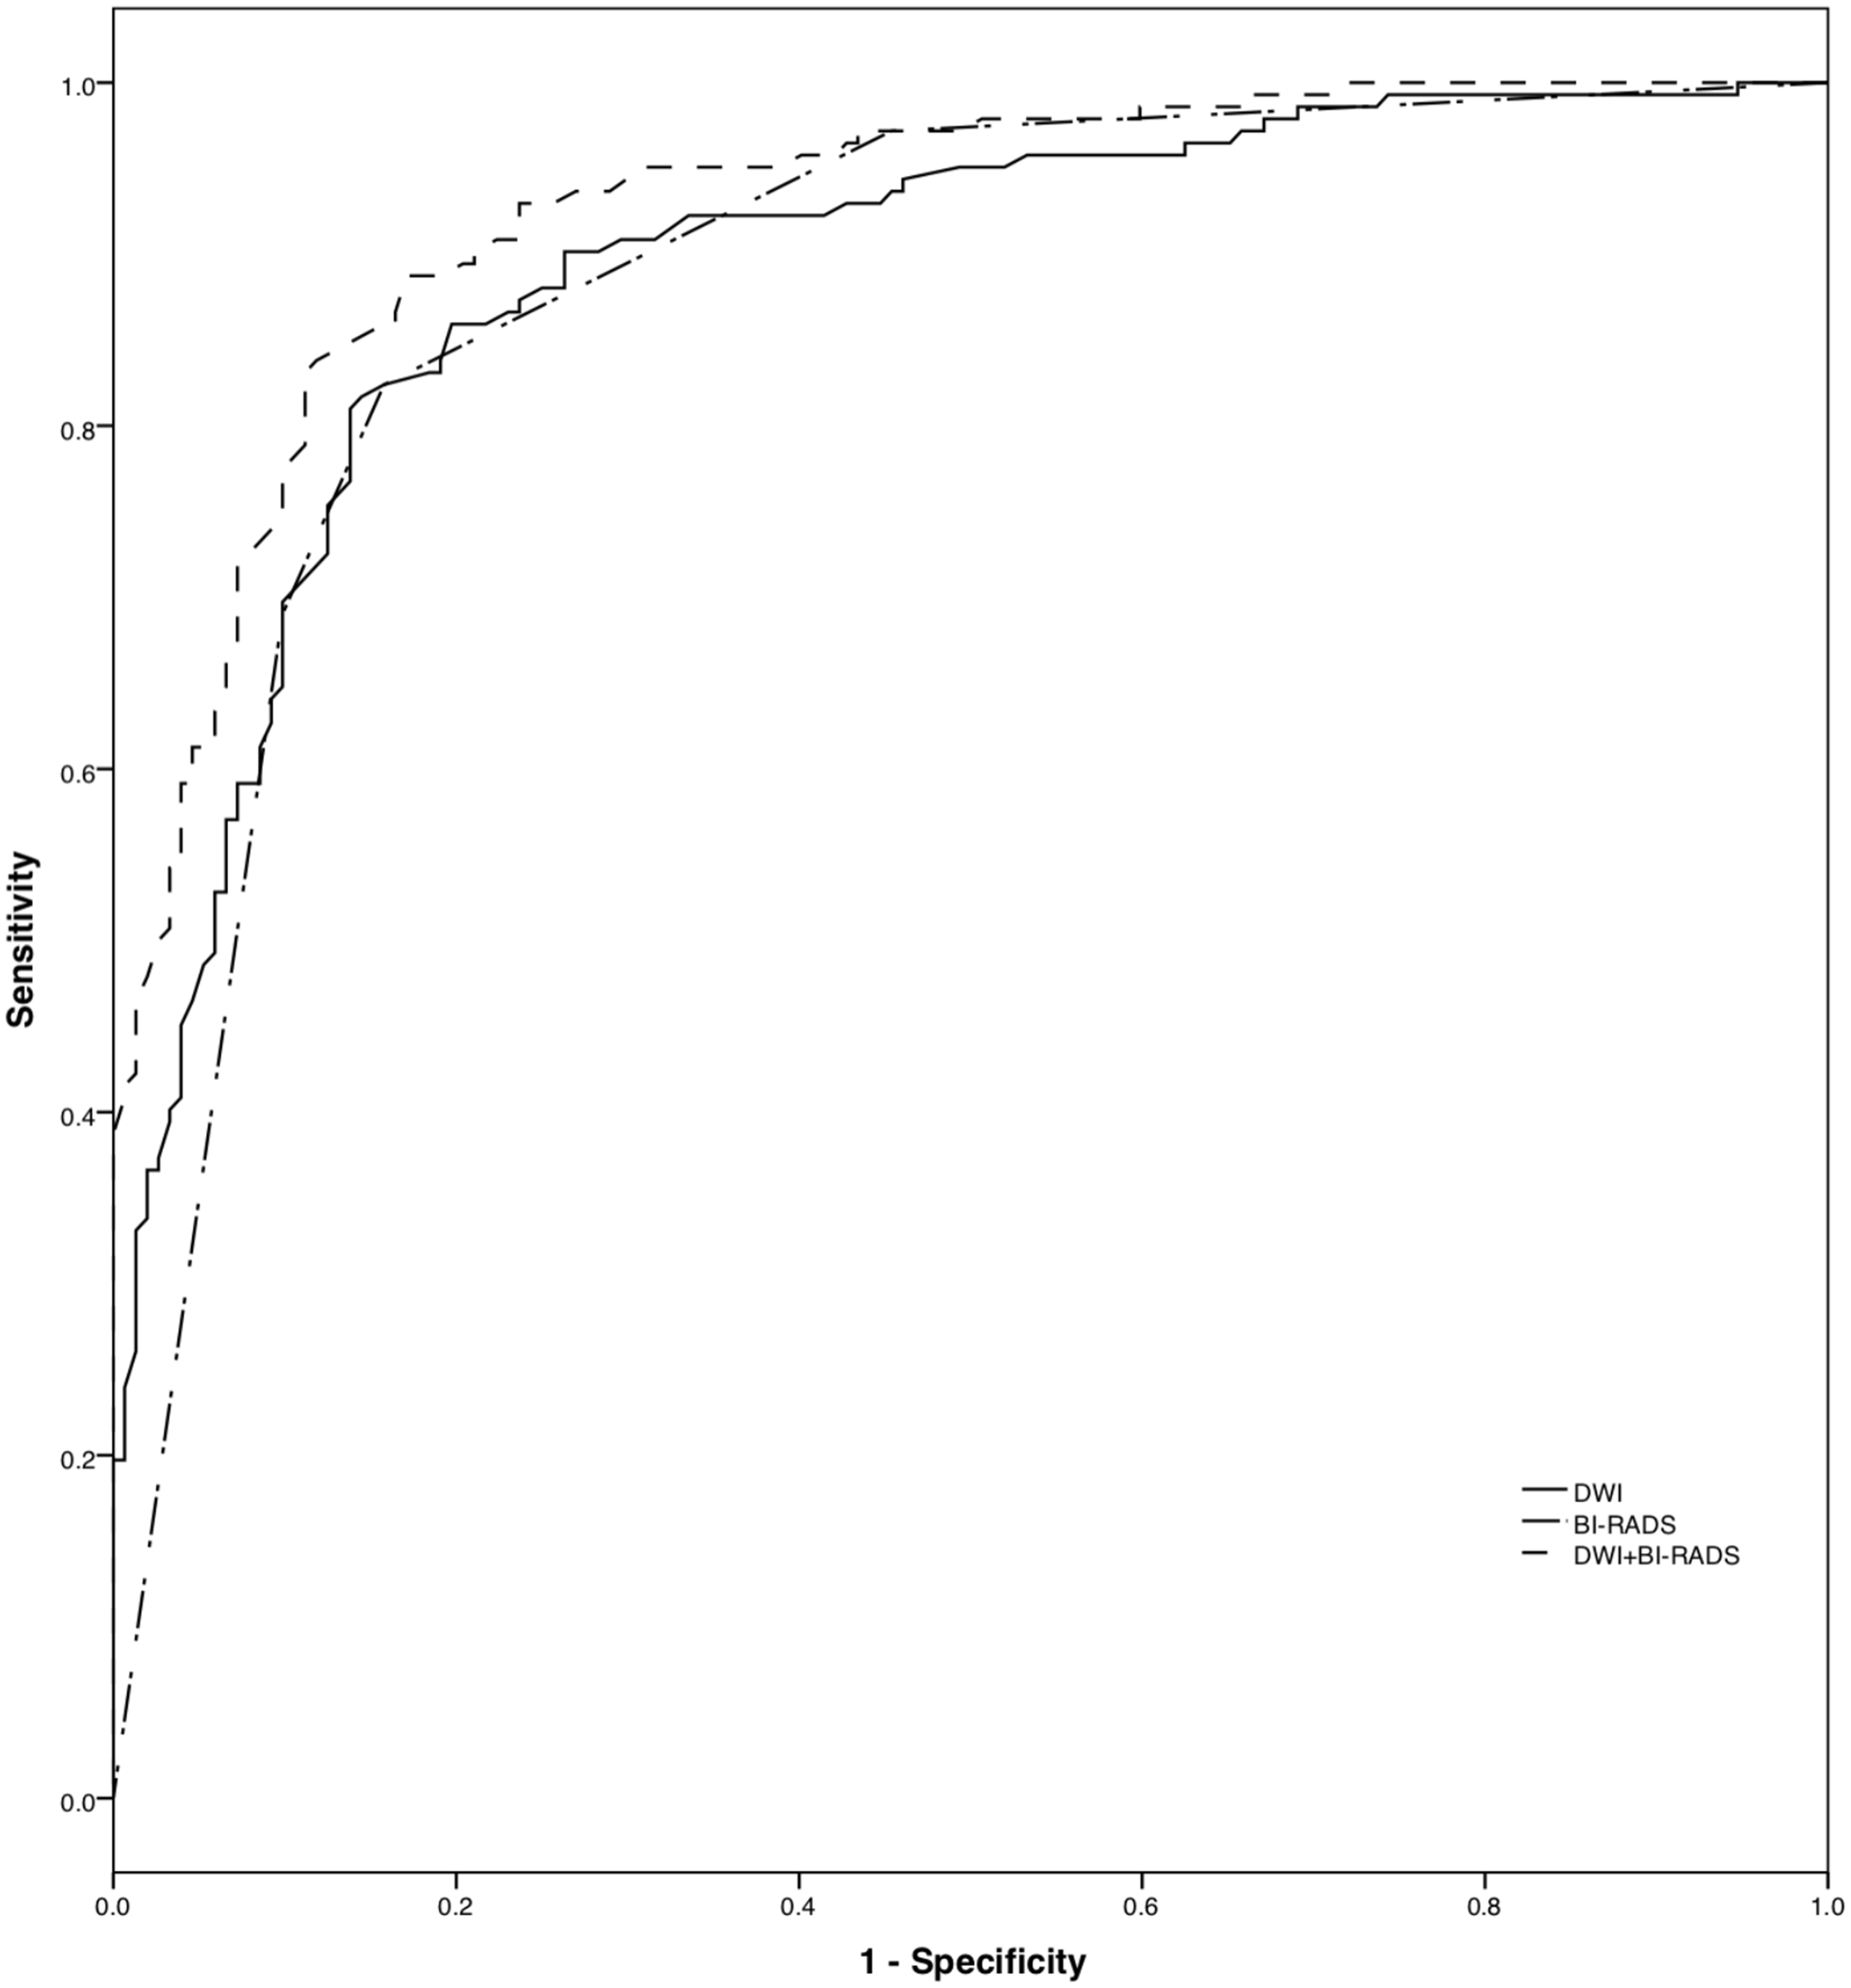
ROC curve demonstrates a larger area under the curve for the combined method (DWI + BI-RADS) than for DWI or BI-RADS alone. DWI, diffusion-weighted imaging; ROC, receiver operating characteristic.
The sensitivity, specificity, PPV, NPV, and diagnostic accuracy of DWI for all findings were 93%, 81%, 80%, 93%, and 87%, respectively, with an AUC of 0.88, and the best results were shown for mass lesions. Further statistics on mass and NME lesions are presented in Table 4.
Moreover, the ADC thresholds where we can safely rule out malignancy (with specificity 100%) were calculated for each BI-RADS category: BI-RADS 2 = 1.55; BI-RADS 3 = 1.56; BI-RADS 4 = 1.58; and BI-RADS 5 = 1.5. The methodology followed (selecting 100% specificity) is in accordance with the studies mentioned in the study by Clauser et al. (18).
The proposed combined method
A multiparametric logistic regression analysis was performed, including the four BI-RADS categories (2–5) and ADC values. The Hosmer–Lemeshow test did not indicate a poor fit (P = 0.87) and the model had a McFadden's-R2 of 0.67. Both ADC and BI-RADS were significant predictors of malignancy. The logistic regression model is presented in Table 5. The combined model fits the data better than a model with BI-RADS or ADC alone (Likelihood ratio test P = 0.016 and P < 0.001, respectively). The sensitivity, specificity, PPV, NPV, and diagnostic accuracy of the logistic regression model were 96%, 86%, 87%, 96%, and 91%, respectively, with an AUC of 0.93.
The logistic regression model for the combined method for all lesions.
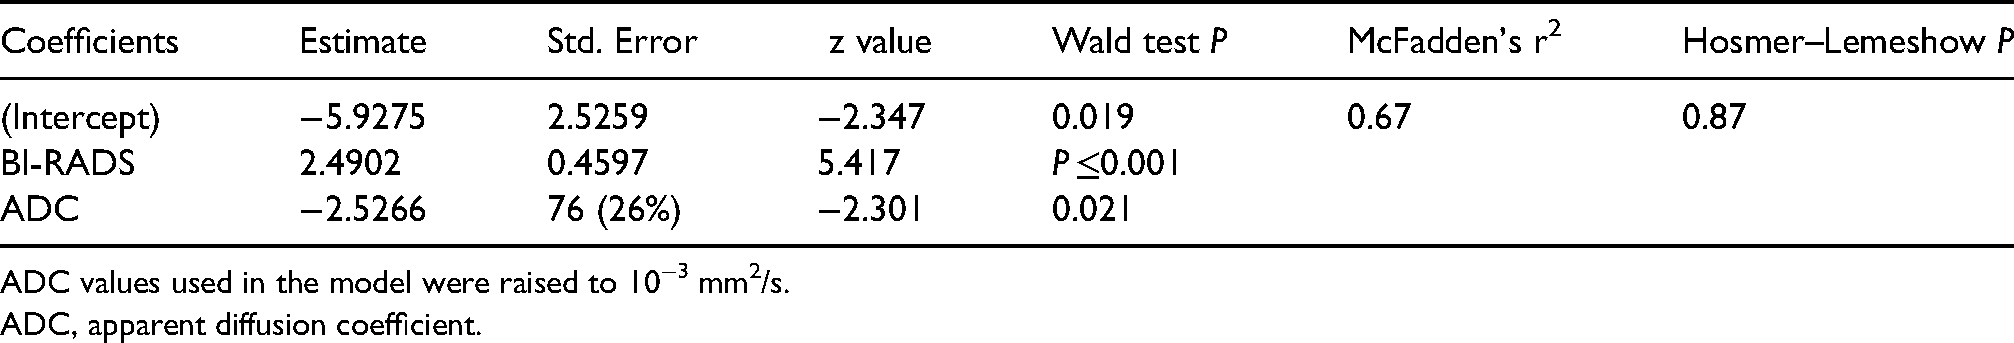
ADC values used in the model were raised to 10−3 mm2/s.
ADC, apparent diffusion coefficient.
Test–retest reliability analysis for the BI-RADS showed excellent results with a Pearson's correlation coefficient of 0.96 (95% confidence interval [CI] = 0.95–0.96). On the other hand, ADC repeatability was lower than BI-RADS but still high, with a Pearson's correlation coefficient of 0.86 (95% CI = 0.83–0.89).
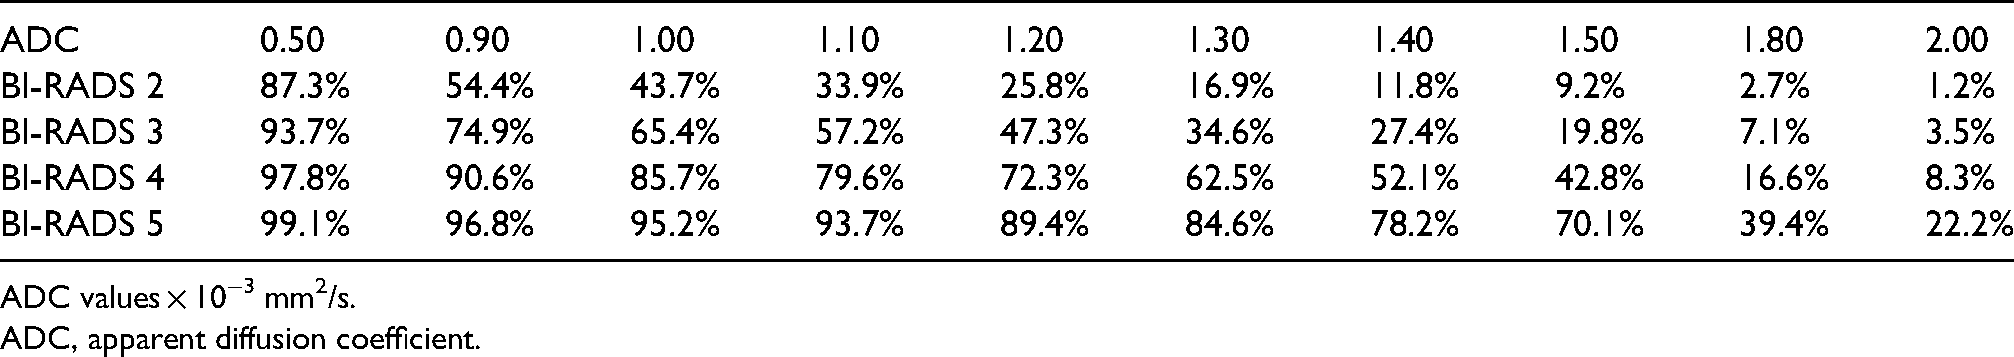
Probabilities for malignancy based on the proposed combined model are demonstrated graphically in Fig. 3 and numerically in Table 6. For example, a BI-RADS 5 lesion with a high ADC value of 1.8 × 10⁻³ mm2/s has a 39% possibility of being malignant, a BI-RADS 4 lesion 17% probability of being malignant, and a BI-RADS 3 lesion has only a 4% probability of being malignant.

Probabilities for malignancy according to ADC value and BI-RADS classification based on the combined method. ADC, apparent diffusion coefficient.
Probabilities for malignancy of the combined method for a given ADC value and BI-RADS classification.
ADC values × 10−3 mm2/s.
ADC, apparent diffusion coefficient.
Discussion
Several studies have evaluated the role of BI-RADS classification in the diagnostic strategy of breast lesions, either for mammography and ultrasound or for MRI (15,19–23). They found that PPV for BI-RADS 5 lesions is about 70%, significantly higher than for BI-RADS 4 lesions, which is 20%, but still not high enough (15,19). Furthermore, concerning MRM, the predictive value of lesions' morphologic characteristics is higher than the kinetic curves (20). In the present study, BI-RADS sensitivity and specificity were 95% and 81%, respectively.
Several studies demonstrated the usefulness of ADC in distinguishing between benign and malignant breast lesions, and DWI is considered an important tool to increase the specificity of DCE-MRI (16). Some studies have used the relative ADC instead of absolute ADC values, further increasing the diagnostic accuracy (24). The sensitivity and specificity of DWI in the diagnosis of breast lesions is in the range of 84%–86% and 76%–79%, respectively, with higher specificity in mass lesions (84%) as opposed to NME lesions (70%) (25,26). However, even after using relative ADC, there is still a significant overlap of the ADC values between benign and malignant lesions. In the present study, with an ADC threshold for all lesions of 1.23 × 10⁻³ mm2/s, the sensitivity and specificity of DWI in the characterization of breast lesions is 93% and 81%, respectively.
In the present study, the specificity of DWI was the same as that of DCE-MRI, although the sensitivity of DCE-MRI is higher than DWI. These results are in accordance with the literature (16). Consequently, DWI can be used as part of an unenhanced MRI protocol in cases of contraindications to the use of gadolinium-based contrast agents (16).
The sensitivity and specificity of the proposed combined method are 96% and 86%, respectively. The results mentioned above refer mainly to the mass lesions as the sample of NME lesions in the present study was not large enough to provide a separate NME lesion model that would be statistically significant. Moreover, the detailed statistical analysis concerning masses and NME lesions are presented in Table 4. The specificity of the combined method is statistically significantly (P < 0.01) higher than BI-RADS or ADC alone (81% for BI-RADS and ADC vs. 86% for the combined method).
The combined method showed improvement in the diagnostic accuracy of MRM for all lesions with 91% instead of 88% for BI-RADS and 87% for ADC.
PPV of the combined method was higher than BI-RADS and ADC, either for all lesions or for mass lesions alone (Table 4) (87% vs. 81% for the BI-RADS and 81% for ADC). According to our results, the NPV of the combined method is similar to that of BI-RADS and higher than ADC (96% vs. 96% for the BI-RADS and 93% for ADC).
With the combined method, 4% of the lesions were falsely characterized as negative (false negative). There was one case of ductal carcinoma in situ (DCIS) of moderate grade, one case of DCIS of low grade, and one case of invasive ductal carcinoma NOS grade 1. The histology of these lesions could justify these false-negative results, as they correspond to low-grade malignancies. Furthermore, low-grade DCIS may be the cause of false-negative results in MRI (27). Therefore, the combined method can safely exclude the vast majority of malignant lesions, especially the more aggressive ones.
On the other hand, the false-positive lesions in our study were 16%. These lesions correspond to seven cases of fibroadenomas, six cases of fibrocystic lesions, five cases of sclerosing adenosis, and four cases of papillomas. All seven fibroadenomas and 4 papillomas had suspicious kinetic characteristics (>100%, curve type III), the sclerosing adenosis cases presented with equivocal characteristics (irregular borders enhancement >100% and curve type II), and all fibrocystic lesions were presented as NME lesions with borderline kinetic characteristics (>100%, curve type II). Consequently, the false-positive results could be due to the lesions' suspicious kinetic characteristics and morphology, as well as the overall presentation of NME lesions. Representative examples of the above-mentioned cases are displayed in Figs. 4–7 (two benign and two malignant lesions).
Benign lesion with false positive BI-RADS and true negative ADC. (a) On mammography, dense breast and a mass lesion were demonstrated. MRI showed an enhancing lobulated mass on the upper outer quadrant of the left breast with non-enhancing septa. (b) Kinetic analysis shows a type III curve with >100% maximum enhancement. Categorized as BI-RADS 4. (c) The ADC measured was 1.79 × 10⁻³ mm2/s. Histological examination showed fibroadenoma with marked epithelial hyperplasia. ADC, apparent diffusion coefficient; MRI, magnetic resonance imaging.
Benign lesion with true-negative BI-RADS and false-positive ADC. (a) MRI showed a non-mass enhancement on the upper part of the right breast. (b) Kinetic analysis shows a type I curve with >100% maximum enhancement. Categorized as BI-RADS 3. (c) The ADC measured was 1.19 × 10⁻³ mm2/s. Histological examination showed fibrocystic changes with benign intraepithelial hyperplasia. ADC, apparent diffusion coefficient; MRI, magnetic resonance imaging.
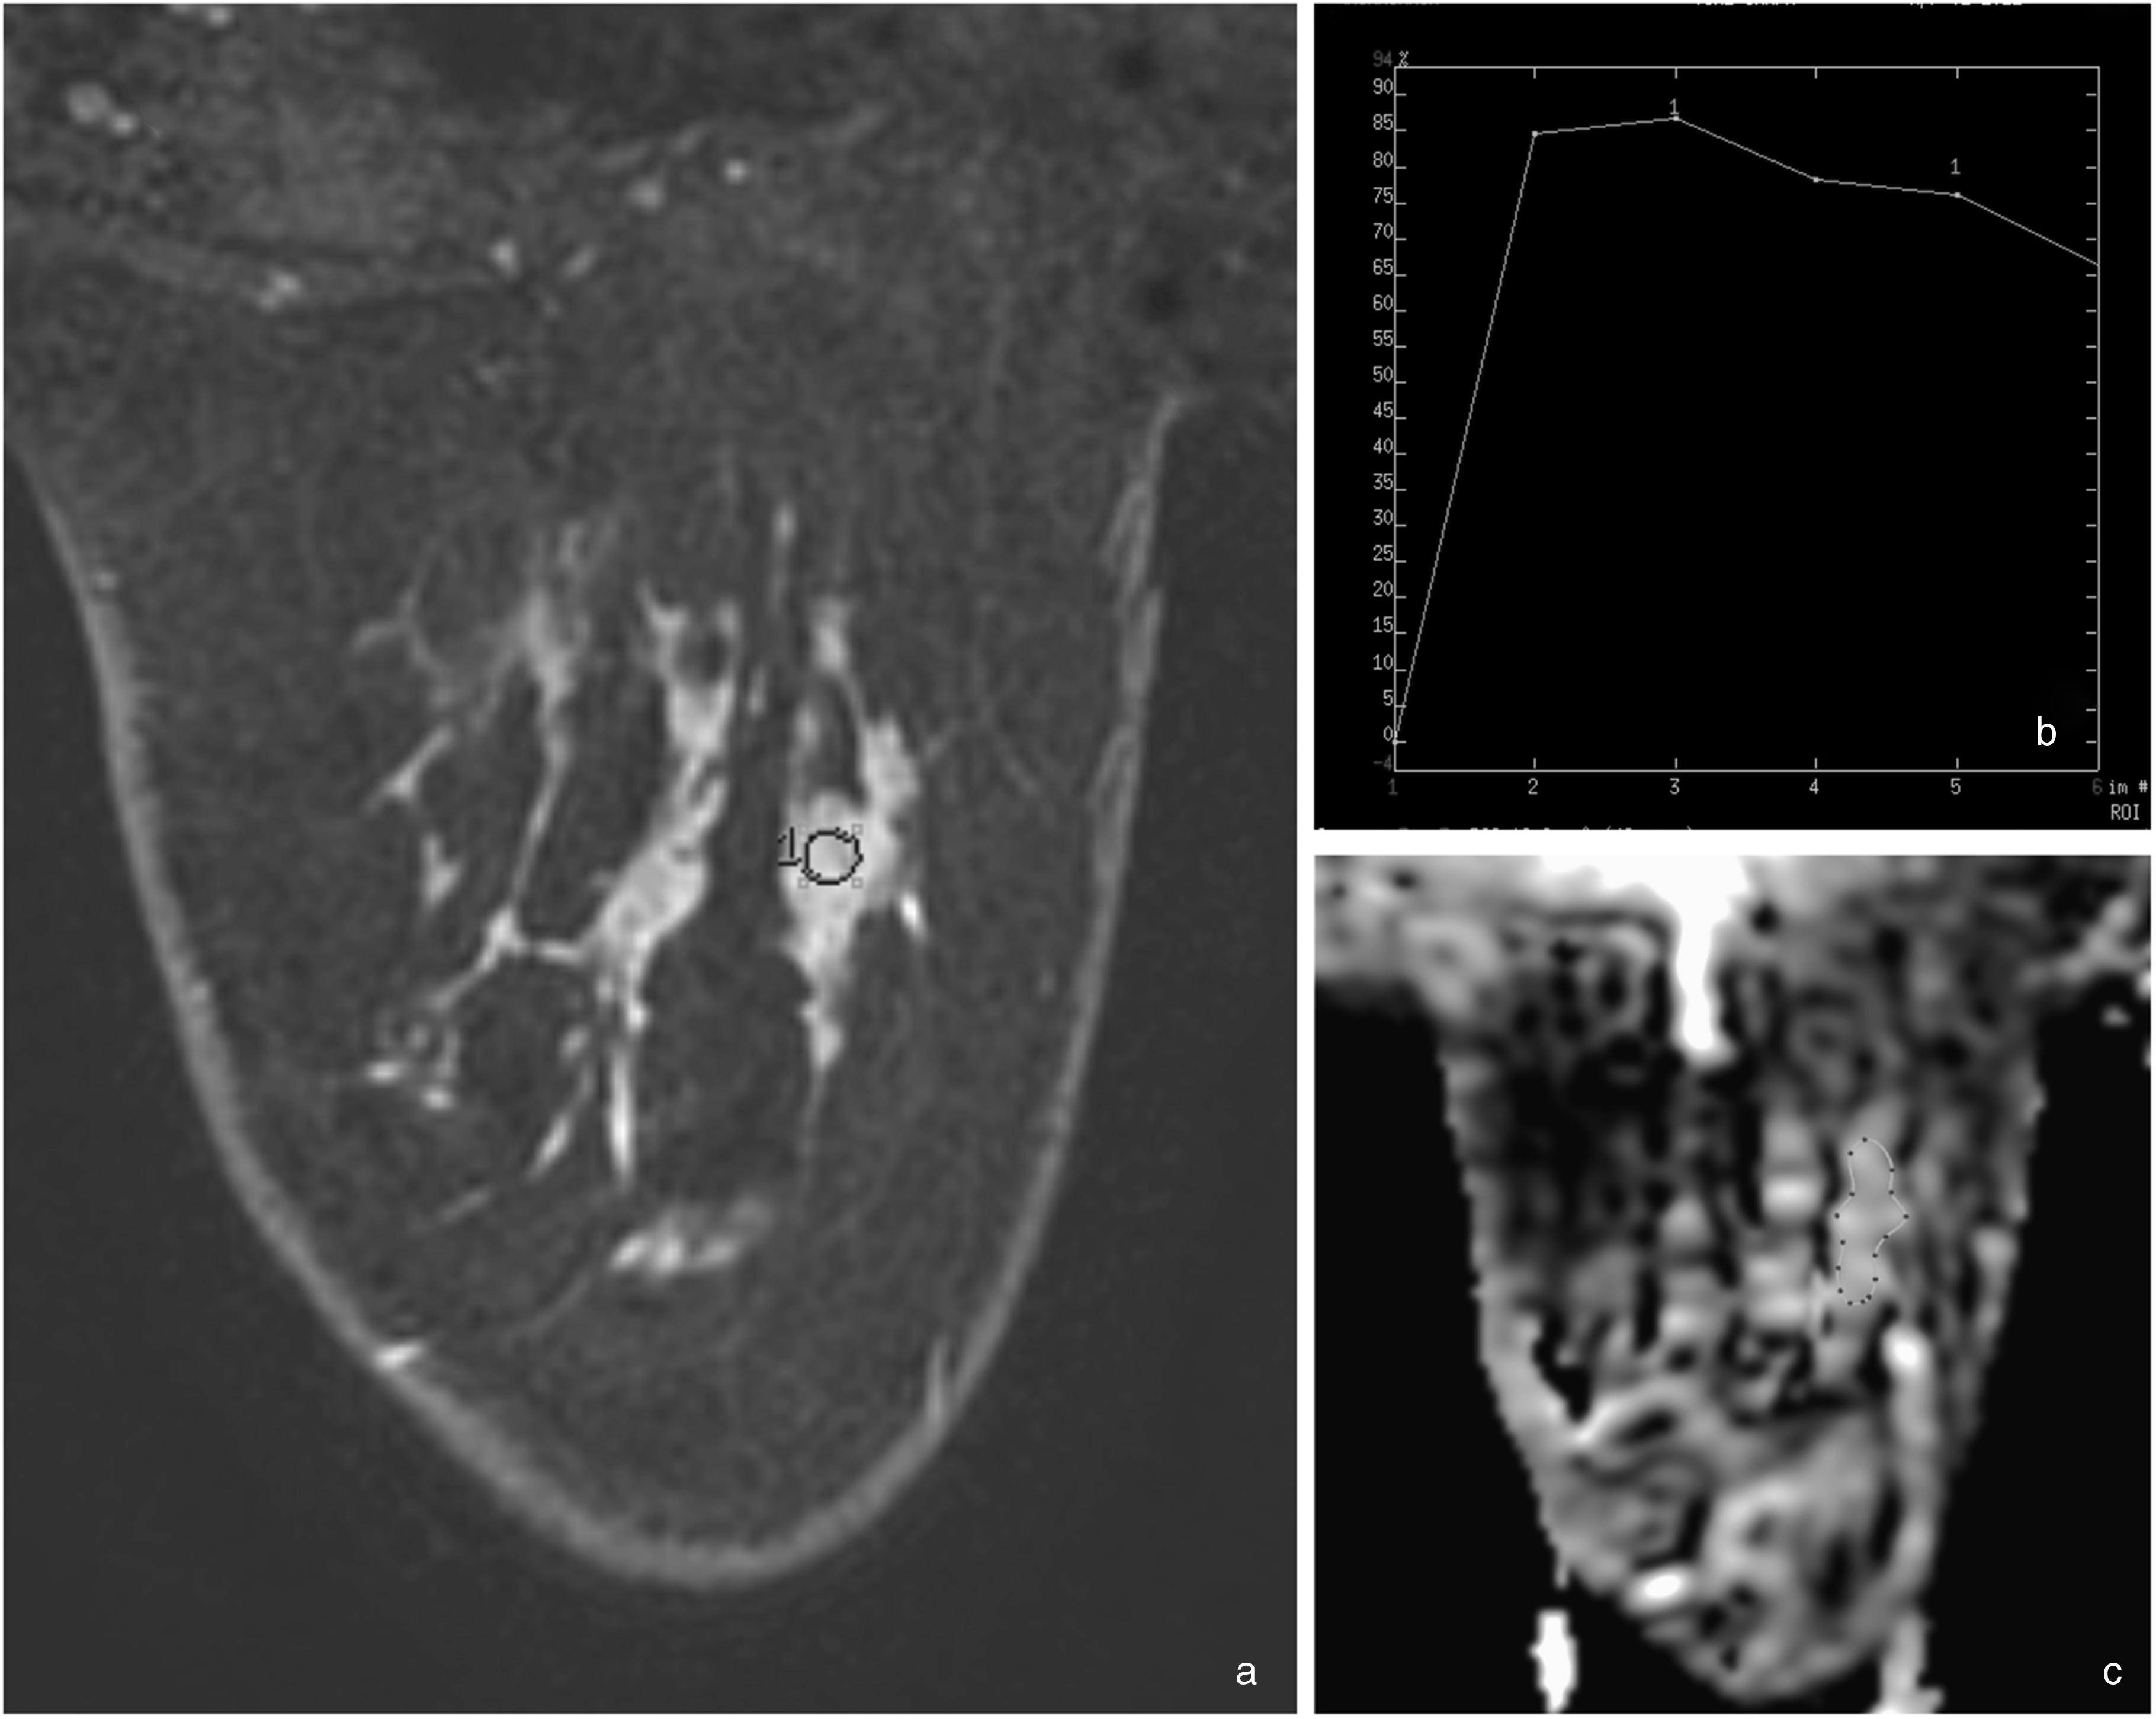
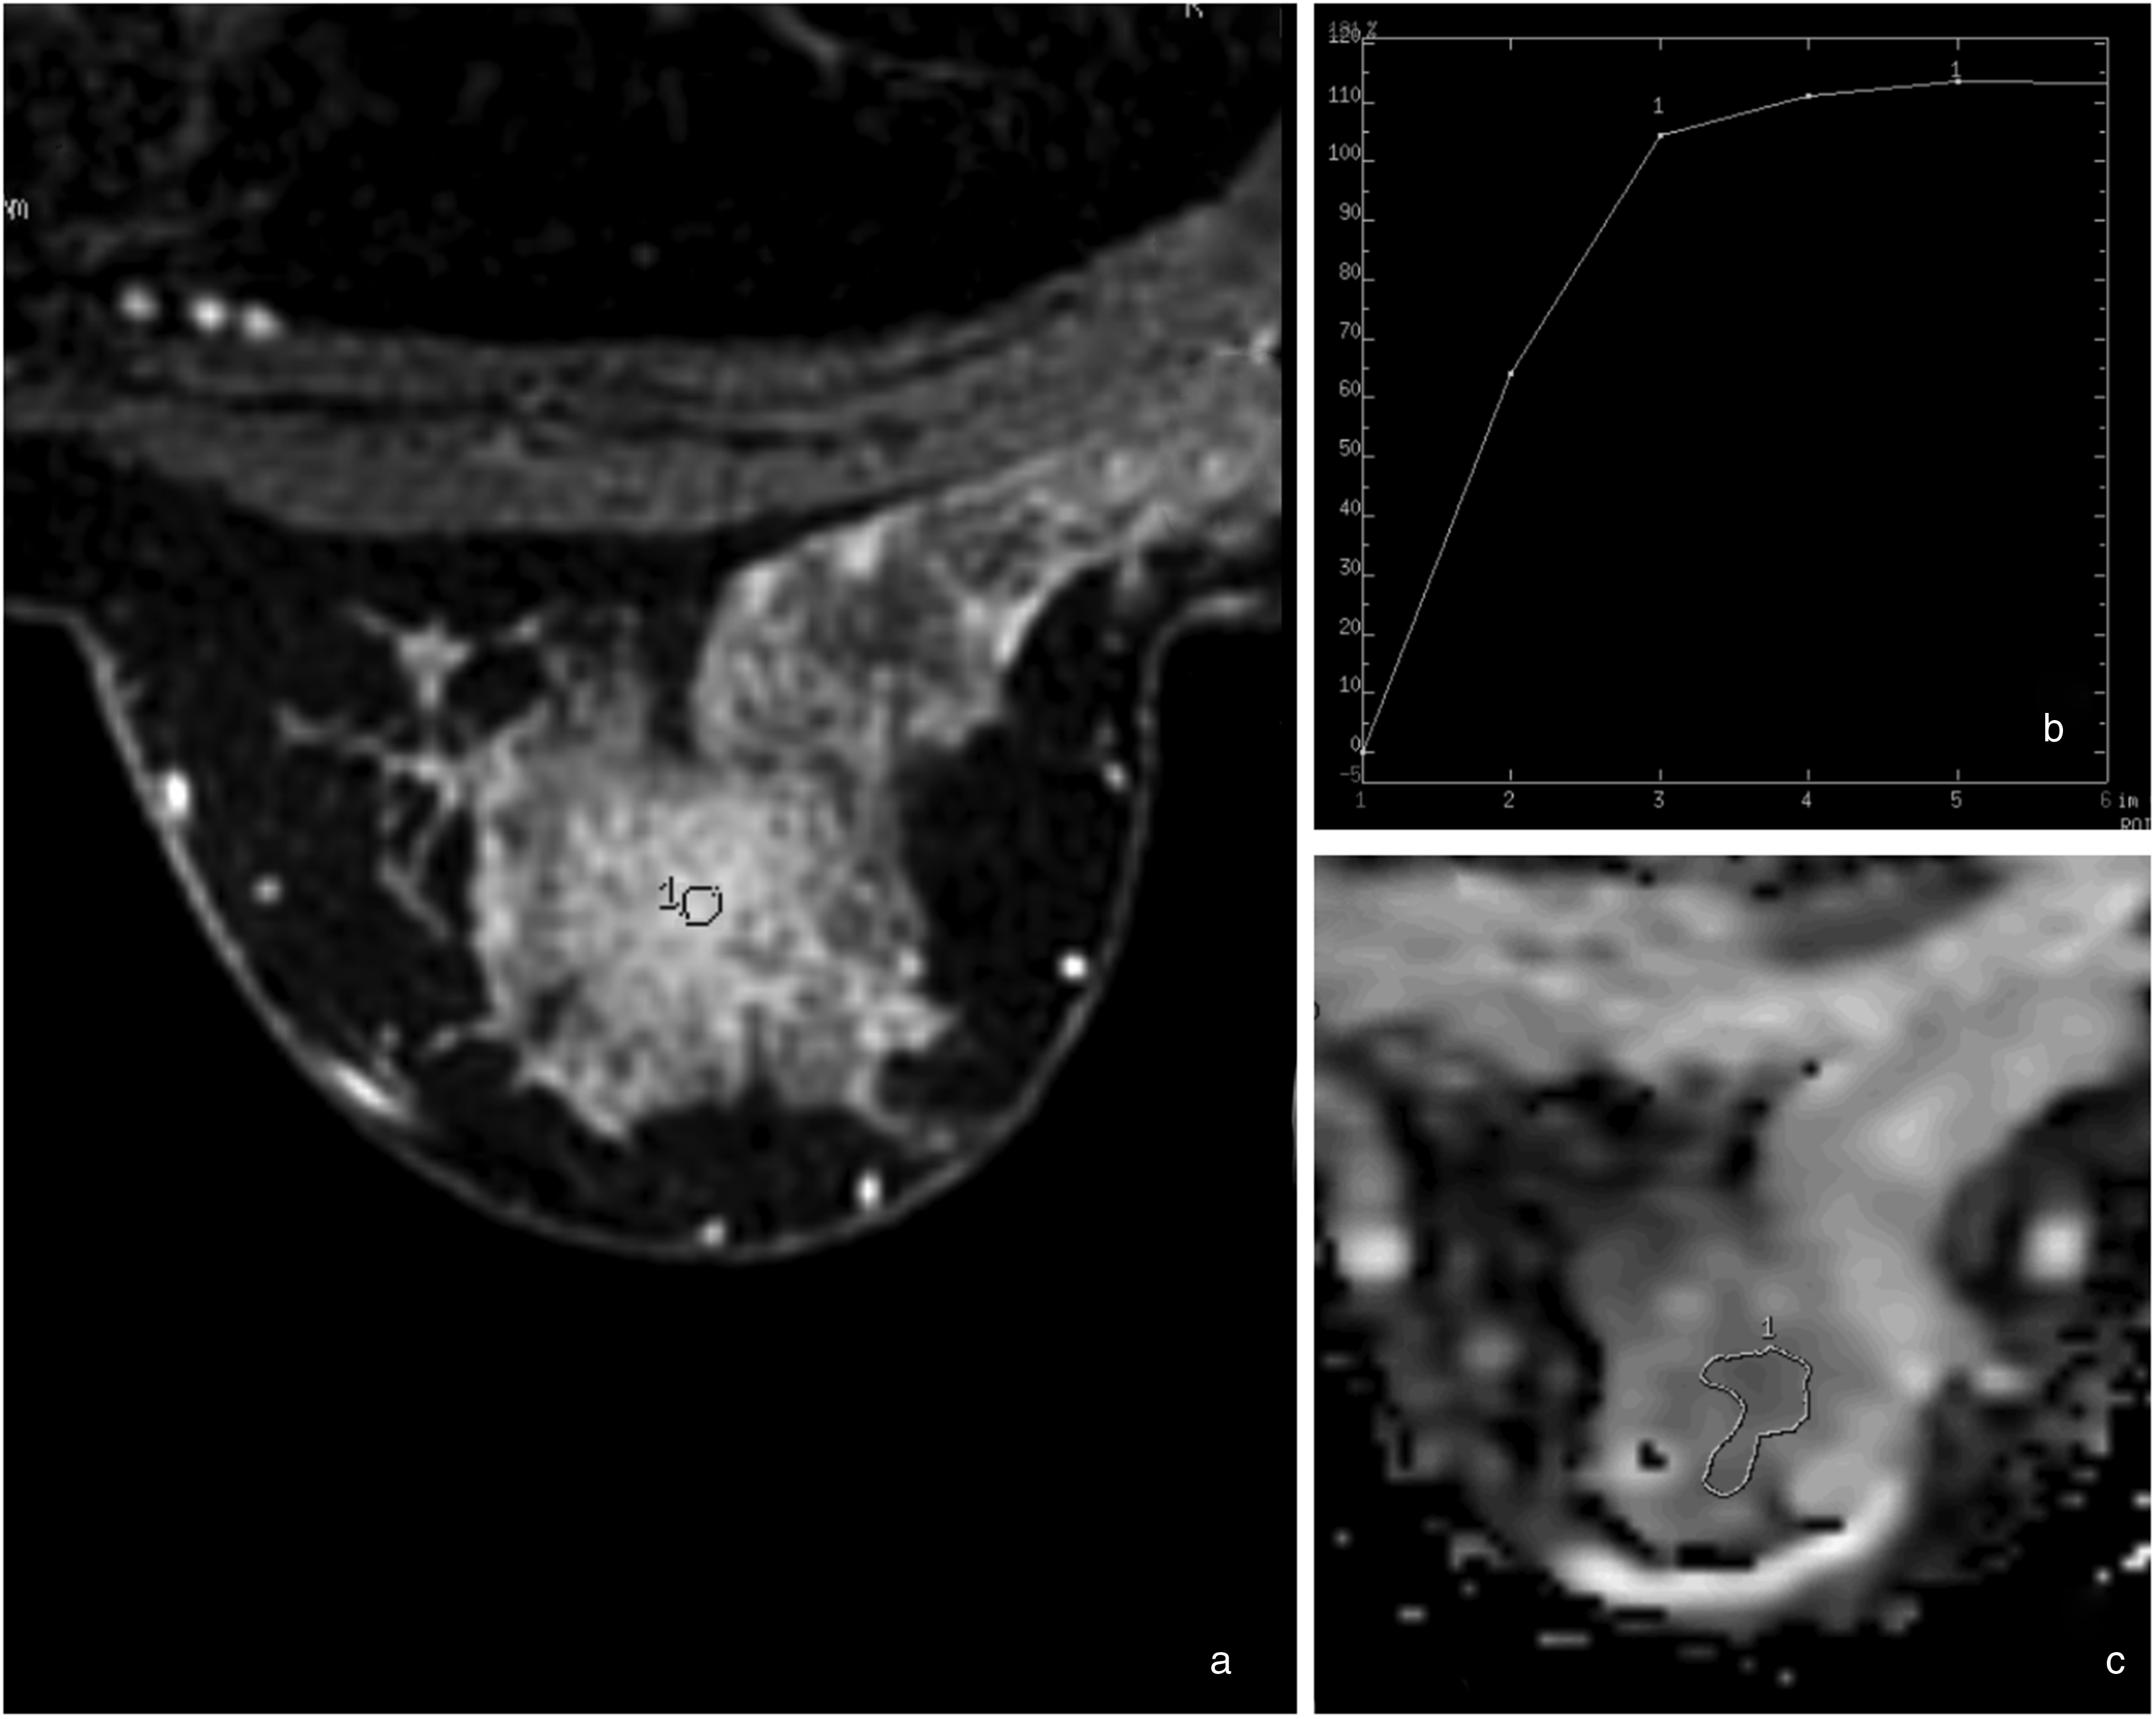
Malignancy with true-positive BI-RADS and false-negative ADC. (a) On mammography, there was a focal asymmetry of the glandular tissue of the lower inner quadrant of the right breast. MRI showed extensive non-mass enhancement, especially at the inner part of the right breast. (b) Kinetic analysis shows maximal enhancement of 50%–100% and type III curve. Categorized as BI-RADS 4. (c) The ADC measured was 1.27 × 10⁻³ mm2/s. Histological examination showed invasive breast carcinoma (infiltrating duct carcinoma NOS) with in situ component. ADC, apparent diffusion coefficient; MRI, magnetic resonance imaging.
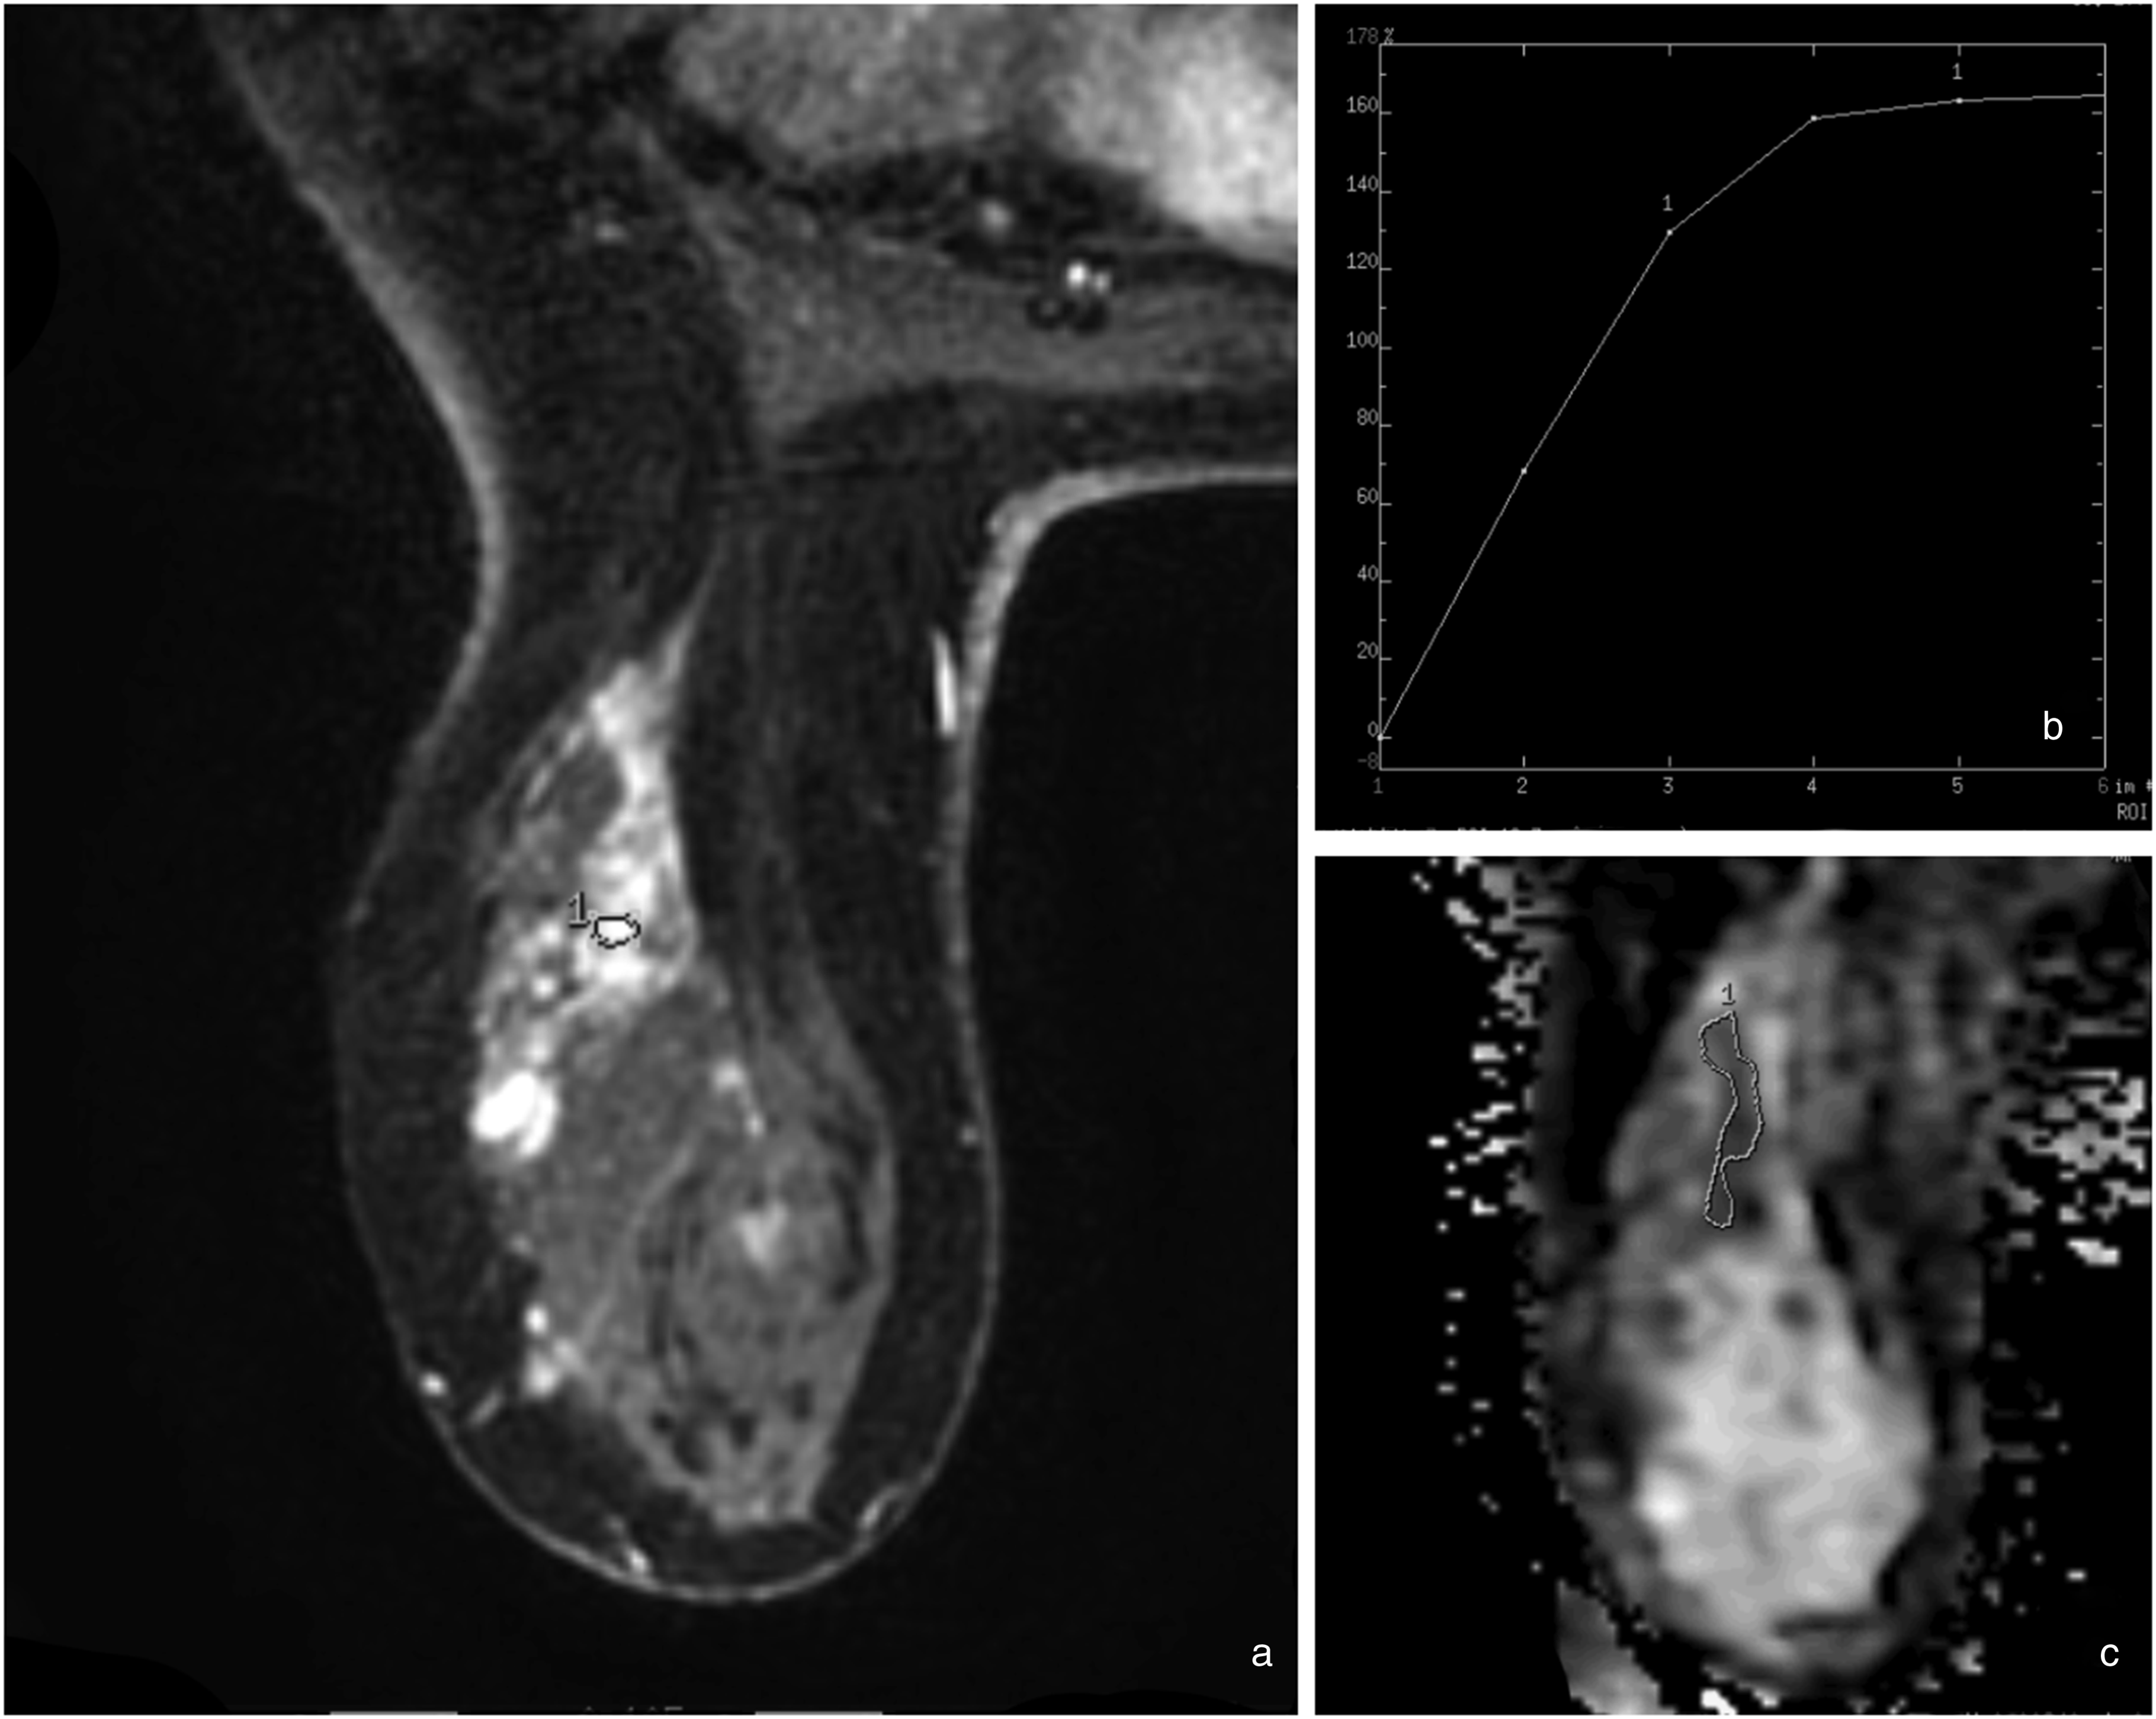
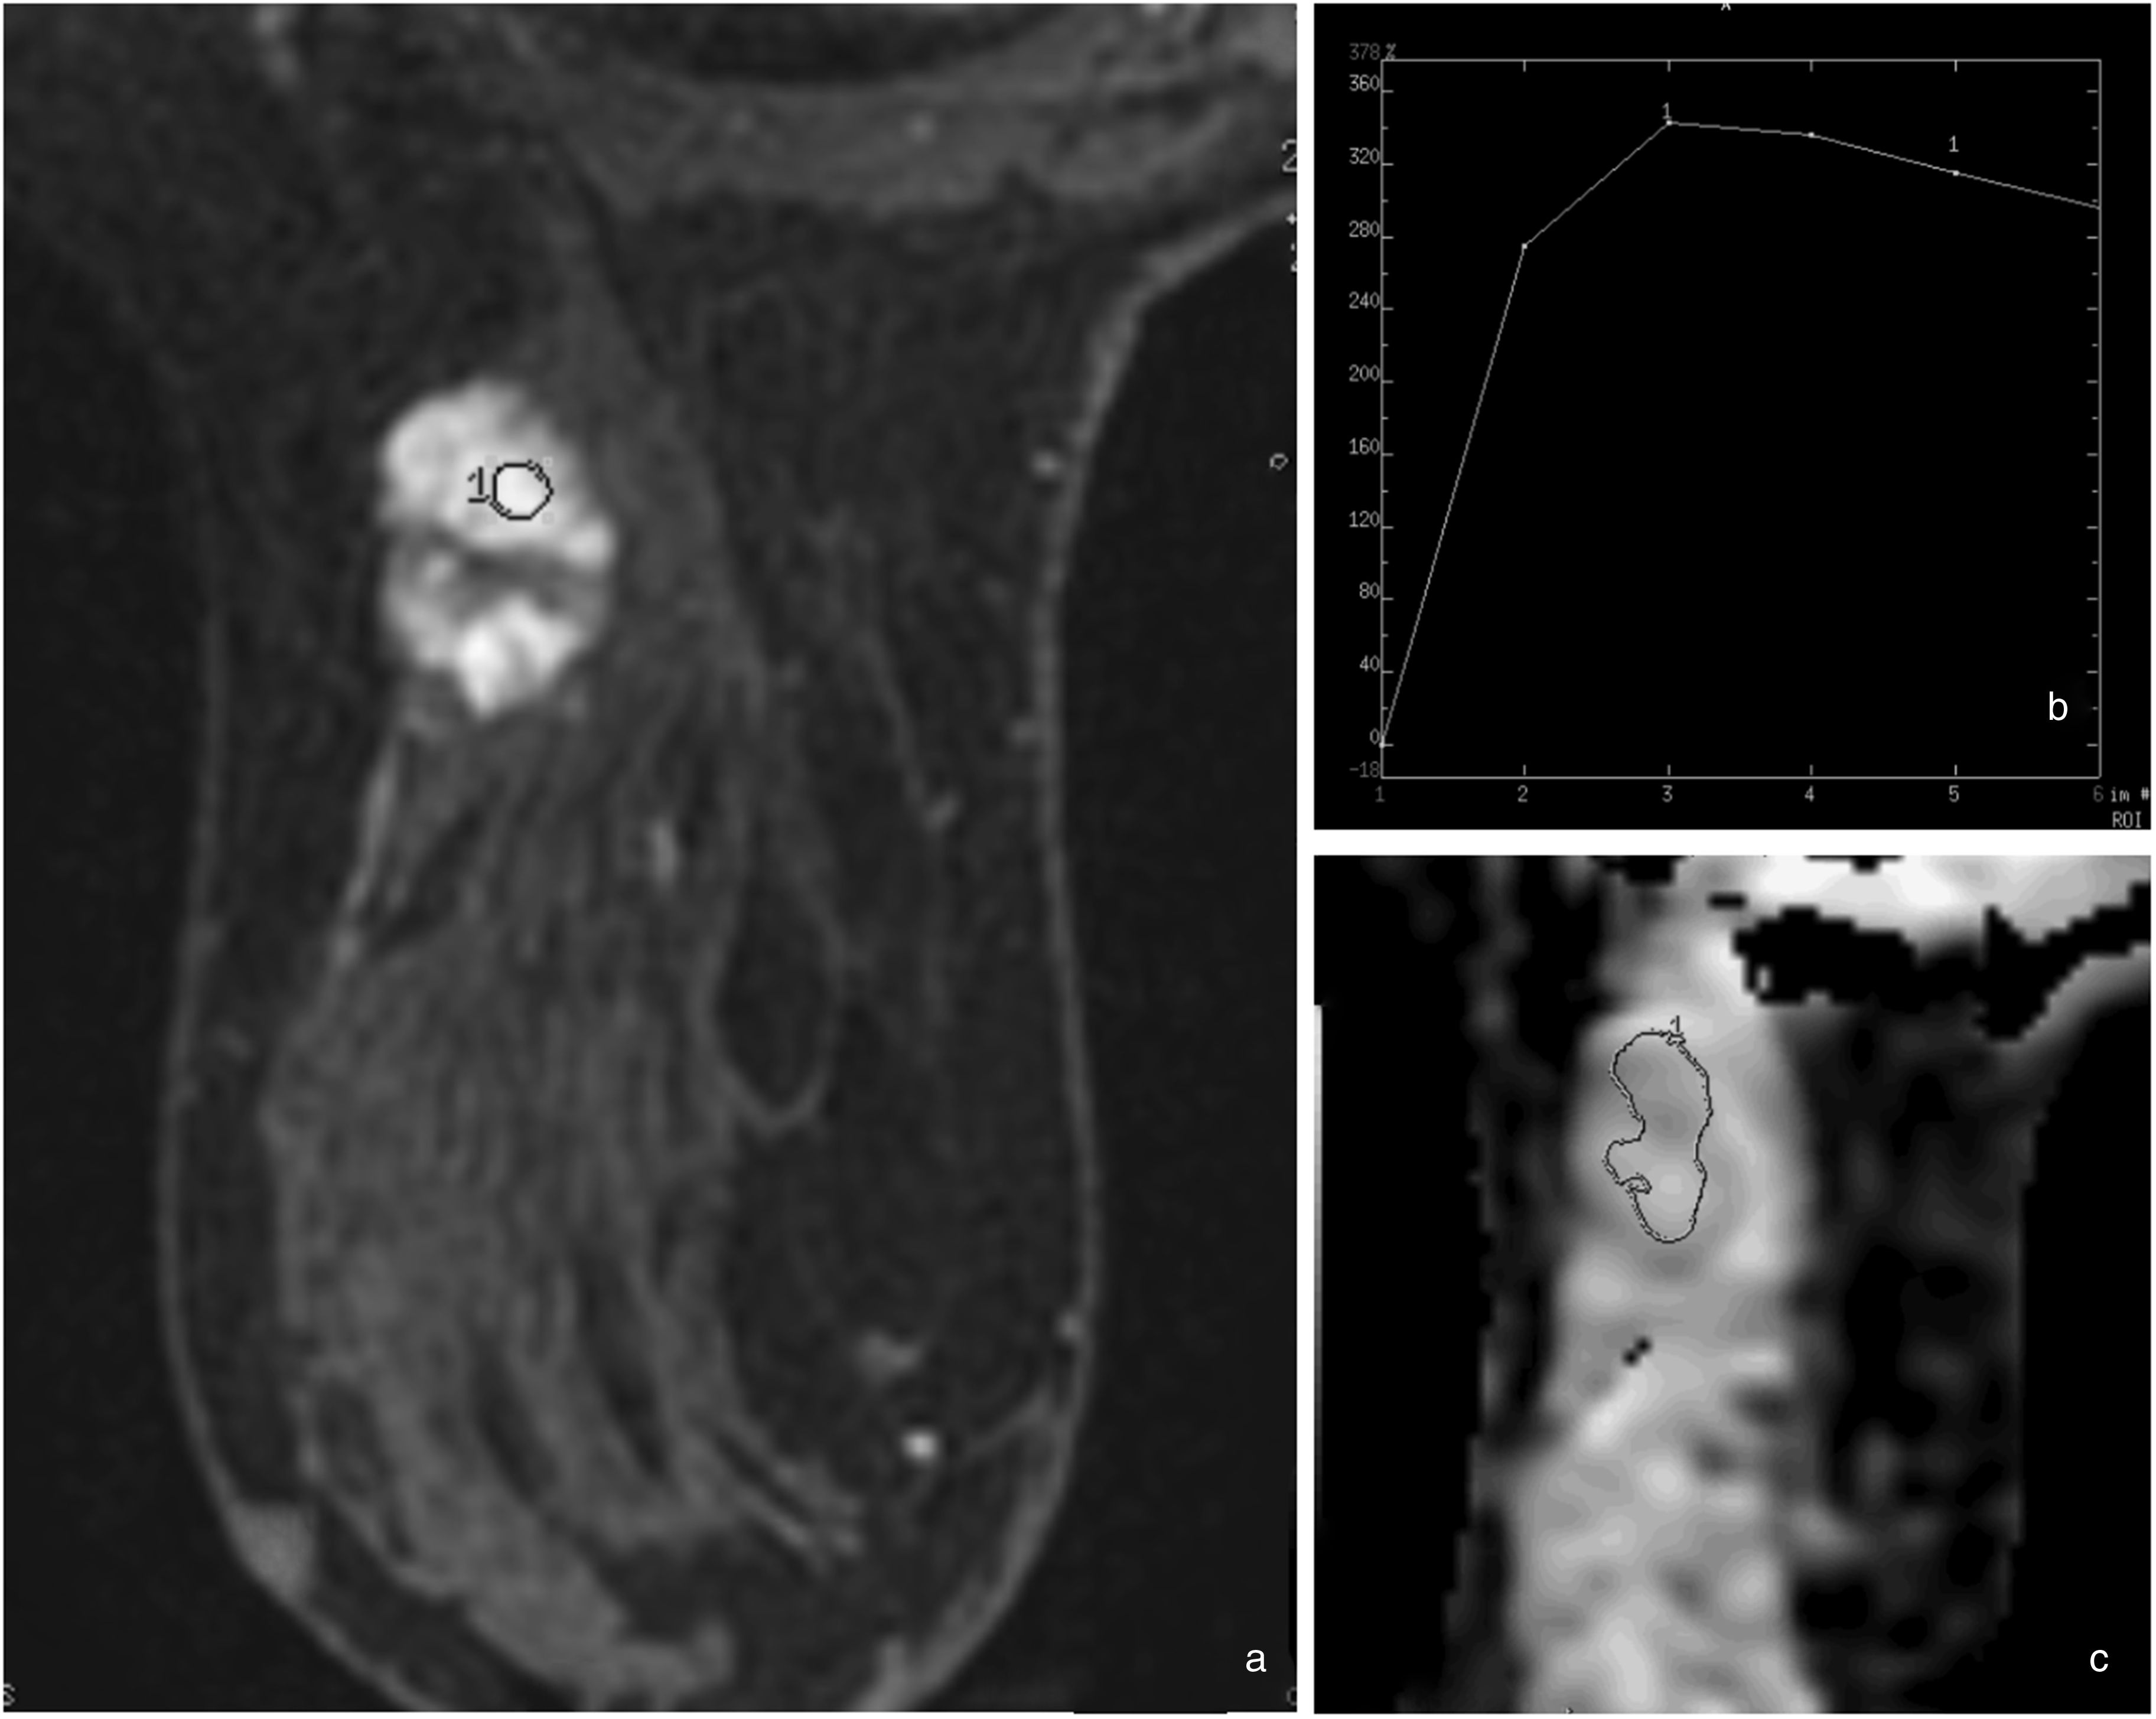
Malignancy with false-negative BI-RADS and true-positive ADC. (a) MRI showed non-mass enhancement at the upper outer quadrant of the left breast. (b) Kinetic analysis shows maximal enhancement of >100% and type I curve. Categorized as BI-RADS 3. (c) The ADC measured was 0.95 × 10⁻³ mm2/s. Histological examination showed ductal carcinoma in situ. ADC, apparent diffusion coefficient; MRI, magnetic resonance imaging.
According to our results, the combined method shows higher specificity, PPV, and accuracy than the BI-RADS classification. On the other hand, all the combined method's performance metrics (sensitivity, specificity, NPV, PPV, accuracy) are better than DWI. Because of our high NPV, these results could suggest applying the combined method in screening protocols, unlike DWI, where there is not yet enough evidence for its use in all screening examinations (16).
In the literature, several studies combined BI-RADS classification with DWI. Although there is a considerable variety in the population studied and the method followed, an increase in MRM specificity was observed, similar to our study (Table 7).
Sensitivity, specificity, PPV, NPV, accuracy, and AUC for the combined method for all lesions compared with similar studies found in the literature.
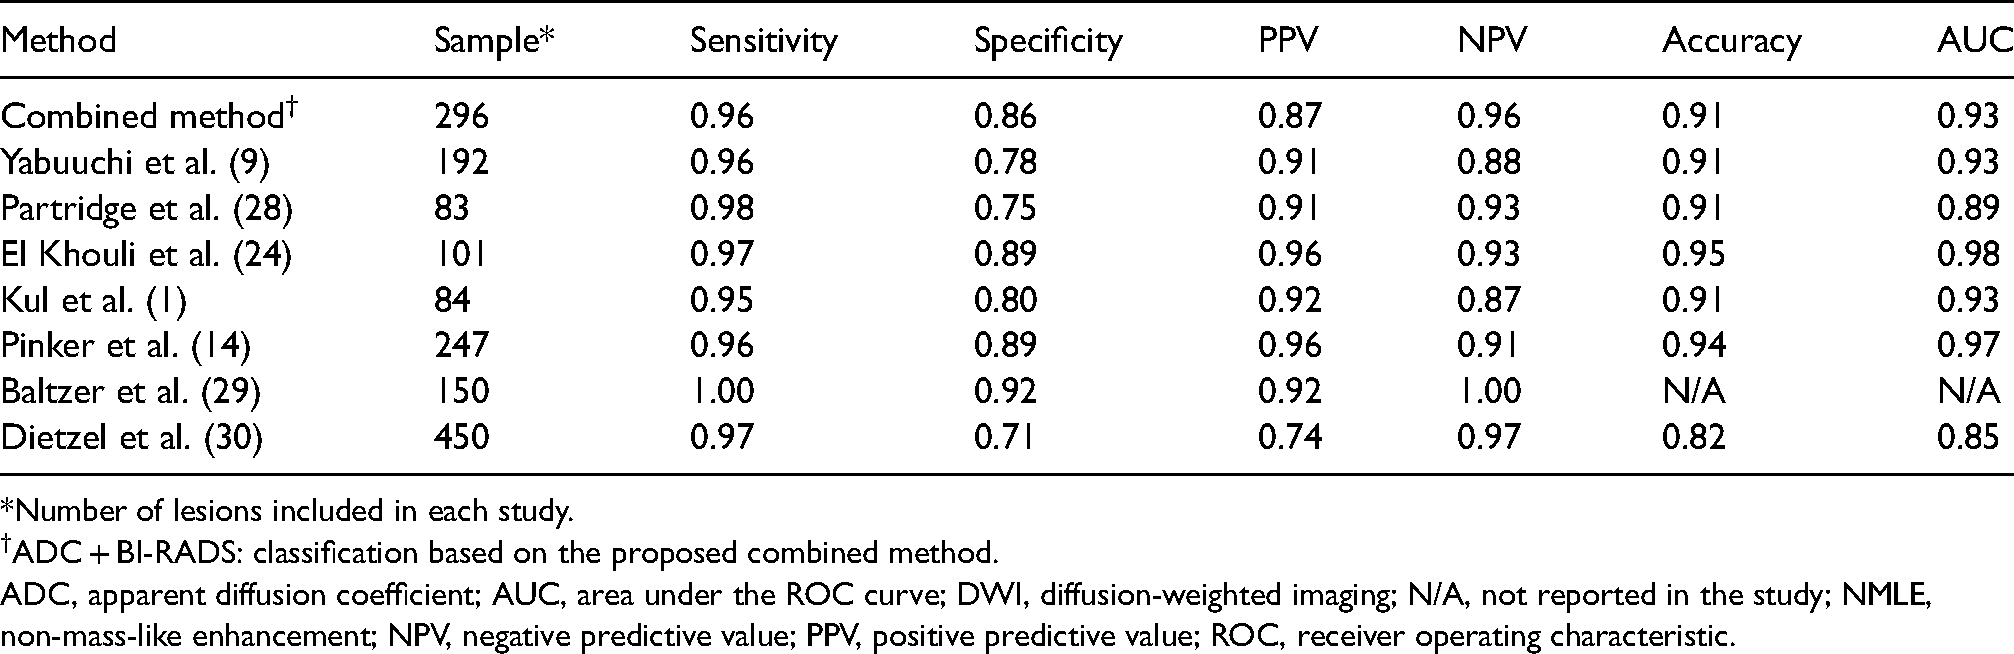
*Number of lesions included in each study.
ADC + BI-RADS: classification based on the proposed combined method.
ADC, apparent diffusion coefficient; AUC, area under the ROC curve; DWI, diffusion-weighted imaging; N/A, not reported in the study; NMLE, non-mass-like enhancement; NPV, negative predictive value; PPV, positive predictive value; ROC, receiver operating characteristic.
Compared with the studies mentioned above, apart from the study by Pinker et al. (14) in our study, we have a larger and more balanced sample with 296 lesions; of them, 143 were benign and 153 malignant. However, even in the study by Pinker et al., which included 247 lesions, the vast majority were malignant (209 lesions), which may be a cause for the differences in our statistical results.
A possible explanation for the different results between these studies, might be slight differences in temporal resolution between MRM protocols. The specificity of DCE-MRM depends strongly on the temporal resolution protocol used. The higher the temporal resolution, the more accurate the morphological assessment of the lesions, which has proven to be more important than their kinetic analysis at the evaluation of their benignity or malignancy (15,20).
Considering the ADC measurements, in our study, a freeform ROI was used, which was as large as possible, yet smaller than the lesion, in such a way as to include only tumor tissue, excluding normal tissue and cystic or necrotic components of the lesion. In a review and meta-analysis study of Wielema et al. (7), different methods of ROI positioning were evaluated, among which the use of a small ROI in the darkest part of the lesion on ADC maps. According to their results, the two methods with the higher pooled sensitivity, specificity, and AUC were a method similar to the one we used and the method of drawing a ROI in the area of lowest diffusion. Both ROI types are considered diagnostically equivalent.
The use of the combined method shows not only an increase in specificity and accuracy, but also a significant improvement in PPV of BI-RADS 4 lesions compared to the BI-RADS classification (Table 3). This is important because, as these are the lesions most often biopsied, a reduction of unnecessary biopsies might be achieved, and the proposed method could be a valuable tool to less-experienced breast radiologists.
The present study has some limitations. First, the BI-RADS classification of the lesions was carried out in consensus, and no inter-observer variability was estimated. Another limitation is the small number of NME lesions (39 cases). NME lesions are usually identified in young women with dense breasts and present known diagnostic limitations considering morphology and kinetic analysis. Applying the proposed combined mp-MRI on a large sample of NME lesions could contribute to the more accurate characterization of these lesions.
In conclusion, the combined method of adapting ADC thresholds per BI-RADS classification is a promising method with increased specificity, accuracy, and PPV, compared with BI-RADS classification or DWI alone.
Footnotes
Declaration of conflicting interests
The author(s) declared no potential conflicts of interest with respect to the research, authorship, and/or publication of this article.
Funding
The author(s) received no financial support for the research, authorship and/or publication of this article.