




Abstract
Background
Giant tumefactive perivascular spaces (PVSs) are uncommon benign cystic lesions. They can imitate cystic neoplasms.
Purpose
To evaluate the contribution of advanced neuro magnetic resonance imaging (MRI) techniques in the diagnosis of giant tumefactive PVSs and to further characterize these unusual cerebral lesions.
Material and Methods
The MRI scans of patients with tumefactive PVS diagnosed between 2010 and 2019 were retrospectively reviewed. All imaging studies included three plane conventional cerebral MRI sequences as well as precontrast 3D T1 MPRAGE, post-gadolinium 3D T1 acquisitions, sagittal plane 3D T2 SPACE, diffusion-weighted imaging, and time-of-flight (TOF) angiography. Some patients received perfusion MR, MR spectroscopy, diffusion tensor imaging (DTI), and contrast-enhanced TOF MR angiography.
Results
A perforating vessel was demonstrated in 16 patients (66.7%) by TOF imaging. In four patients, there were intracystic vascular collaterals on contrast-enhanced TOF MR angiography. Septal blooming was observed in four patients in susceptibility-weighted imaging. On perfusion MR, central hyperperfusion was observed in four patients, and peripheral hyperperfusion was observed in one patient. On MR spectroscopy, choline increase was observed in two patients, and there was a lactate peak in three patients, and both a choline increase and lactate peak in one patient. On DTI, there was fiber distortion in five patients and fiber deformation in one patient.
Conclusion
Advanced MRI techniques and 3D volumetric high-resolution MRI sequences can provide a valuable contribution to the diagnosis and can be successfully used in the management of these lesions.
Keywords
Introduction
Perivascular spaces (PVSs), also referred to as Virchow-Robin spaces (VRSs) after German pathologist Rudolf Virchow and French anatomist Charles Philippe Robin, are subpial complex cavities surrounding brain vascular structures (arterioles, arteries, venules, and veins), as they penetrate from the subarachnoid space into the brain parenchyma (1–5). They are tiny (usually <2 mm), fusiform, or tubular, smooth-walled interstitial fluid spaces and are discovered incidentally during brain imaging (3,6–8). Rarely, PVSs may reach a size >1.5 cm and are named giant tumefactive PVSs or giant tumefactive VRSs (4,7). Even more rarely, PVSs may present as extremely widening cystic pathologies with surrounding edema or assume bizarre cystic configurations with clusters of variably sized cysts (3,9). While PVSs are normally asymptomatic, giant tumefactive PVSs can be neurologically symptomatic because of their space-occupying effects. In symptomatic patients, giant tumefactive PVSs may occasionally mimic various pathologic processes, including cystic neoplasms (most often), infectious or parasitic cysts, neuroepithelial cysts, lacunar cystic infarctions, cystic leukomalacia, and mucopolysaccharidosis (7–11). Misdiagnosis in these cases may result in unnecessary neurosurgical intervention. For the correct diagnosis and to avoid unnecessary surgery, knowledge of the magnetic resonance (MR) signal characteristics and locations of giant PVSs is very important (3). Giant tumefactive PVSs have imaging features isointense to cerebrospinal fluid (CSF) at all pulse sequences of MR imaging (MRI) (7,12). According to their location, dilated PVSs have three types: along the lenticulostriate arteries in the basal ganglia and anterior perforated substance (type 1); along the perforating medullary arteries at the high convexities (type 2); and in the mesencephalothalamic area (type 3) (3,13). Despite the typical imaging characteristics and locations, conventional MRI sequences are occasionally inadequate for the correct diagnosis of giant PVSs. The present study is based on the hypothesis that advanced neuroimaging MR techniques such as perfusion MR, susceptibility-weighted imaging (SWI), diffusion tensor imaging (DTI), proton MR spectroscopy, and modern MRI sequences such as T2-weighted (T2W) sampling perfection with application optimized contrasts using different flip-angle evolution (SPACE), postcontrast T1-weighted (T1W) magnetization prepared rapid gradient echo (MPRAGE), and contrast-enhanced time-of-flight (TOF) MR angiography can contribute to the correct diagnosis of giant tumefactive PVSs. Thus, unnecessary neurosurgical intervention can be avoided. While conventional MRI features of giant tumefactive PVSs have been reported (9), no advanced neuroimaging findings of a large series of these lesions have been presented. The aim of the present study was to evaluate the contribution of advanced neuro MRI techniques to the diagnosis of giant tumefactive PVSs and to further characterize these unusual cerebral lesions.
Material and Methods
The MRI scans of patients with tumefactive PVSs diagnosed between 2010 and 2019 were retrospectively reviewed. A total of 24 patients (10 men [41.7%], 14 women [58.3%]; mean age = 45.1± 17.4 years) were included in the study. Approval for the study was granted by the local ethics committee (20.05.2020- 71522473/050.01.04/252), and all procedures were applied in accordance with the principles of the Helsinki Declaration. Informed consent was waived because of the retrospective nature of the study.
The MRI examinations were performed on a 3-T MR system (Magnetom Skyra; Siemens Healthcare, Erlangen, Germany) using a 32-channel head coil. All imaging studies included conventional axial spin-echo (SE) T1, coronal and sagittal turbo spin-echo (TSE) T2, axial fluid-attenuated inversion recovery (FLAIR), precontrast 3D T1 MPRAGE, post-gadolinium (0.1 mmol/kg) 3D T1 acquisitions, and sagittal plane 3D T2 SPACE sequences. In addition, TOF angiography and diffusion-weighted imaging (b = 800 s/mm2) of all patients were available. SWI, perfusion, 1H MRS (TR/TE = 2000 ms/30 ms for point-resolved spectroscopy), and DTI (32 directions; TR = 3995 ms; TE = 72 ms; matrix = 128 × 128) data were available for 10 (41.7%), 8 (33.3%), 11 (45.8%), and 7 (29.2%) of the 24 patients, respectively.
The images were retrospectively reviewed together by two radiologists with 15 and 8 years of experience, respectively. Lesion location, shortest size, and presence or absence of the following features were recorded for each patient: septation; contrast enhancement; perforating vessels; signal changes in the lesion; and its neighborhood compared to the healthy contralateral side of the brain. The presence or absence of blooming (from SWI images), perfusion changes (in perfusion-weighted images), or fiber deformation/ distortion (from DTI data), as well as changes in metabolic levels or composition (from 1H MRS data) compared to the healthy contralateral side of the brain were assessed.
MedCalc version 12 (Ostend, Belgium) was used for statistical analysis. Descriptive statistics are given as the median (range) and mean ± standard deviation. Categorical variables were stated as frequencies and percentages. The chi-square test was used for the comparison of categorical variables. The independent samples t test was used for the comparison of continuous variables with a normal distribution, and the Mann–Whitney U and Kruskal–Wallis tests were used for the data that did not conform to a normal distribution in the Kolmogorov–Smirnov test. A value of P < 0.05 was accepted as statistically significant.
Results
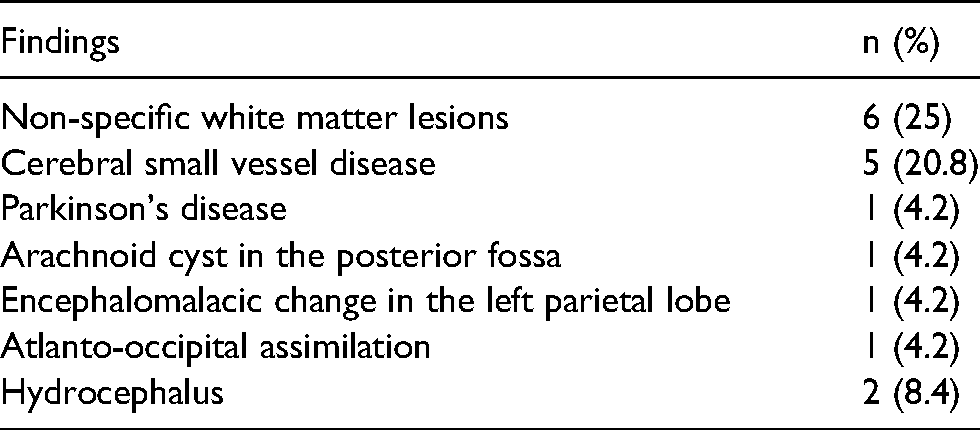
The mean lesion size was 27.9 ± 14 mm. The most common locations of tumefactive PVSs were the temporal lobe and anterior commissure. Anatomic location distributions of the lesions are summarized in Table 1. Septation was observed in 12 (50%) of the lesions (Fig. 1a–c, Fig. 2a and b, Fig. 3a). Fifteen patients (62.5%) had other accompanying pathologies (Table 2). Signal changes were observed around the lesion in 20 (83.3%) of the patients (Fig. 2a). Out of the 24 cases, peripheral contrast enhancement was detected in 6 (25%) patients and septal contrast enhancement was detected in a further 4 (16.7%) (Fig. 1b). A perforating vessel was demonstrated in 16 (66.7%) patients by TOF imaging. In four of six patients who underwent contrast-enhanced TOF MR angiography, we detected intracystic vascular collaterals (Fig. 1c and d, and Fig. 2c–e).
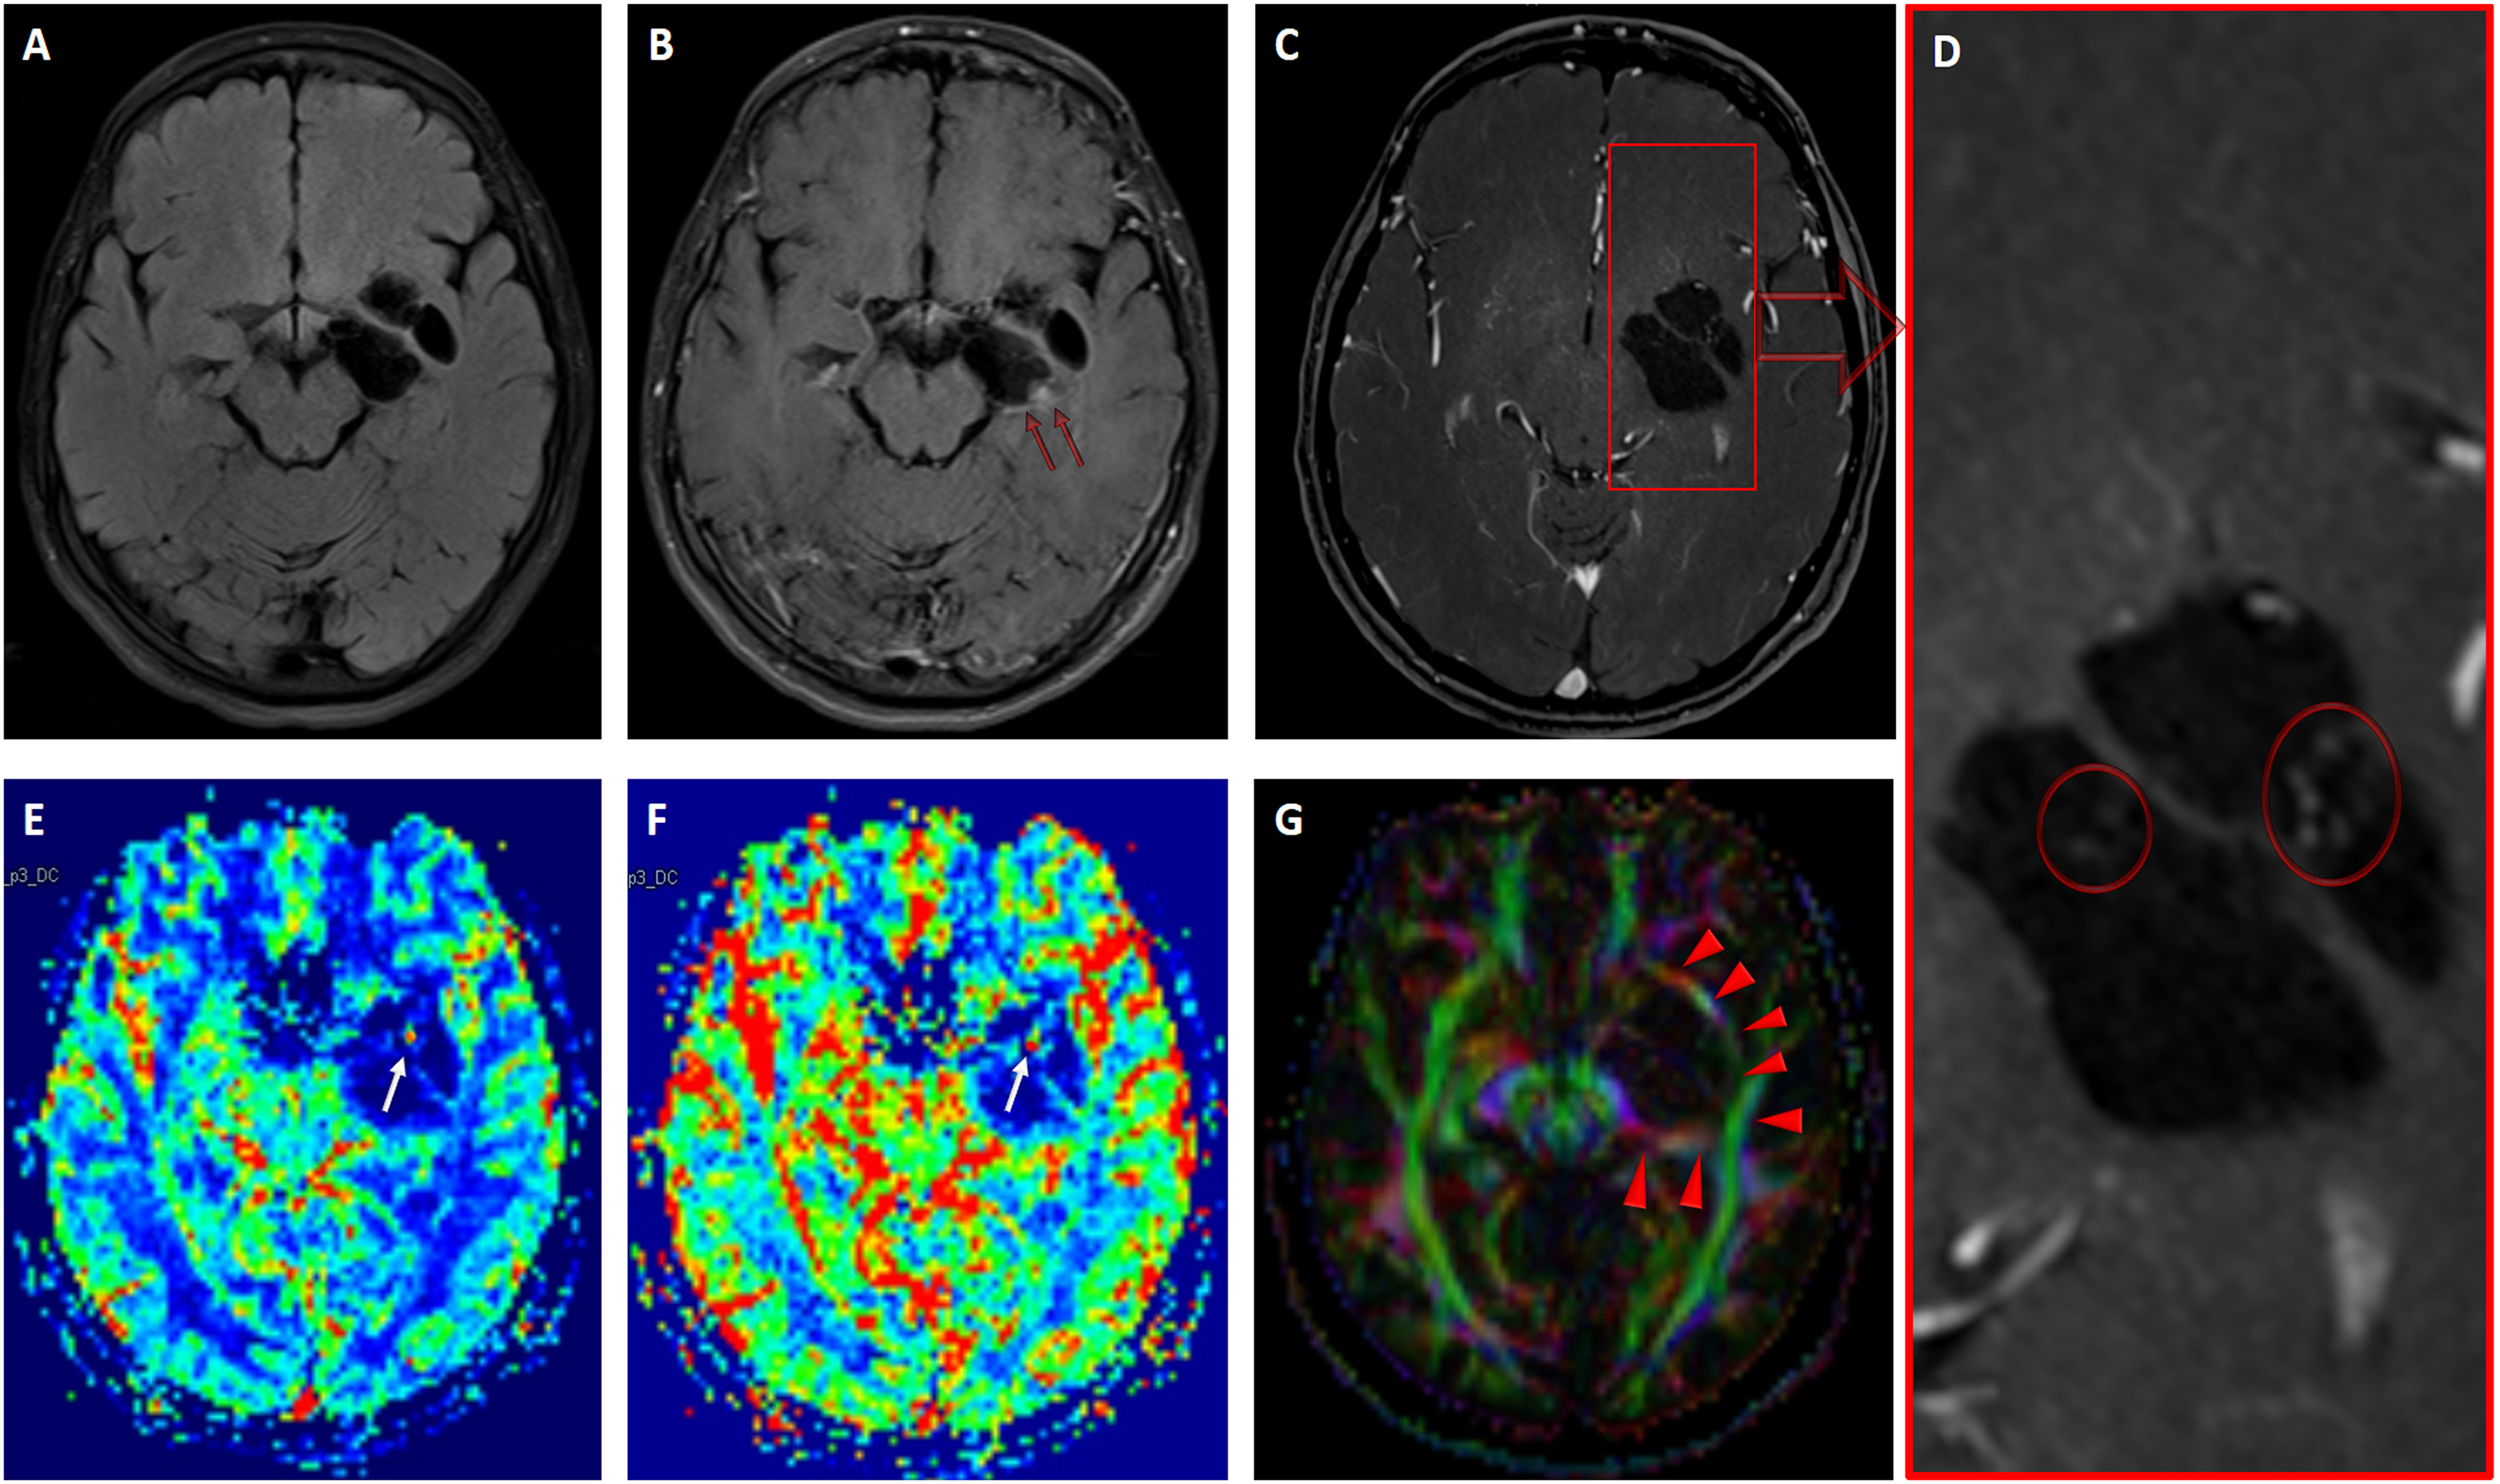
(A) Precontrast axial FLAIR sequence shows the left commissural multiloculated giant PVS. (B) Postcontrast axial FLAIR image shows a peripheral nodular enhancement pattern (red arrows). (C, D) Postcontrast axial TOF MR angiography reveals central perforating vessels and multiple central collateral vascular structures (circles). (E, F) DSC T2* perfusion MR imaging scans (rCBF and rCBV) show a central hyperperfusion pattern (white arrows). (G) Diffusion tensor imaging fractional anisotropy color map shows distortion of the projection and long association fibers (arrowheads). CBF, cerebral blood flow; CBV, cerebral blood volume; DSC, dynamic susceptibility contrast; FLAIR, fluid attenuation inversion recovery; MR, magnetic resonance; PVS, perivascular space; TOF, time of flight.
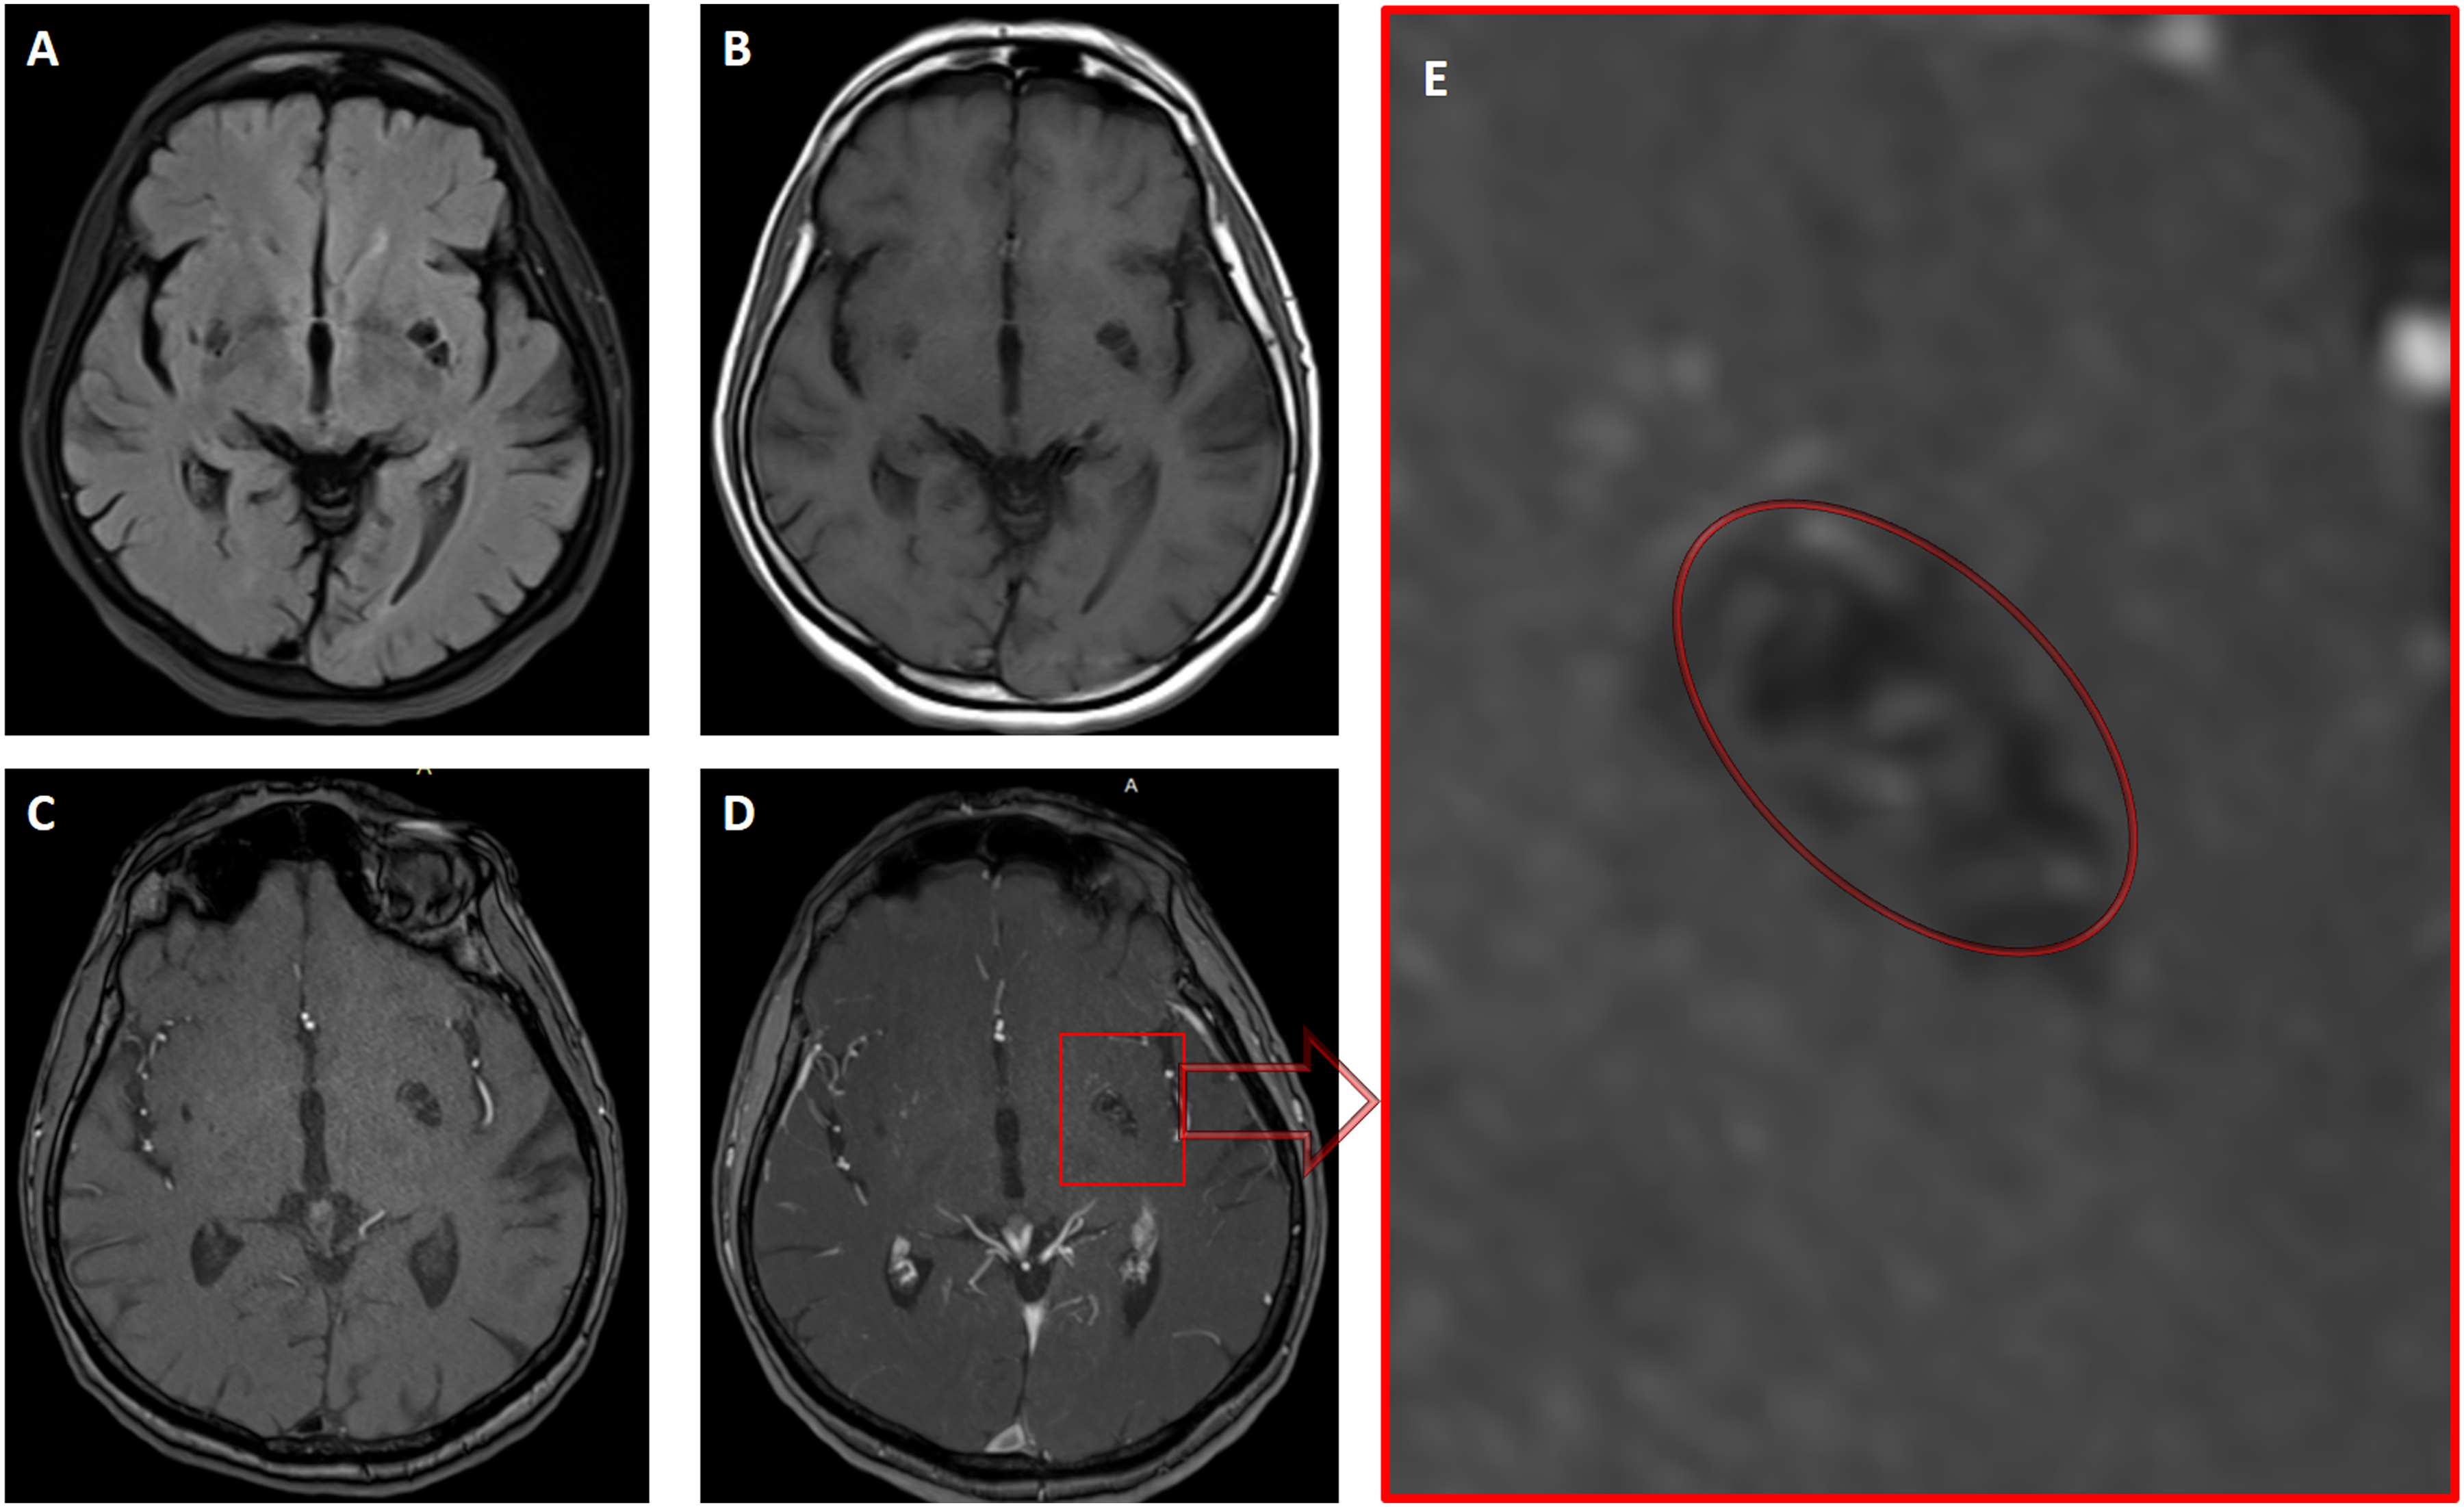
(A, B) Axial FLAIR- and axial T1-weighted MRI sequences show a giant tumefactive PVS with septation at the left commissure level. (c) Precontrast axial TOF MR angiography shows central perforating vessels. (D, E) Postcontrast axial TOF MR angiography and magnified image reveal multiple central collateral vascular structures (circle) within the giant PVS. FLAIR, fluid attenuation inversion recovery; MRI, magnetic resonance imaging; PVS, perivascular space; TOF, time of flight.
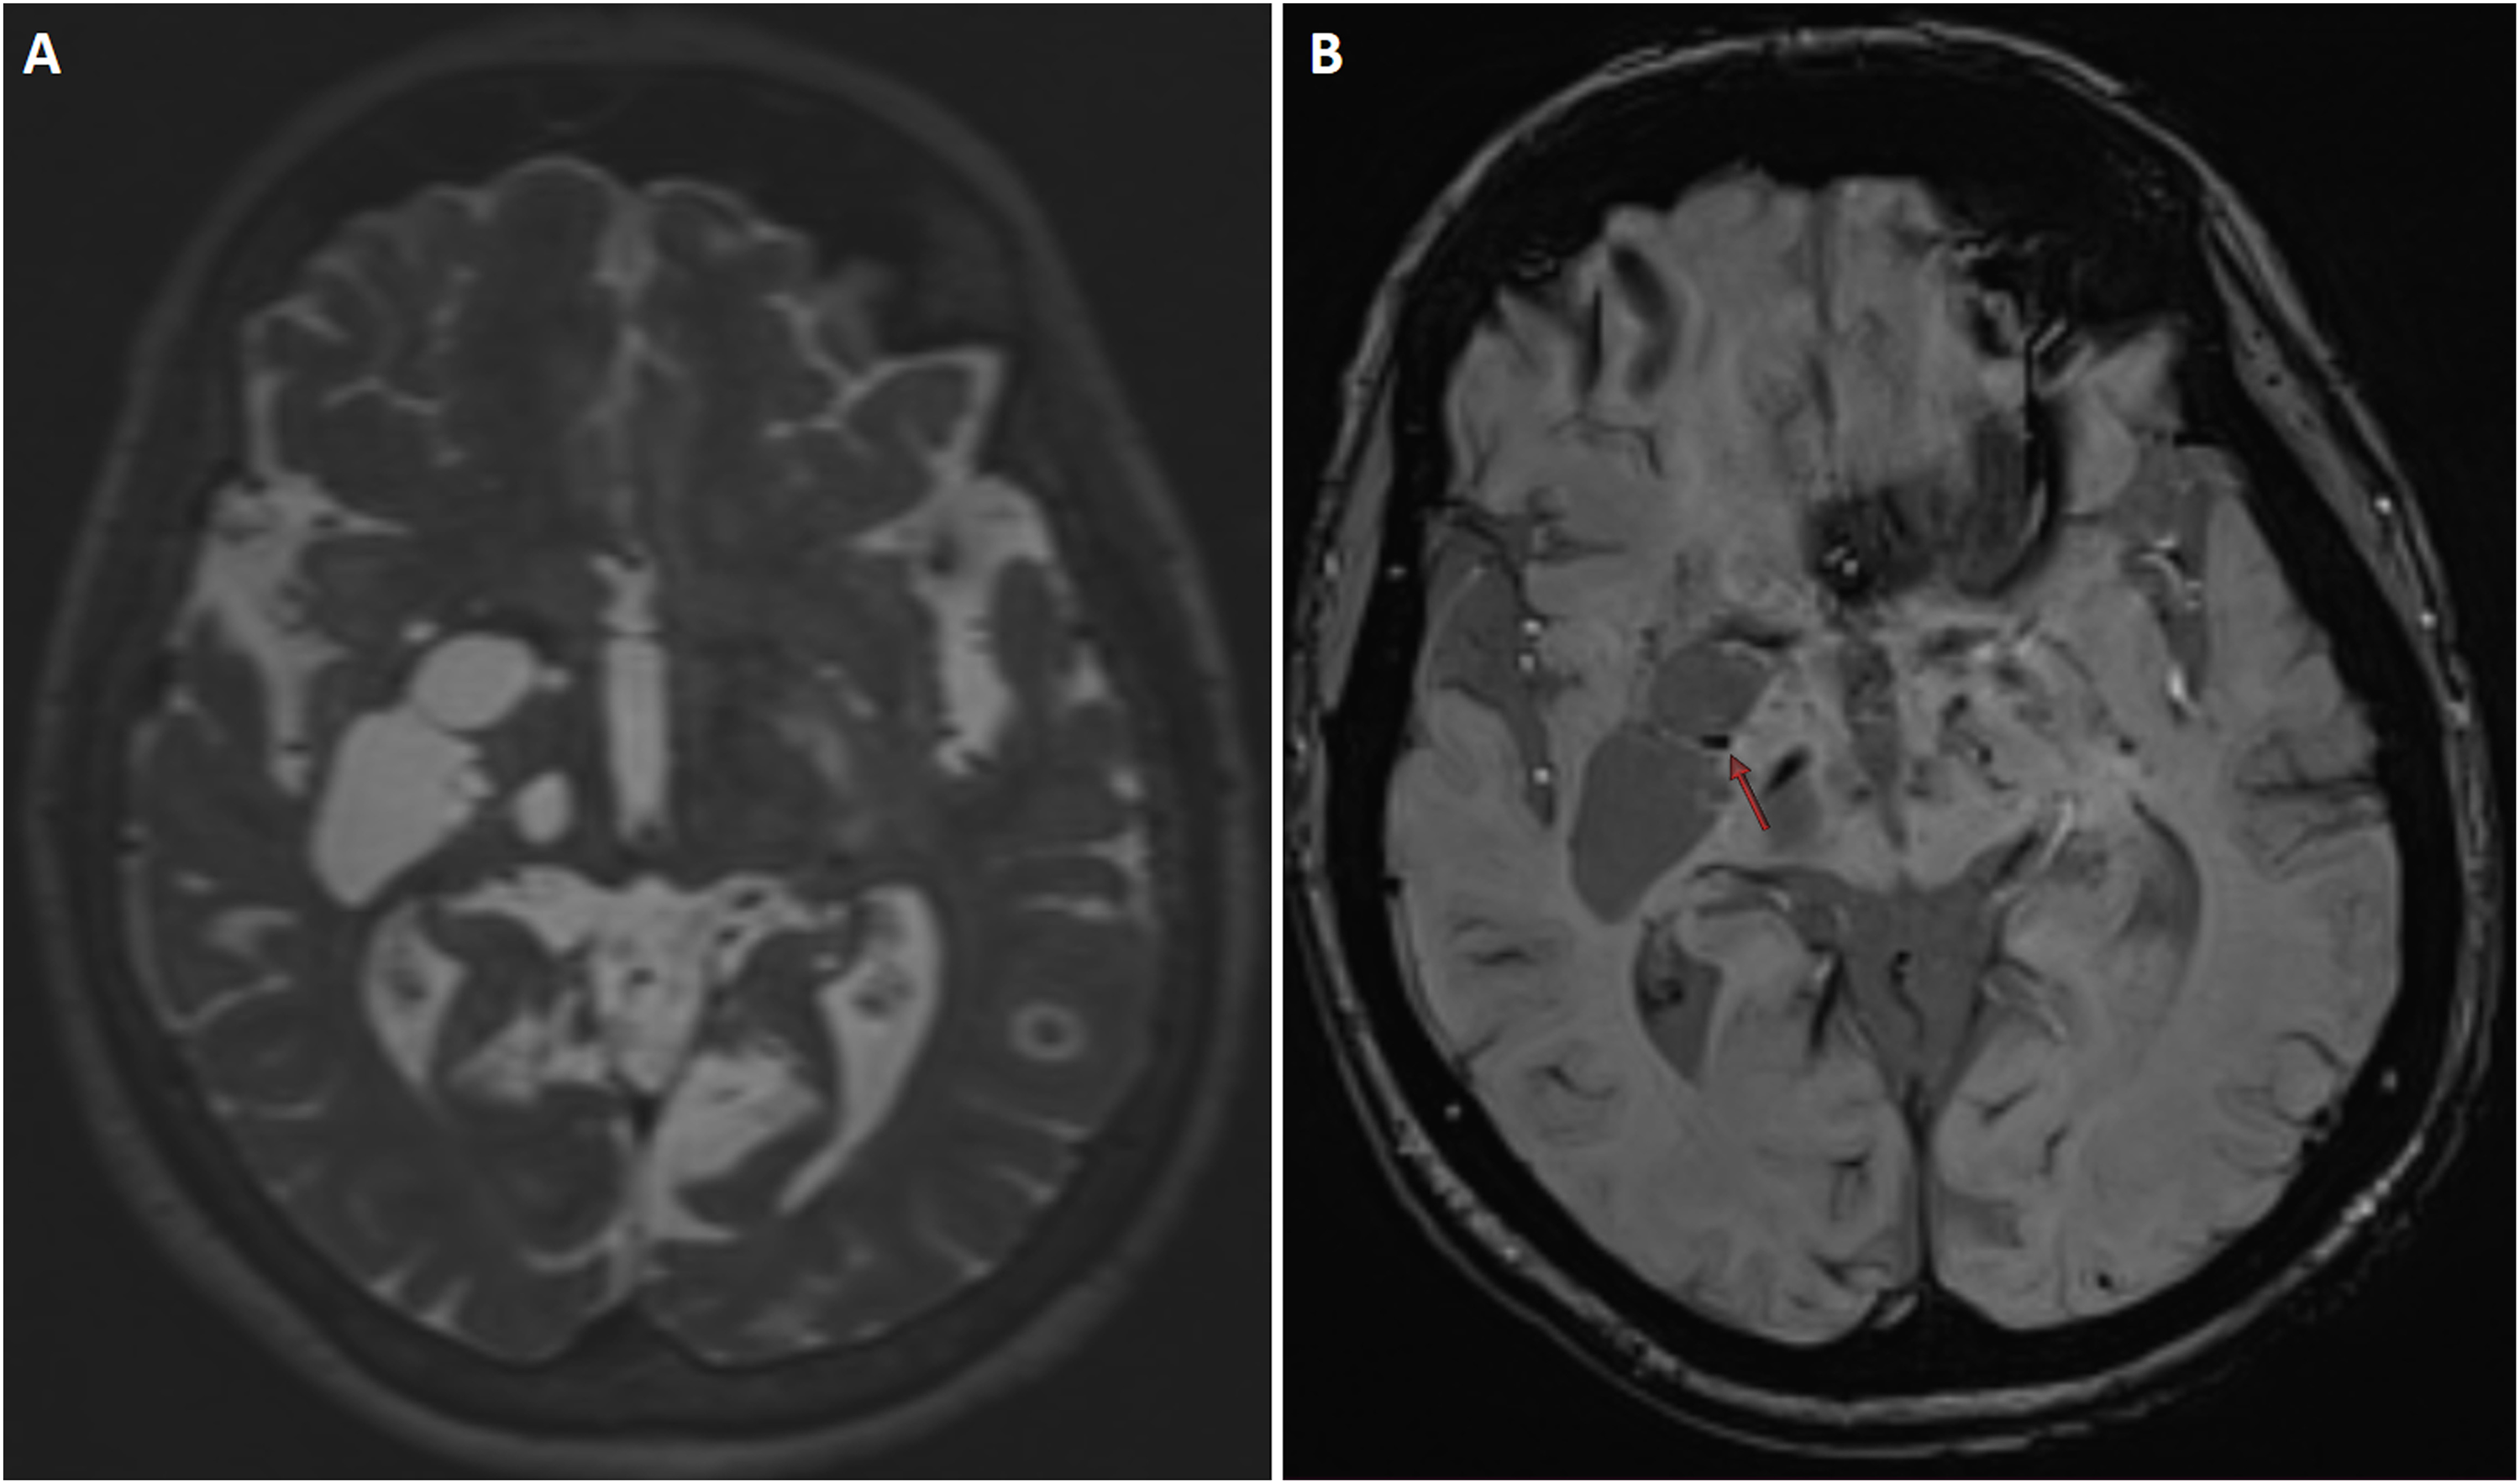
(A) Axial T2-weighted SPACE MRI sequence shows a giant tumefactive perivascular space with septation at the right commissure level. (B) Axial SWI sequence reveals a septal blooming artifact (red arrow). PVS, perivascular space; MRI, magnetic resonance imaging; SWI, susceptibility-weighted imaging.
Locations of tumefactive PVSs.

PVS, perivascular space.
Findings accompanying tumefactive perivascular spaces.
No positive findings were detected in 6 (60%) of 10 patients with SWI scans. Septal blooming was observed in 4 (40%) patients (Fig. 3a and b). No increased perfusion findings were detected in 3 (37.5%) of 8 patients who had perfusion-weighted images (Fig. 4a–d). Central hyperperfusion was observed in 4 (50%) patients (Fig. 1e and f), and peripheral hyperperfusion was observed in 1 (12.5%). There were central vascular collaterals in contrast-enhanced T1 MPRAGE and TOF MR angiography images of the patients with central hyperperfusion (Fig. 1c and d). No increased choline and lactate findings were detected in 5 (45.5%) of 11 patients with MR spectroscopy (Fig. 4e). Choline increase was observed in 2 (18.2%) patients, lactate peak was observed in 3 (27.3%) patients (Fig. 5), and both choline increase and lactate peak were observed in 1 (9%) patient (Fig. 6). No positive findings were detected in 1 (14.3%) of the 7 patients with DTI images. Fiber distortion was detected in 5 (71.4%) patients (Fig. 1g), and fiber deformation was detected in 1 (14.3%) patient. Positive SWI, MR perfusion, MR spectroscopy, and DTI findings of the patients are presented in Table 3.
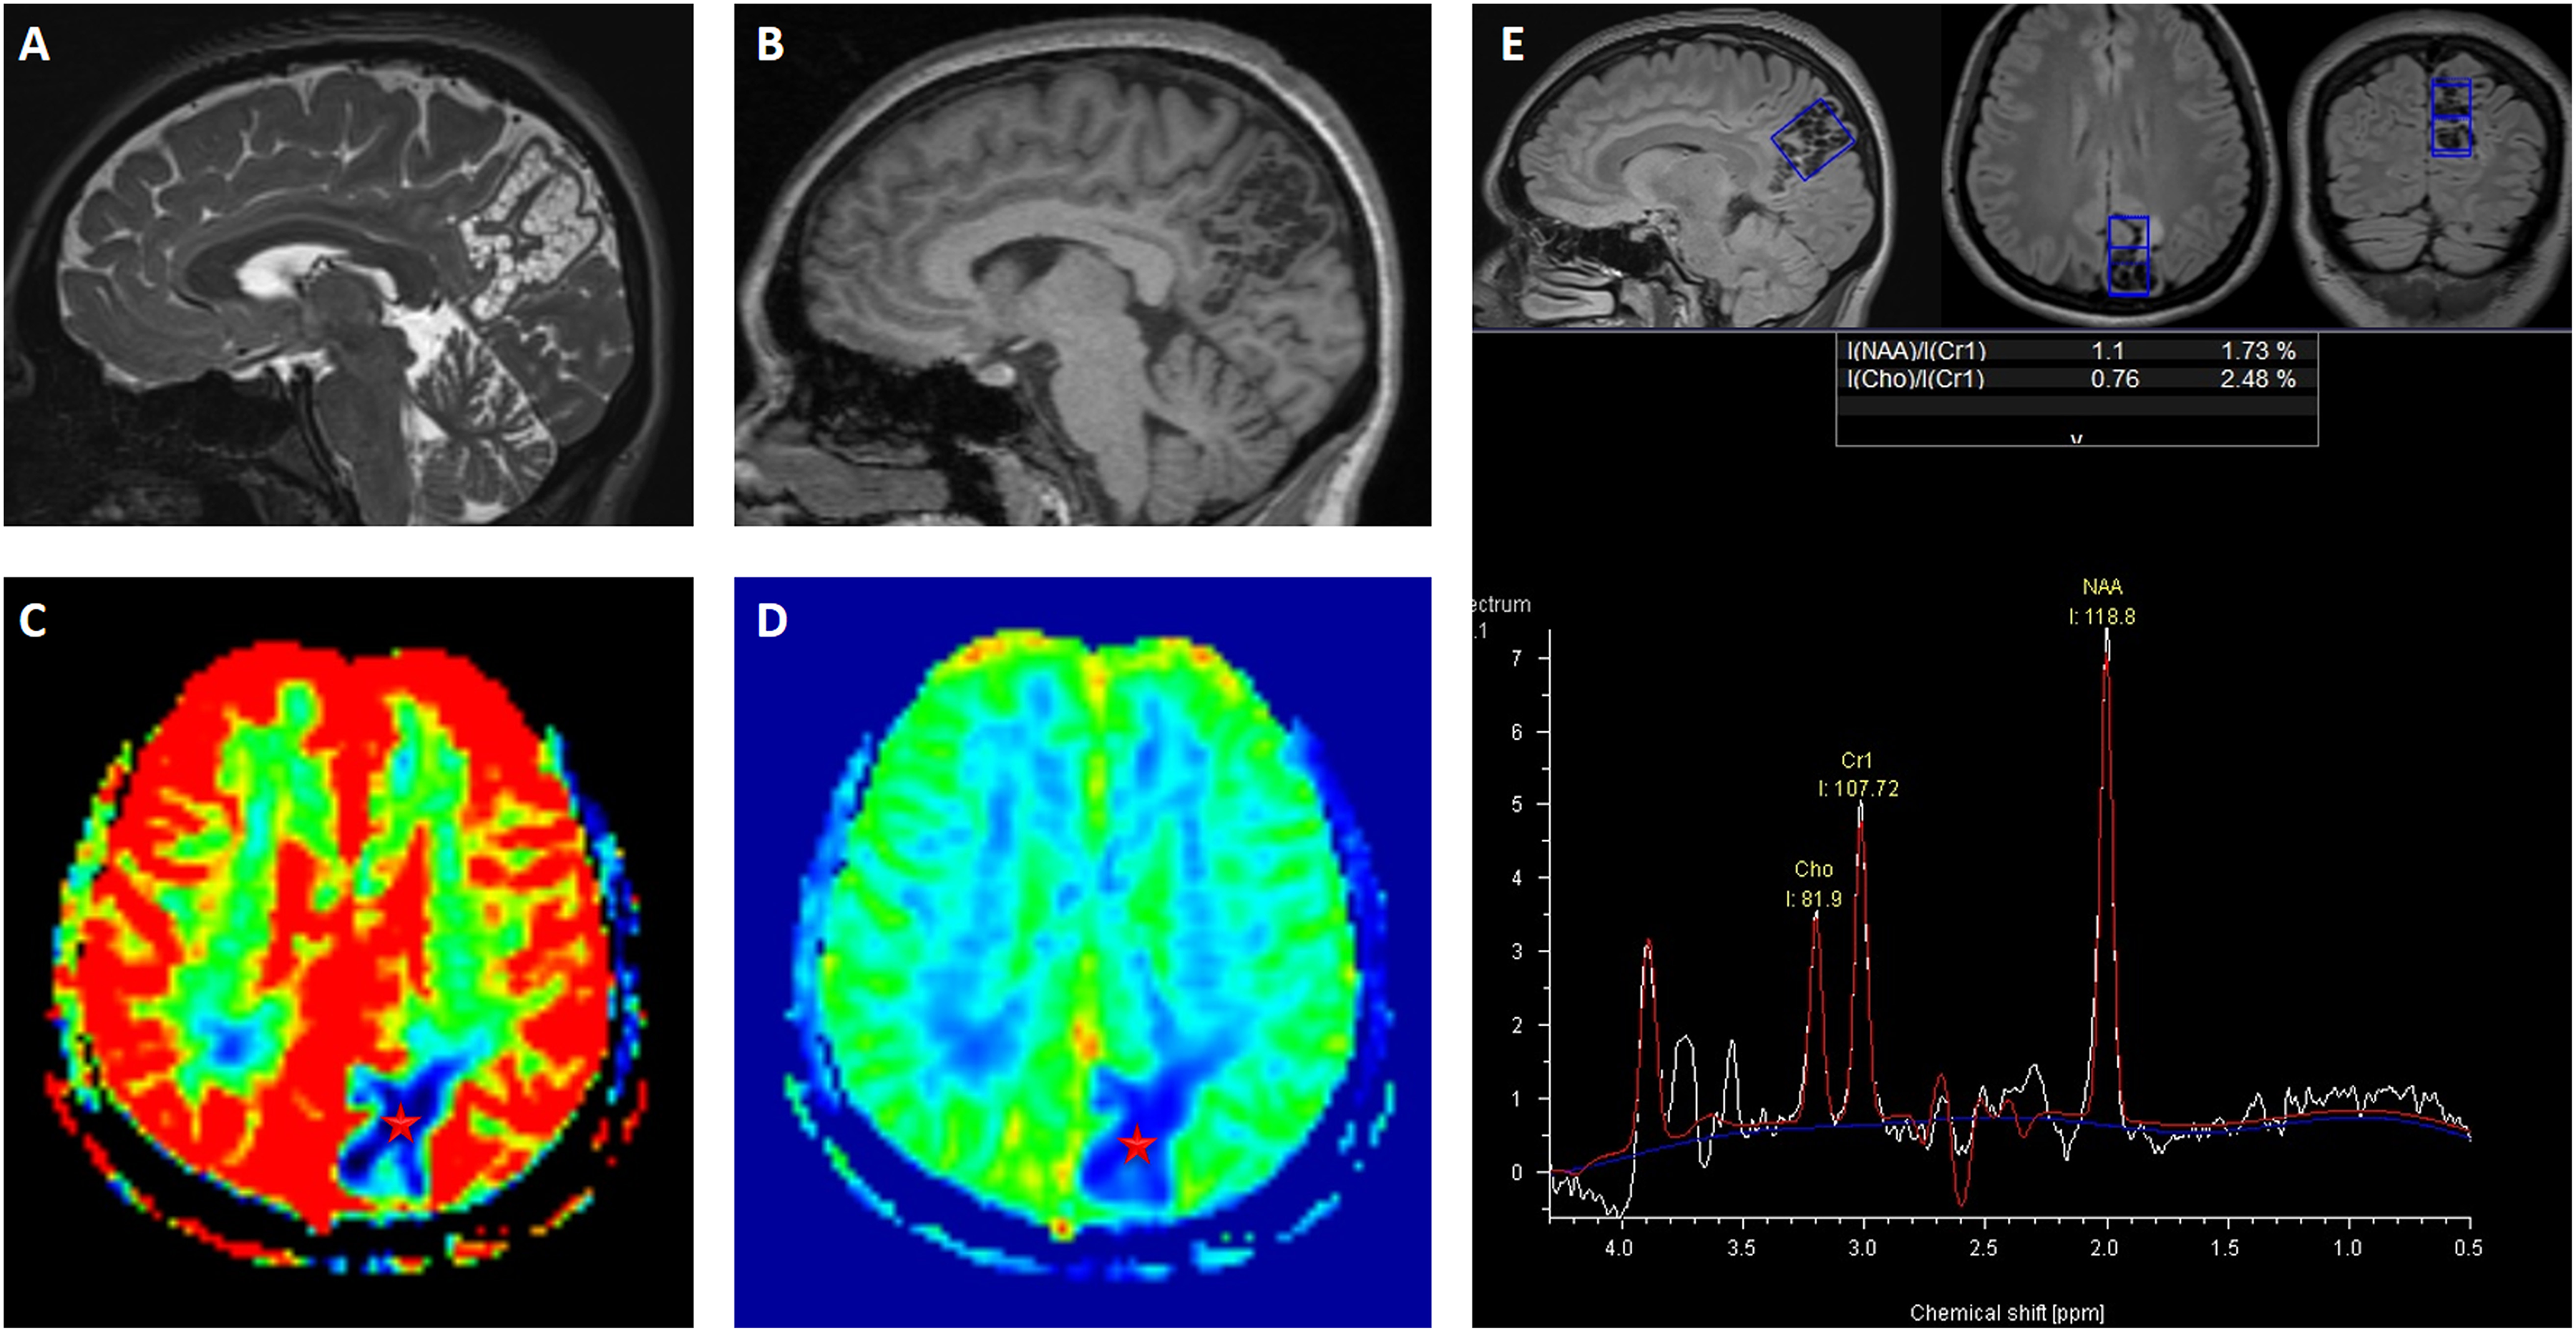
(A, B) Sagittal T2-weighted SPACE and T1-weighted MPRAGE MRI scans show a giant tumefactive PVS with cluster septation in the left parietal lobe. (C, D) DSC T2* perfusion MRI scans (rCBV and rCBF) show a completely hypoperfusion pattern (asterisks). (E) Single-voxel MR spectroscopy shows normal metabolite distribution without increased choline and lactate peaks. CBF,
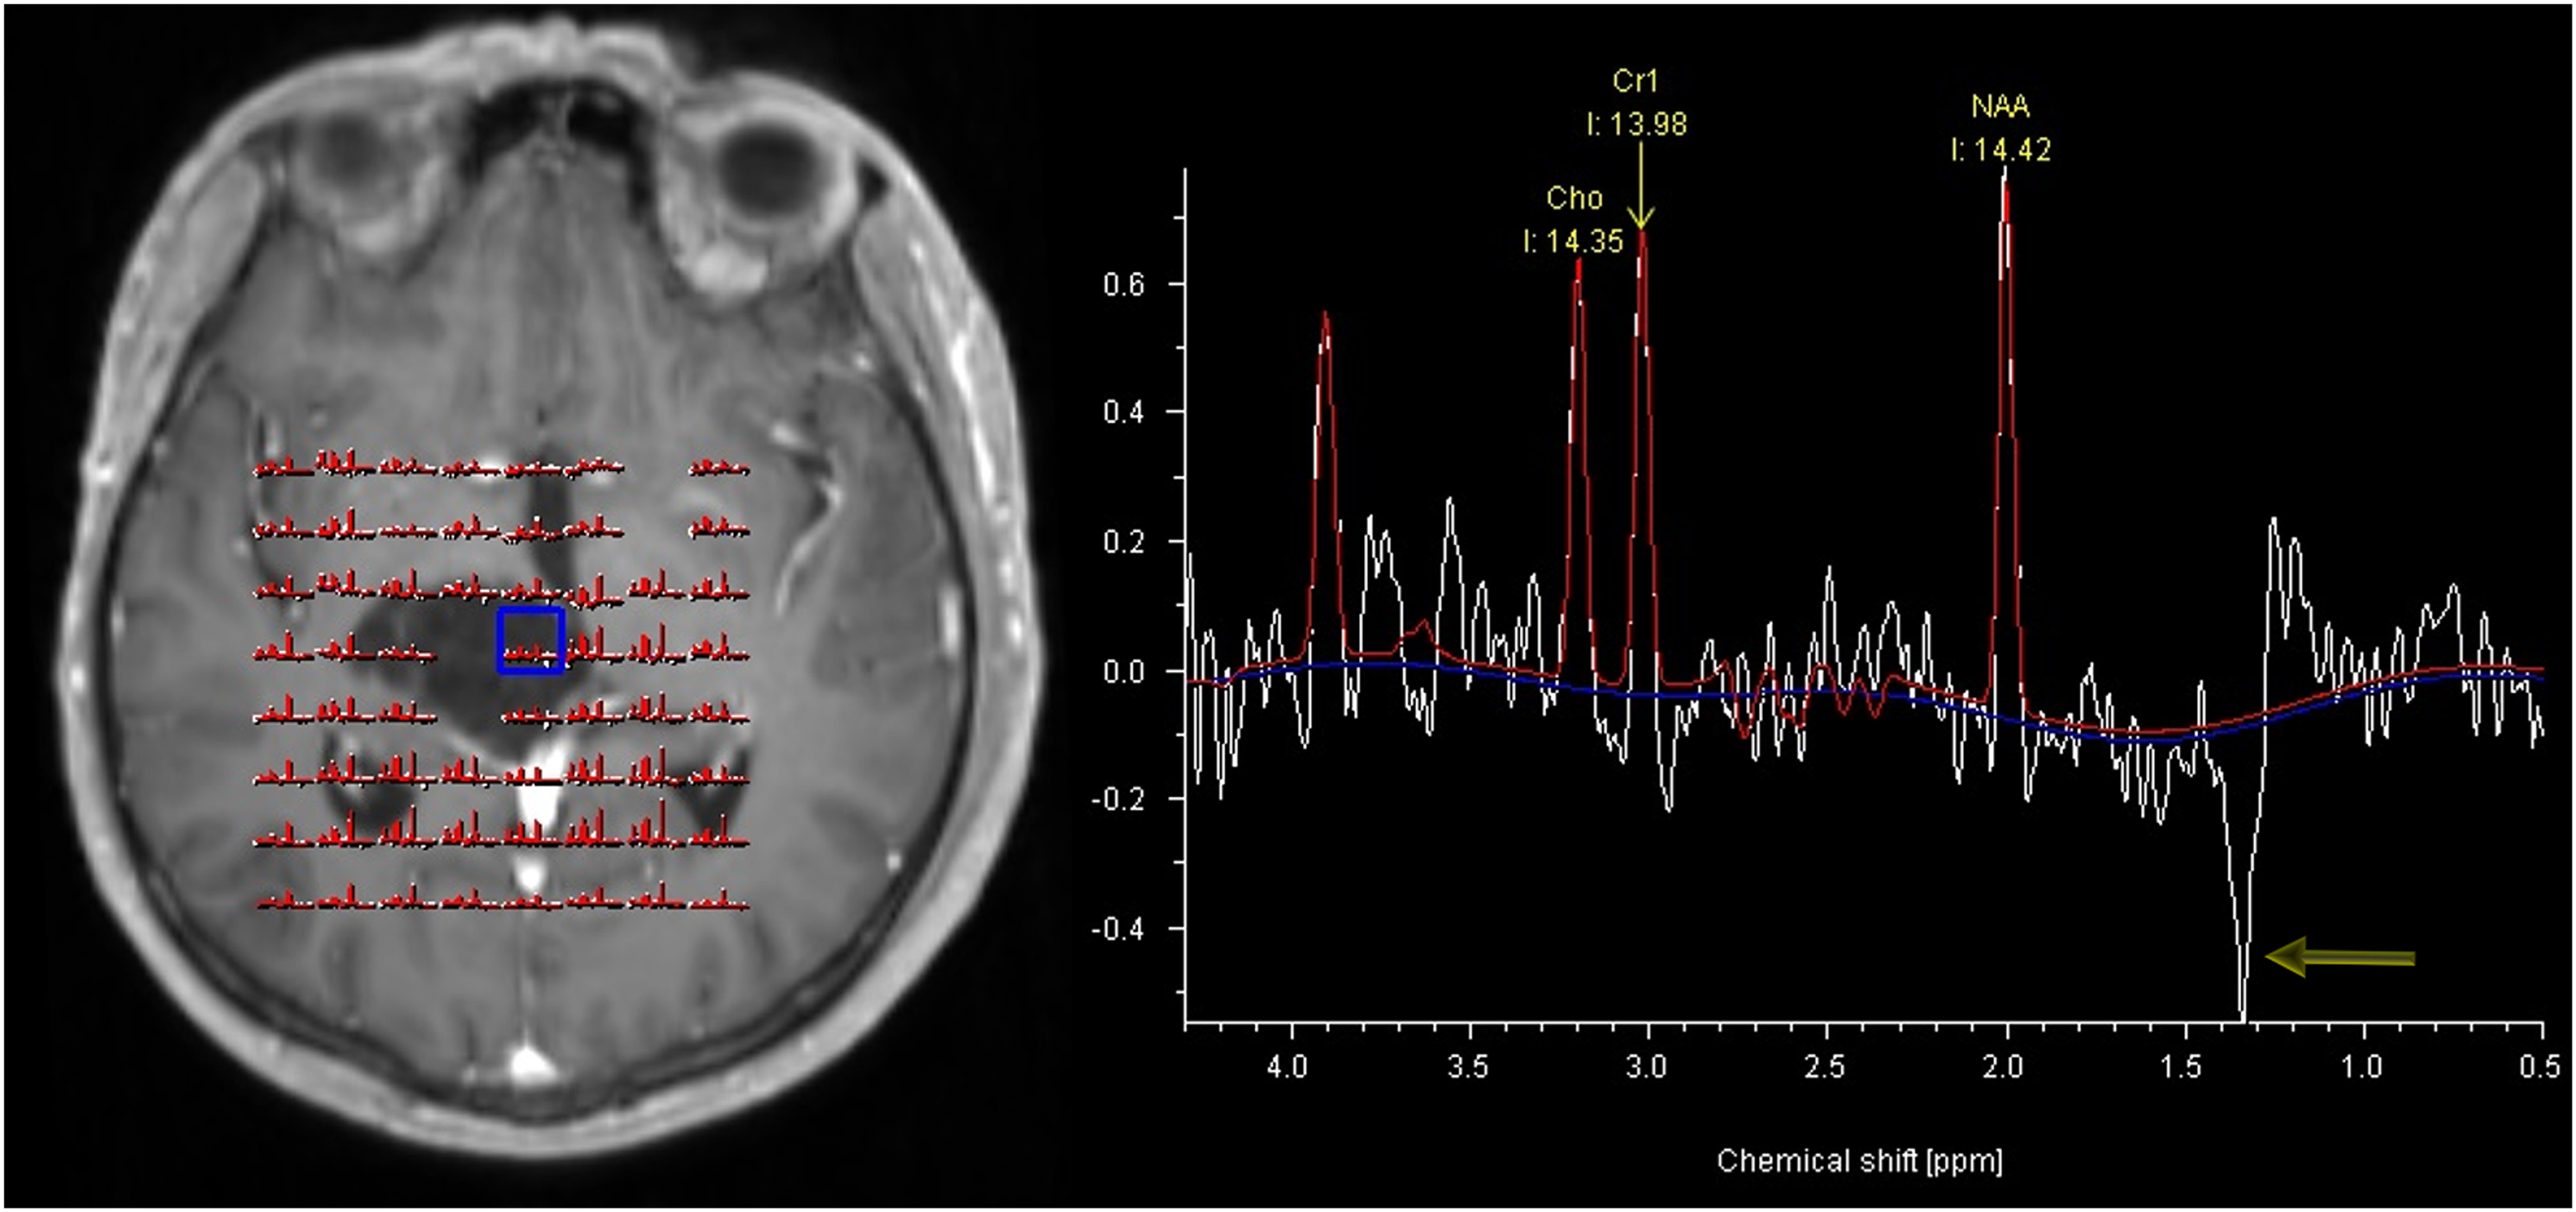
MR spectroscopy findings of the right thalamic giant PVS. Multivoxel MR spectroscopy (CSI) shows a reverse lactate peak (arrow) without choline elevation. MR, magnetic resonance; PVS, perivascular space.
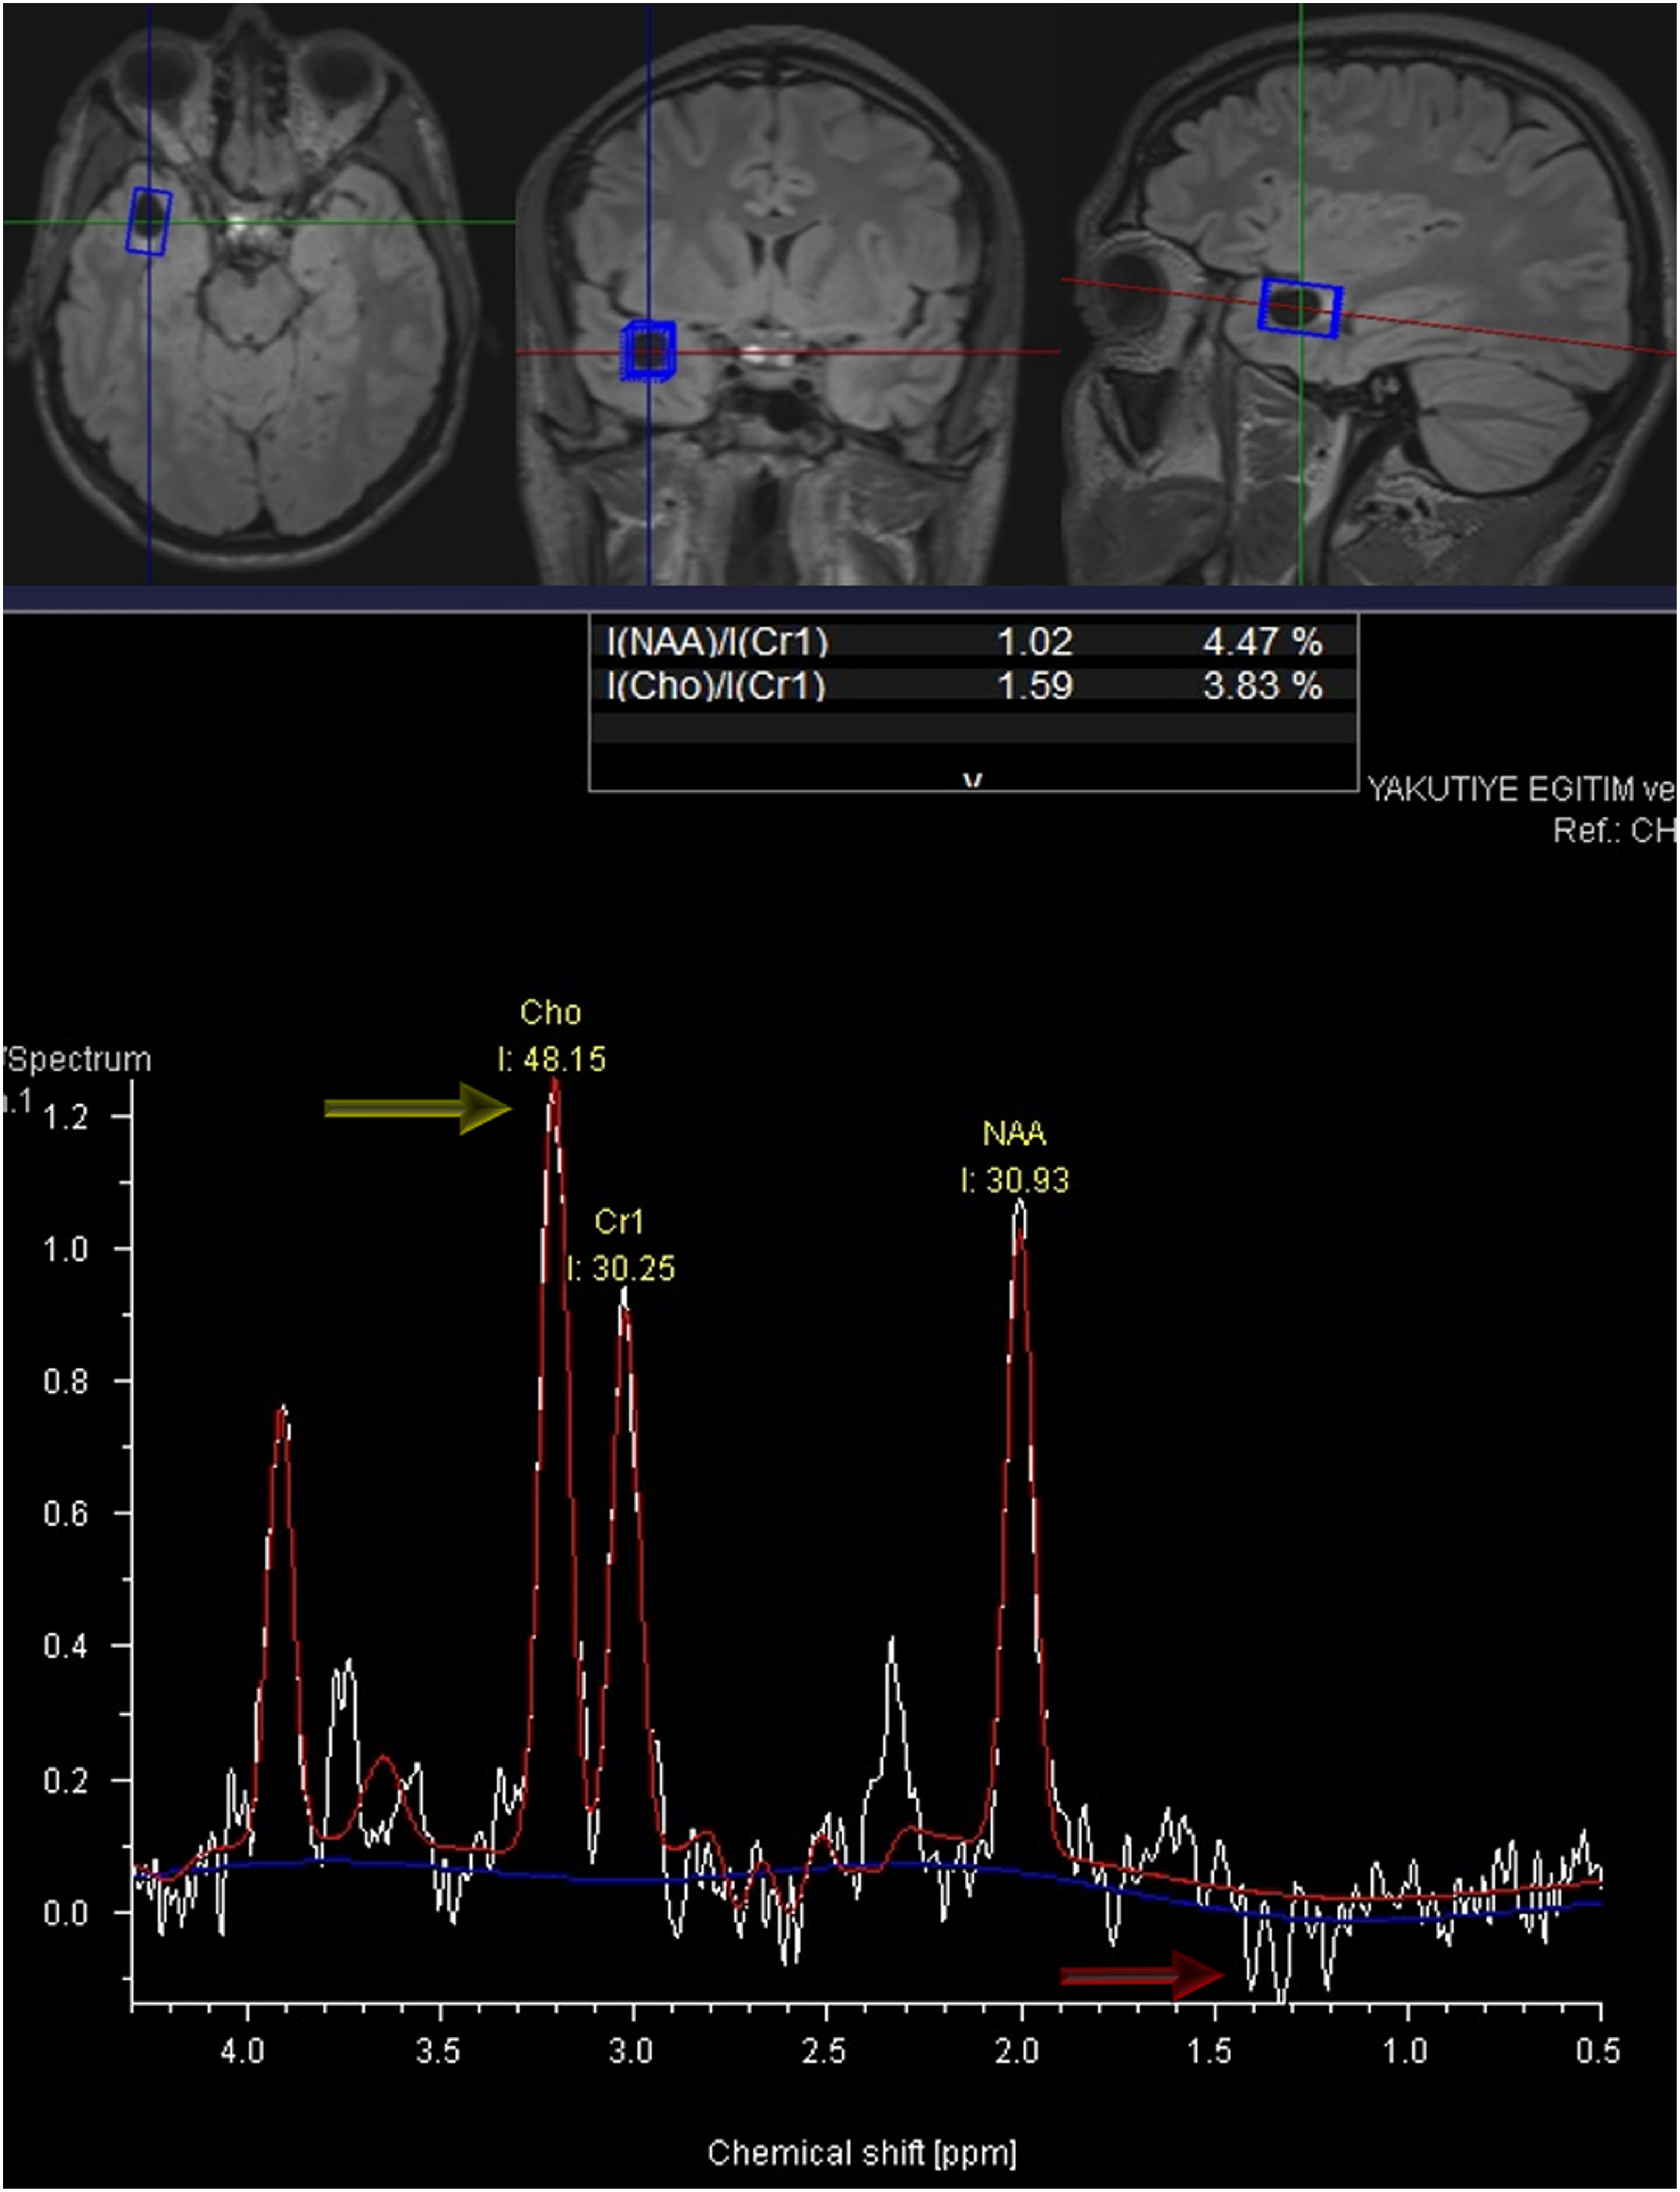
MR spectroscopy findings of the right temporal giant perivascular space. Single-voxel MR spectroscopy shows minimal choline elevation (yellow arrow) with a double reverse lactate peak (red arrow). MR, magnetic resonance; PVS, perivascular space.
Positive SWI, PWI, MRS, and DTI findings of patients.

*positive case number/total case number for each advanced MRI technique.
DTI, diffusion tensor imaging; MRS, magnetic resonance spectroscopy; PWI, perfusion-weighted imaging; SWI, susceptibility-weighted imaging.
In the statistical analysis performed, no significant difference was found between the group with perforating vessels in TOF angiography and the group not seen in terms of age (P = 0.758), size (P = 0.342), or sex (P = 0.459). In addition, no significant difference was found between the group with septation in the lesion and the group without it in terms of age (P = 0.838) and sex (P = 0.537). However, the mean size of the group with septation (36.8 ± 14.8) was significantly higher than the average size of the group without septation (19 ± 4.5) (P < 0.001).
Discussion
We have described some reliable diagnostic findings in giant tumefactive PVSs with advanced neuro MRI sequences in 3-T MR. These findings can contribute to the correct diagnosis of giant tumefactive PVSs and can prevent misdiagnosis and unnecessary intervention.
MRI characteristics of giant PVSs have been described In only one large series article and many case reports (4,7,8–10). In an MRi study performed by Salzman et al. (9), the authors reported a series of 37 patients with giant tumefactive PVSs. They detected that the most common location of giant tumefactive PVSs was the midbrain and mesencephalothalamic region. The authors also reported that mesencephalothalamic giant PVSs were frequently associated with obstructive-type hydrocephalus. Most of their patients had multiple clustered variably sized cysts. Salzman et al. (9) performed conventional MR sequences for all patients with giant PVSs. While contrast-enhanced MR images were obtained for almost all of the patients, DWI scans were obtained for a very small proportion of patients. No patients had advanced neuro MRI techniques or 3D volumetric thin section modern imaging sequences. They reported that all tumefactive PVSs were isointense relative to CSF intensity on all MR pulse sequences, and no patients had contrast enhancement or restricted diffusion. In our series, the most common location of giant tumefactive PVSs was the white matter of the temporal lobe (37.5%). There was obstructive hydrocephalus in only two patients. In half of the patients, cysts had multiple septations. Similar to the literature, our study showed that giant tumefactive PVSs have imaging features isointense to CSF at all pulse sequences of MRI in all patients. Unlike the results of Salzman et al. (9), we found that 42% of our patients had septal and peripheral contrast enhancement in the postcontrast 3D T1 MPRAGE sequence. Because almost all case reports in the literature have presented that giant PVSs are non-enhancing lesions, our results may be surprising to readers. Since 2010, we have routinely performed the 3D T1 MPRAGE sequence in addition to conventional cerebral MR sequences in postcontrast MR examinations. This sequence allows multiplane reformat images with a slice thickness of 1.25 mm and enables a higher in-plane resolution than conventional cranial MR sequences. We assert that since we performed a thin section 3D T1 MPRAGE sequence for postgadolinium examinations, we could show the presence of contrast enhancement in giant PVSs.
Increased T2 signal intensity adjacent to giant tumefactive PVSs has been reported in previous MRI studies (9,14). This finding can imitate peripheral vasogenic edema due to mass effects. In fact, it may represent chronic ischemic change associated with a space-occupying lesion or may be associated with mechanical stress secondary to increased arteriolar pressure. Salzman et al. (9) reported increased T2 or FLAIR signal intensities adjacent to giant tumefactive PVSs in half of their patients. In contrast, we observed signal intensity abnormalities around the lesion on T2W or FLAIR images in 83.3% of our patients. This high rate in our study may be explained by the fact that we performed high-resolution volumetric T2 SPACE sequencing using a 3-T MR scanner in all patients or could be just due to having a different cohort compared to the previous study in the literature.
In an old study, Awad et al. (15) investigated incidental subcortical lesions identified on MRI in an elderly population and postmortem pathological findings of these lesions. The authors described that subcortical lesions on 1.5-T MR scanner were associated with arteriosclerosis, dilated PVSs, and vascular ectasia. These results explain that a possible etiology of dilated PVSs in the elderly is spiral elongation of the penetrating cerebral vessels. In the literature, MRI studies have successfully shown the presence of penetrating vessels in giant tumefactive PVSs (9,14). However, to our knowledge, no MRI study demonstrating elongation or tortuosity of the penetrating vessels into giant tumefactive PVSs has been previously reported in the literature.
3D TOF MR angiography has been used successfully for visualization of cerebral arterial anatomy in clinical practice (16). This technique is a non-invasive method and provides high-resolution images. 3D TOF MR angiography obtained after administration of the gadolinium-based contrast agent has been performed to evaluate cerebral vascular pathologies (14,16). In an MR angiography study, the investigators reported that contrast-enhanced 3D TOF MR angiography significantly improved the visualization of cerebral venous structure (17). In a small number of our patients, we performed gadolinium-enhanced 3D TOF MR angiography to demonstrate its diagnostic contribution to giant PVSs. While non-contrast TOF MR angiography demonstrates venous or arterial perforating structures in the center of giant PVs, we were able to describe by solely gadolinium-enhanced 3D TOF MR angiography the dilated and tortious venous structures within giant PVSs. A last article presented a saccular aneurysm of the communicant segment of the left internal carotid artery in a giant PVS (18). This was the first case report of cerebral aneurysm within a giant PVS. In our series, because collaterals or vascular dilatations within giant PVS were not visualized in precontrast 3D TOF MR images, we thought that they have venous origin.
To our knowledge, perfusion MRI features of giant tumefactive PVSs have not yet been reported in the literature. We described the “central hyperperfusion sign” in 50% of the patients who underwent perfusion MRI. This finding can be associated with vascular congestion or elongation within giant tumefactive PVSs and can contribute to correct diagnosis in difficult cases.
There can be a visible dilatation of PVSs due to cerebral amyloid angiopathy. In a last case report, Datta et al. (19) performed a SWI sequence in a patient fulfilling the modified Boston criteria for cerebral amyloid angiopathy. The authors showed multiple cerebral microbleeds associated with dilated type 2 PVSs in SWI. We described the “septal linear blooming artifact” in 40% of the patients who underwent SWI MR sequencing. This artifact may be associated with recurrent intracystic microhemorrhages.
Proton MR spectroscopy was performed to characterize giant PVSs in only a few cases in the published literature (20–23). In two pediatric patients who underwent MR spectroscopy in the literature, MR spectroscopy demonstrated normal metabolite distribution without choline increase and lactate peaks in the cerebral hemispheric and cerebellar giant PVSs (20,21). On the other hand, Mascalchi et al. (23) reported proton MR spectroscopy features of two mesencephalic giant PVSs. The authors demonstrated an increase in lactate with normal peaks of NAA, Cr, and Cho in both cases. In another case report, Papayannis et al. (22) showed a slight increase in Cho with no lactate in proton MR spectroscopy of mesencephalothalamic giant PVS. The authors claimed that the increased Cho peak could be due to demyelination or edema surrounding the giant PVS. They also asserted that this finding can be used to differentiate giant PVSs from parasitic cysts and cystic tumors. We described abnormal spectral findings (increased Cho peak in 18.2%, increased lactate peak in 27.3%, and increased both lactate and Cho peaks in 9% of the patients) in 54% of the patients for whom we had MR spectroscopy data. Our results were in agreement with the MR spectroscopy literature.
A small number of DTI findings in giant PVSs have been reported in previous literature (24–29). In three case reports published in the literature, the authors reported that DTI showed displacement and distortion of fiber tracks adjacent to giant PVSs (24,25,27). In the other three case reports, DTI demonstrated a decrease in white matter fibers in the pathologic areas and deformation of fiber tracks adjacent to the giant PVSs. Our findings were similar to the DTI features described in the literature. We described “fiber distortion” in 71.4% of the patients who underwent DTI sequencing.
The present study has some limitations. The retrospective design was the main limitation. Co-morbidities or associated clinical features of patients were obtained from indications for MRI and patient records. The lack of histopathologic correlations for all patients is also one obvious weakness of this study. We had histopathologic confirmation for giant PVS in only two patients.
In conclusion, giant tumefactive PVSs can occasionally imitate other cystic lesions, such as cystic neoplasms or parasitic cysts. In this instance, advanced MRI techniques (such as perfusion MR, SWI, MR spectroscopy, and DTI) and 3D volumetric high-resolution MRI sequences (such as T2W SPACE and contrast-enhanced 3D TOF MR angiography) can provide a valuable contribution to the diagnosis and can be successfully used in the management of these lesions.
Footnotes
Declaration of conflicting interests
The author(s) declared no potential conflicts of interest with respect to the research, authorship, and/or publication of this article.
Funding
The author(s) received no financial support for the research, authorship, and/or publication of this article.
