




Abstract
Background
The pathogenesis and related factors of central nervous system abnormality in patients with type 2 diabetes mellitus (T2DM) have always been the focus of clinical research.
Purpose
To compare and analyze the area of white matter (WM) damage in patients with T2DM based on their level of hemoglobin A1C (HBA1c) and discuss any related factors.
Material and Methods
Based on their levels of HBA1c, 87 patients with T2DM were divided into three groups (Group B, C, or D), of which 29 non-diabetic volunteers served as the control group (Group A). DTI data analysis was based on tract-based spatial statistics (TBSS). The obtained parameters were compared among each group and the relevant clinical factors were analyzed.
Results
For age, sex, mini-mental state examination (MMSE), and Montreal Cognitive Assessment (MoCA) scores, there were no statistically significant differences among groups. For fractional anisotropy (FA) and radial diffusivity (RD) of WM, there were statistically significant differences (P < 0.05, two-tailed, FWE corrected) in the local area of corpus callosum, corona radiate, superior longitudinal fasciculus, etc. Most of these were significantly correlated with body mass index (BMI), left systolic blood pressure (SBP_L), and β2 microglobulin.
Conclusion
Before the cognitive function was obviously impaired, abnormalities of FA and RD had been found in the corpus callosum, corona radiate, and upper fasciculus in patients with T2DM, which suggested that the damage mainly occurred in the myelin sheath of WM and may be related to systemic vascular damage.
Keywords
Introduction
The worldwide incidence of type 2 diabetes mellitus (T2DM) is very high and continues to grow rapidly, accounting for 9.1% of the adult population, which has aroused wide concern globally (1). Although T2DM is different from Alzheimer's disease (AD) in its pathological mechanism, it also has a higher risk of cognitive impairment, and a large amount of evidence indicates that it may be related to vascular pathogenesis (2). At the same time, the incidence and mortality of stroke in patients with T2DM are also significantly increased (3). Therefore, the pathogenesis and related factors of central nervous system abnormality caused by T2DM have always been the focus of clinical and research. As an important part of the central nervous system, white matter (WM) is an important pathway connecting various functional structures of the brain. The correct interpretation of WM abnormalities has become one of the key problems in the pathogenesis of T2DM central nervous system (4). Diffusion tensor imaging (DTI) is the non-invasive imaging method that can show the integrity and functional connection of nerve fibers in vivo, and can be used to study quantitatively the damage degree of WM fibers (5). Trace-based spatial statistics (TBSS) is the most stable and mature quantitative analysis technique of DTI data at present (6). Hemoglobin A1C (HBA1c) is a commonly used clinical parameter to evaluate whether blood glucose is well controlled (7). At present, there are few studies evaluating WM changes in T2DM using TBSS, and HBA1c is not used as a grouping basis in any of them (8). The aim of the present study was to compare and analyze areas of WM damage in patients with T2DM, grouped by level of HBA1c, and then explore their related factors.
Material and Methods
General information
From December 2019 to August 2020, 87 patients with T2DM (61 men, 26 women; mean age = 59.59 ± 9.35 years) and 29 non-diabetic volunteers (20 men, 9 women; mean age = 59.79 ± 9.12 years) were included.
Inclusion criteria were as follows: (i) all individuals were right-handed; (ii) all patients with T2DM met the American Diabetes Association's criteria for clinical diagnosis of diabetes; and (iii) none of the non-diabetic volunteers had a family history of diabetes and fasting blood glucose was <6.1 mmol/L, and HBA1c was <6.0% (42 mmol/mol). The study was approved by the medical ethics committee. We complied with the patient consent guidelines and obtained informed consent from all participants.
Exclusion criteria were as follows: (i) traumatic brain injury, craniocerebral surgery, cerebral infarction, cerebral hemorrhage, brain tumor, or other neurological and psychiatric diseases that are not related to diabetes; (ii) non-diabetic macrovascular disease, malignant tumor, or other systemic multisystem disease; (iii) contraindications to magnetic resonance imaging (MRI) examination; (iv) pregnant and lactating women; and (v) unable to cooperate in collecting complete research data.
Group setting of participants
Based on their levels of HBA1C, 87 patients with T2DM were divided into three groups (Group B, C, or D), of which 29 non-diabetic volunteers served as the control group (Group A). The level of HBA1c was used as the basis for grouping diabetics. Group B was <7%, Group D was ≥8%, and group C was between the two groups.
Examination equipment and scanning parameters
Images were acquired on a 3.0-T MRI system (SIGNA Pioneer; General Electric, Milwaukee, WI, USA) equipped with a 29-element DST Head Neck Unit coil. Tight but comfortable foam padding was used to minimize head motion, and earplugs were used to reduce scanner noise. T2-weighted (T2W) images were collected using fast spin echo sequence (TR = 3400 ms, TE = 85 ms, flip angle = 90°, field of view [FOV] = 256 × 256 mm, matrix = 256 × 256, layer thickness = 3 mm, interval = 1 mm. T1-weighted (T1W) imaging adopted the BRAVO sequence (TR/TE/TI = 8.15/3.17/450 ms, number of excitations [NEX] = 1, flip angle = 12°, FOV = 256 × 256 mm, matrix = 256 × 256, layer thickness = 1 mm (without gap), layer number = 188. DTI scanning parameters were as follows: TR/TE = 8000/102 ms; FOV = 256×256 mm; matrix = 128 × 128; layer thickness = 3 mm; layer spacing = 0 mm; layer number = 48; B value = 1000 s/mm2; and 64 dispersion gradient directions.
Data processing
Fazekas scores were used to assess WM lesions on T2W imaging (9). Periventricular hyperintensity (PVH) was graded as follows: 0 = absence; 1 = “caps” or pencil-thin lining; 2 = smooth “halo”; and 3 = irregular PVH extending into the deep WM. Separate deep white matter hyperintensities (DWMH) signals were rated as follows: 0 = absence; 1 = punctate foci; 2 = beginning confluence of foci; and 3 = large confluent areas.
DTI data analysis was based on tract-based spatial statistics (TBSS) (10), and the main parameters included fractional anisotropy (FA), axial diffusivity (AD), radial diffusivity (RD), and mean diffusivity (MD). DTI data were preprocessed according to the pipelines of the FMRIB's Diffusion Toolbox (FDT) implemented in FSL 5.0.10 (FDT tool, FSL 5.0.10, http://www.fmrib.ox.ac.uk). First, the synb0-Disco Program with volumetric T1 image was used to correct the image (11). Then, brain tissue was extracted using brain extract toolbox (version 2.1). The diffusion tensor was fitted using a linear least square algorithm and eigenvalues were decomposed from the tensor to calculate diffusion metrics of the FA, AD, RD, and MD (12).
The FA images of all individuals were aligned to a template of averaged FA images (FMRIB-58) in the Montreal Neurological Institute (MNI) space using a non-linear registration algorithm implemented in FNIRT (FMRIB's Non-linear Registration Tool). After transforming into the MNI space, a mean FA image was created and thinned to generate a mean FA skeleton of the WM tracts. The FA image of each individual was then projected onto the skeleton via filling the mean FA skeleton with FA values from the nearest relevant tract center by searching perpendicular to the local skeleton structure for maximum FA value. The registration and projection information derived from the FA analysis were then applied to the other three parametric images (AD, RD, and MD) of each individual to ensure an exact spatial correspondence of the different parameters.
To facilitate visualization, results were thickened using the tbss_fill script implemented in FSL. Referring to the Johns Hopkins University ICBM-DTI-81 White-Matter Labels provided in the FSL toolbox, fiber tracts corresponding to the clusters were identified. Using the standard template of JHU-ICBM-labels for WM fiber tracts, the parameter values of each diffusion tensor in the differential brain area were extracted.
Statistical analysis
The clinical data and DTI data of these four groups were compared and analyzed correlatively. All quantitative values are presented as the mean ± standard deviation (SD). Analysis of variance (ANOVA) was used to test the parameters among multiple groups, followed by the LSD test (Adjusted Tamhane t-test was made if there is heterogeneity of variance of interclass) for multiple comparisons. The Kruskal–Wallis H test was used for the multi-group comparison of non-parametric tests. Pearson correlation analysis was used to evaluate the diffusion tensor indicators and quantitative clinical parameters in the brain regions with differences between groups, and Spearman correlation analysis was used to evaluate the correlation between them and qualitative clinical parameters. The above data were analyzed using the SPSS 19.0 C (SPSS Inc., Chicago, IL, USA) statistical software package. P < 0.05 indicated that differences were statistically significant.
Voxel-wise statistical analysis across individuals on the skeleton space was carried out using a permutation-based inference tool for nonparametric statistic (“randomize,” part of FSL). Comparisons between groups were performed using the F test in the general linear model, with age and gender as unrelated covariables. The mean FA skeleton was used as a mask, and the number of permutations was set to 5000. To simultaneously control for both type I and type II errors, the significance threshold was determined to be a P < 0.05 (two-tailed) after correcting the family-wise error (FWE) using the threshold-free cluster enhancement (TFCE) option in FSL (13). After using post hoc Bonferroni correction, the t-test in the general linear model was carried out between each pair of groups, and the WM regions with differences between each group were then extracted by the above processes and displayed.
Results
Comparison and correlation analysis of clinical characteristic parameters
We selected 25 clinical characteristic parameters that may be associated with T2DM, including Mini-Mental State Examination (MMSE) and Montreal Cognitive Assessment (MoCA) scores, and were compared between groups (
Comparison of clinical characteristic parameters of diabetes mellitus between groups.
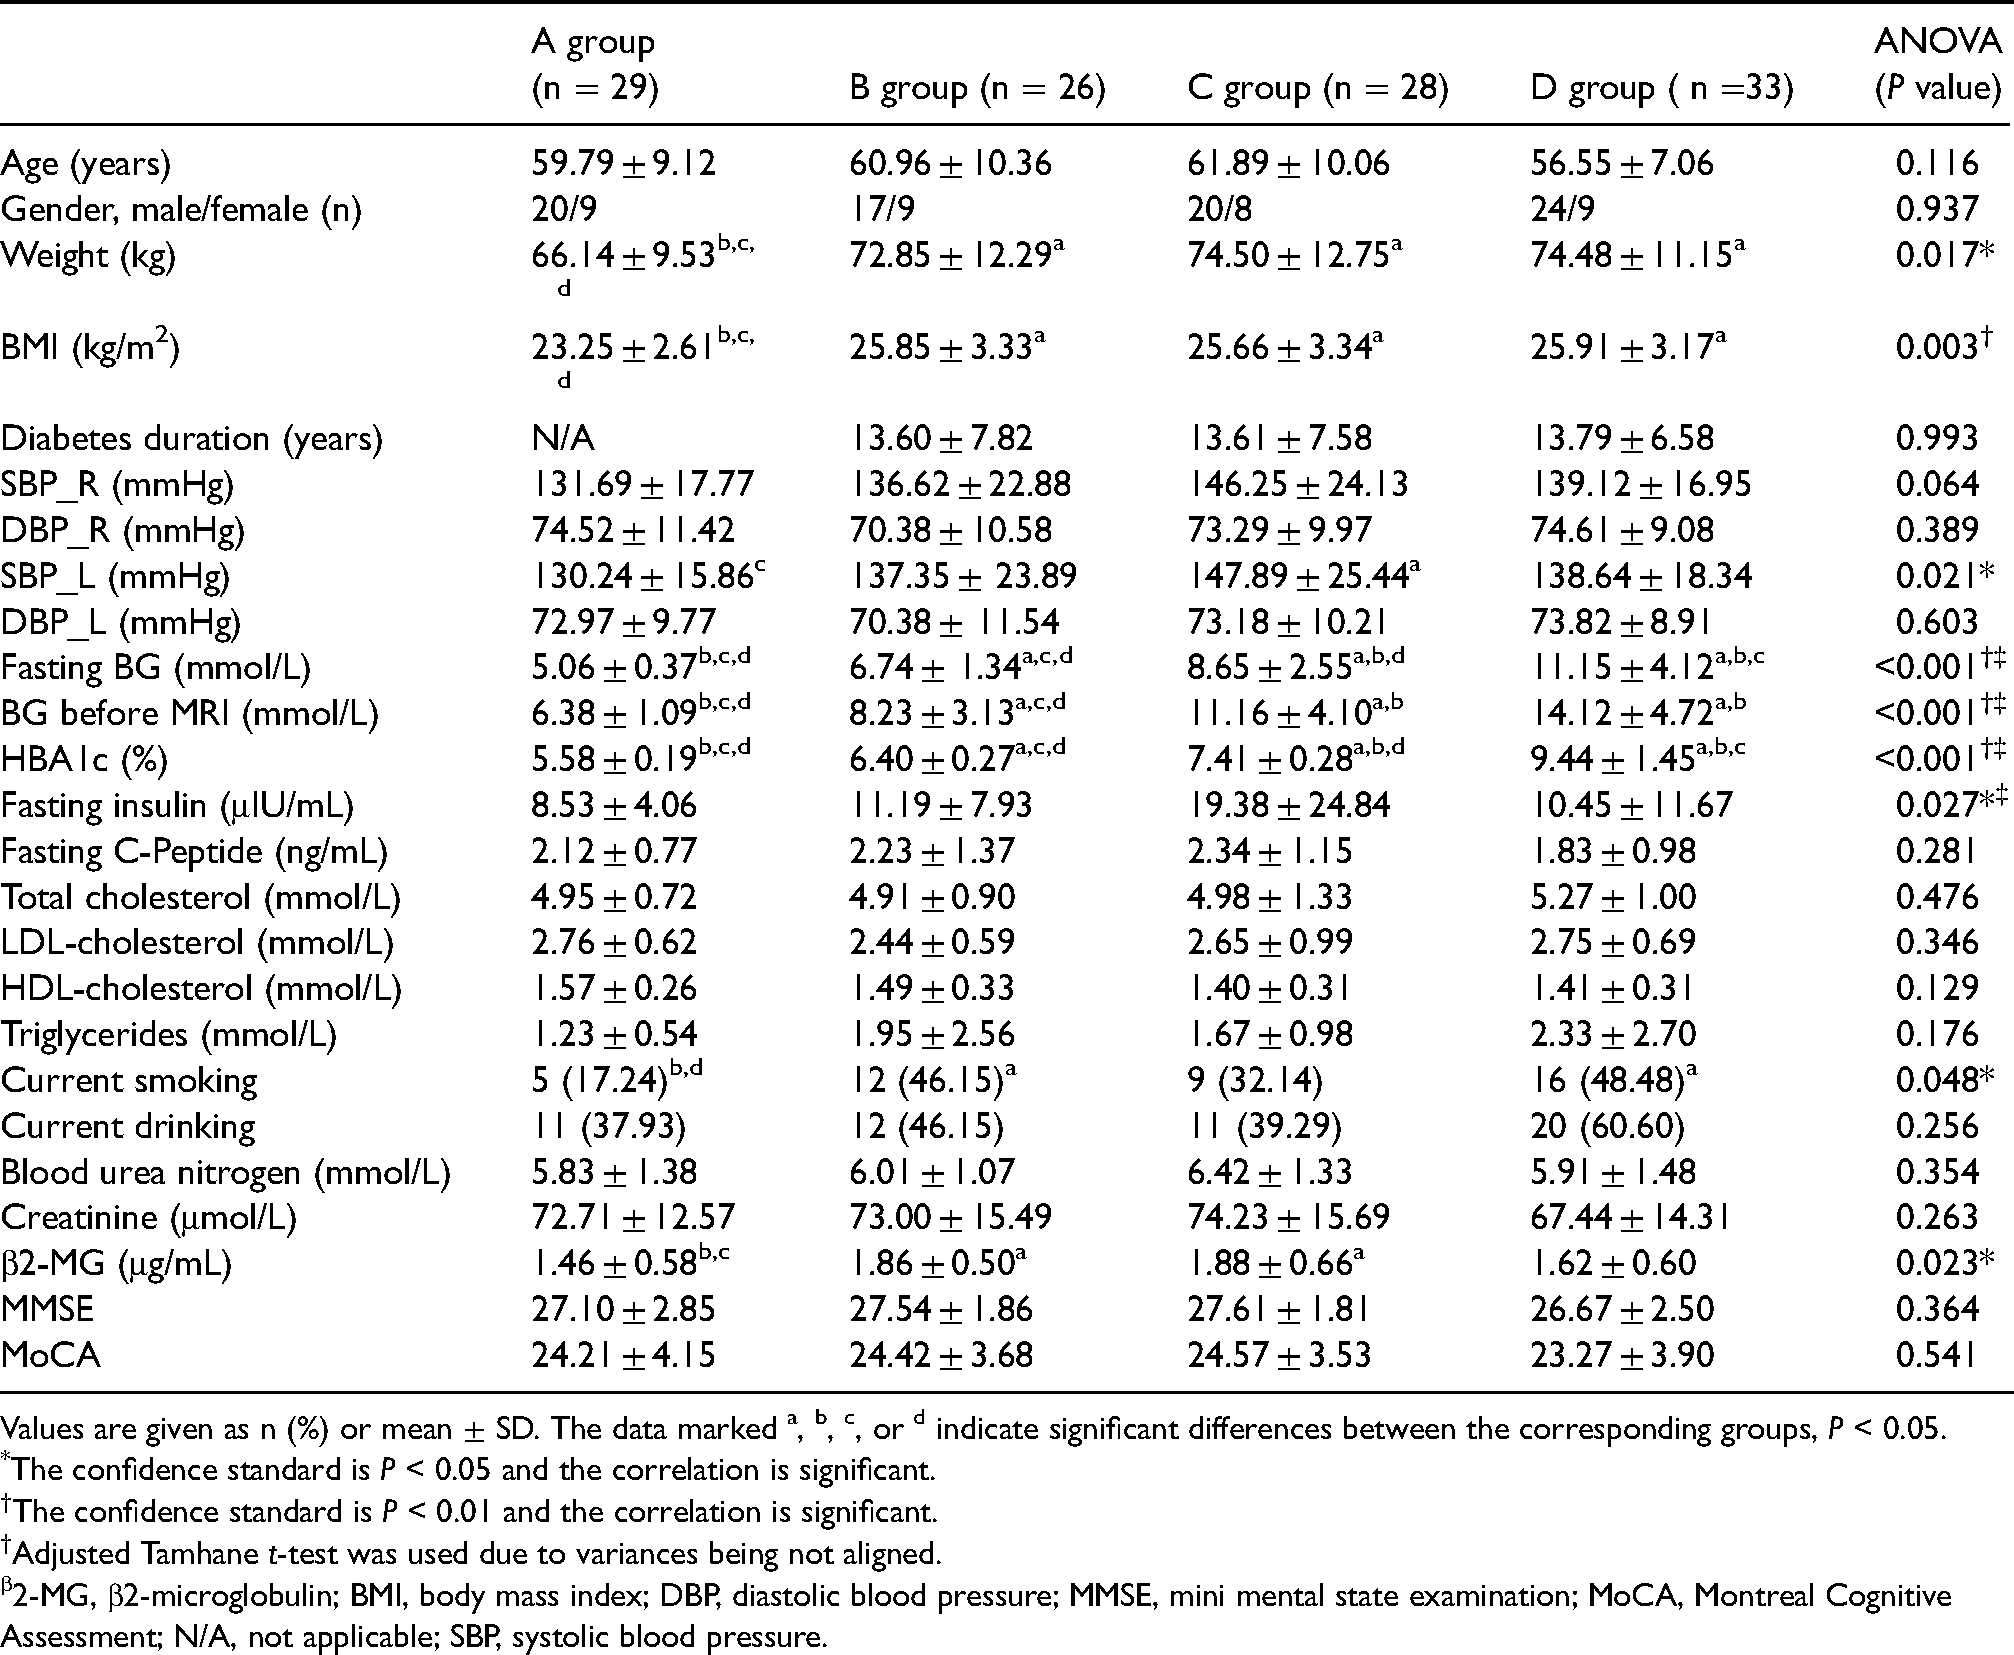
Values are given as n (%) or mean ± SD. The data marked a, b, c, or d indicate significant differences between the corresponding groups, P < 0.05.
The confidence standard is P < 0.05 and the correlation is significant.
The confidence standard is P < 0.01 and the correlation is significant.
Adjusted Tamhane t-test was used due to variances being not aligned.
2-MG, β2-microglobulin; BMI, body mass index; DBP, diastolic blood pressure; MMSE, mini mental state examination; MoCA, Montreal Cognitive Assessment; N/A, not applicable; SBP, systolic blood pressure.
Correlation analysis between clinical characteristic parameters.

“r” is the correlation coefficient.
Spearman non-parametric test.
The confidence standard is P < 0.01 and the correlation is significant.
The confidence standard is P < 0.05 and the correlation is significant.
2-MG, β2-microglobulin; BG, blood glucose; BMI, body mass index; N/A, not applicable; SBP, systolic blood pressure.
Comparison and correlation analysis of white matter parameters
Fazekas scores were used to assess WM lesions on T2W imaging, and there was no significant difference among groups (
Fazekas scores of white matter were compared and analyzed among each group.

Values are given as n. Kruskal–Wallis was adopted to compare analysis among groups, and the confidence standard is P < 0.05 (X2 = 4.127; P = 0.248).
After TBSS analysis of DTI images, some major parameters showed significant differences among groups in the WM regions (

After using post hoc Bonferroni correction, t-tests were used to compare FA values between each pair of groups: A-B means group A is greater than group B, A-C means group A is greater than group C, A-D means group A is greater than group D, C-B means group C is greater than group B, and D-B means group D is greater than group B. These positive white matter areas are shown as red-yellow. Below the image are the x, y, and z coordinates of the MIN template. FA, fractional anisotropy.

After using post hoc Bonferroni correction, t-tests were used to compare RD values between each pair of groups: B-A means group B is greater than group A, B-C means group B is greater than group C, B-D means group B is greater than group D, C-A means group C is greater than group A, and D-A means group D is greater than group A. These positive white matter areas are shown as red-yellow. Below the image are the x, y, and z coordinates of the MIN template. RD, radial diffusivity.
Index parameters of DTI were compared and analyzed among each group.
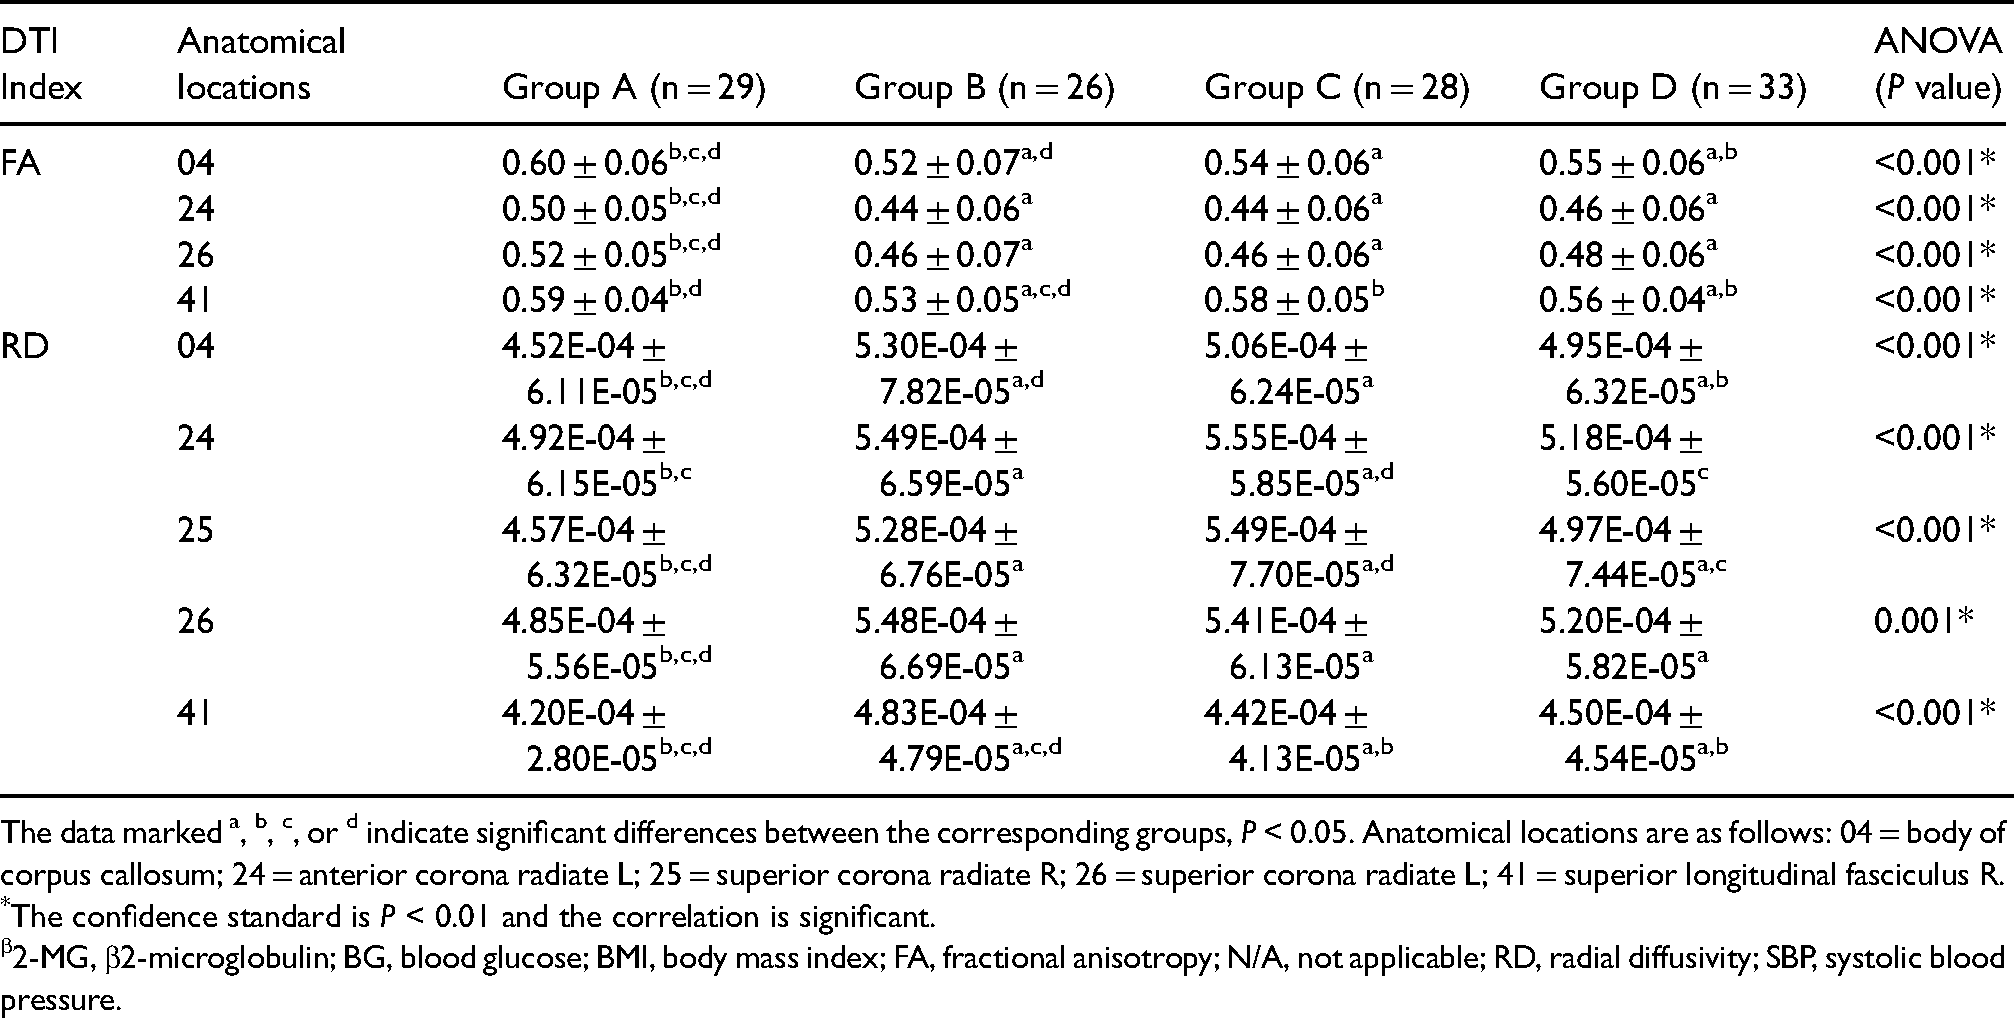
The data marked a, b, c, or d indicate significant differences between the corresponding groups, P < 0.05. Anatomical locations are as follows: 04 = body of corpus callosum; 24 = anterior corona radiate L; 25 = superior corona radiate R; 26 = superior corona radiate L; 41 = superior longitudinal fasciculus R.
The confidence standard is P < 0.01 and the correlation is significant.
2-MG, β2-microglobulin; BG, blood glucose; BMI, body mass index; FA, fractional anisotropy; N/A, not applicable; RD, radial diffusivity; SBP, systolic blood pressure.
Correlation analysis between index parameters of DTI and clinical characteristic parameters.

“r” is the correlation coefficient. Anatomical locations are as follows: 04 = body of corpus callosum; 24 = anterior corona radiate L; 25 = superior corona radiate R; 26 = superior corona radiate L; 41 = superior longitudinal fasciculus R.
Spearman non-parametric test.
The confidence standard is P < 0.05 and the correlation is significant.
The confidence standard is P < 0.01 and the correlation is significant.
2-MG, β2-microglobulin; BG, blood glucose; BMI, body mass index; FA, fractional anisotropy; N/A, not applicable; RD, radial diffusivity; SBP, systolic blood pressure.
The location and size of the different brain regions among groups.
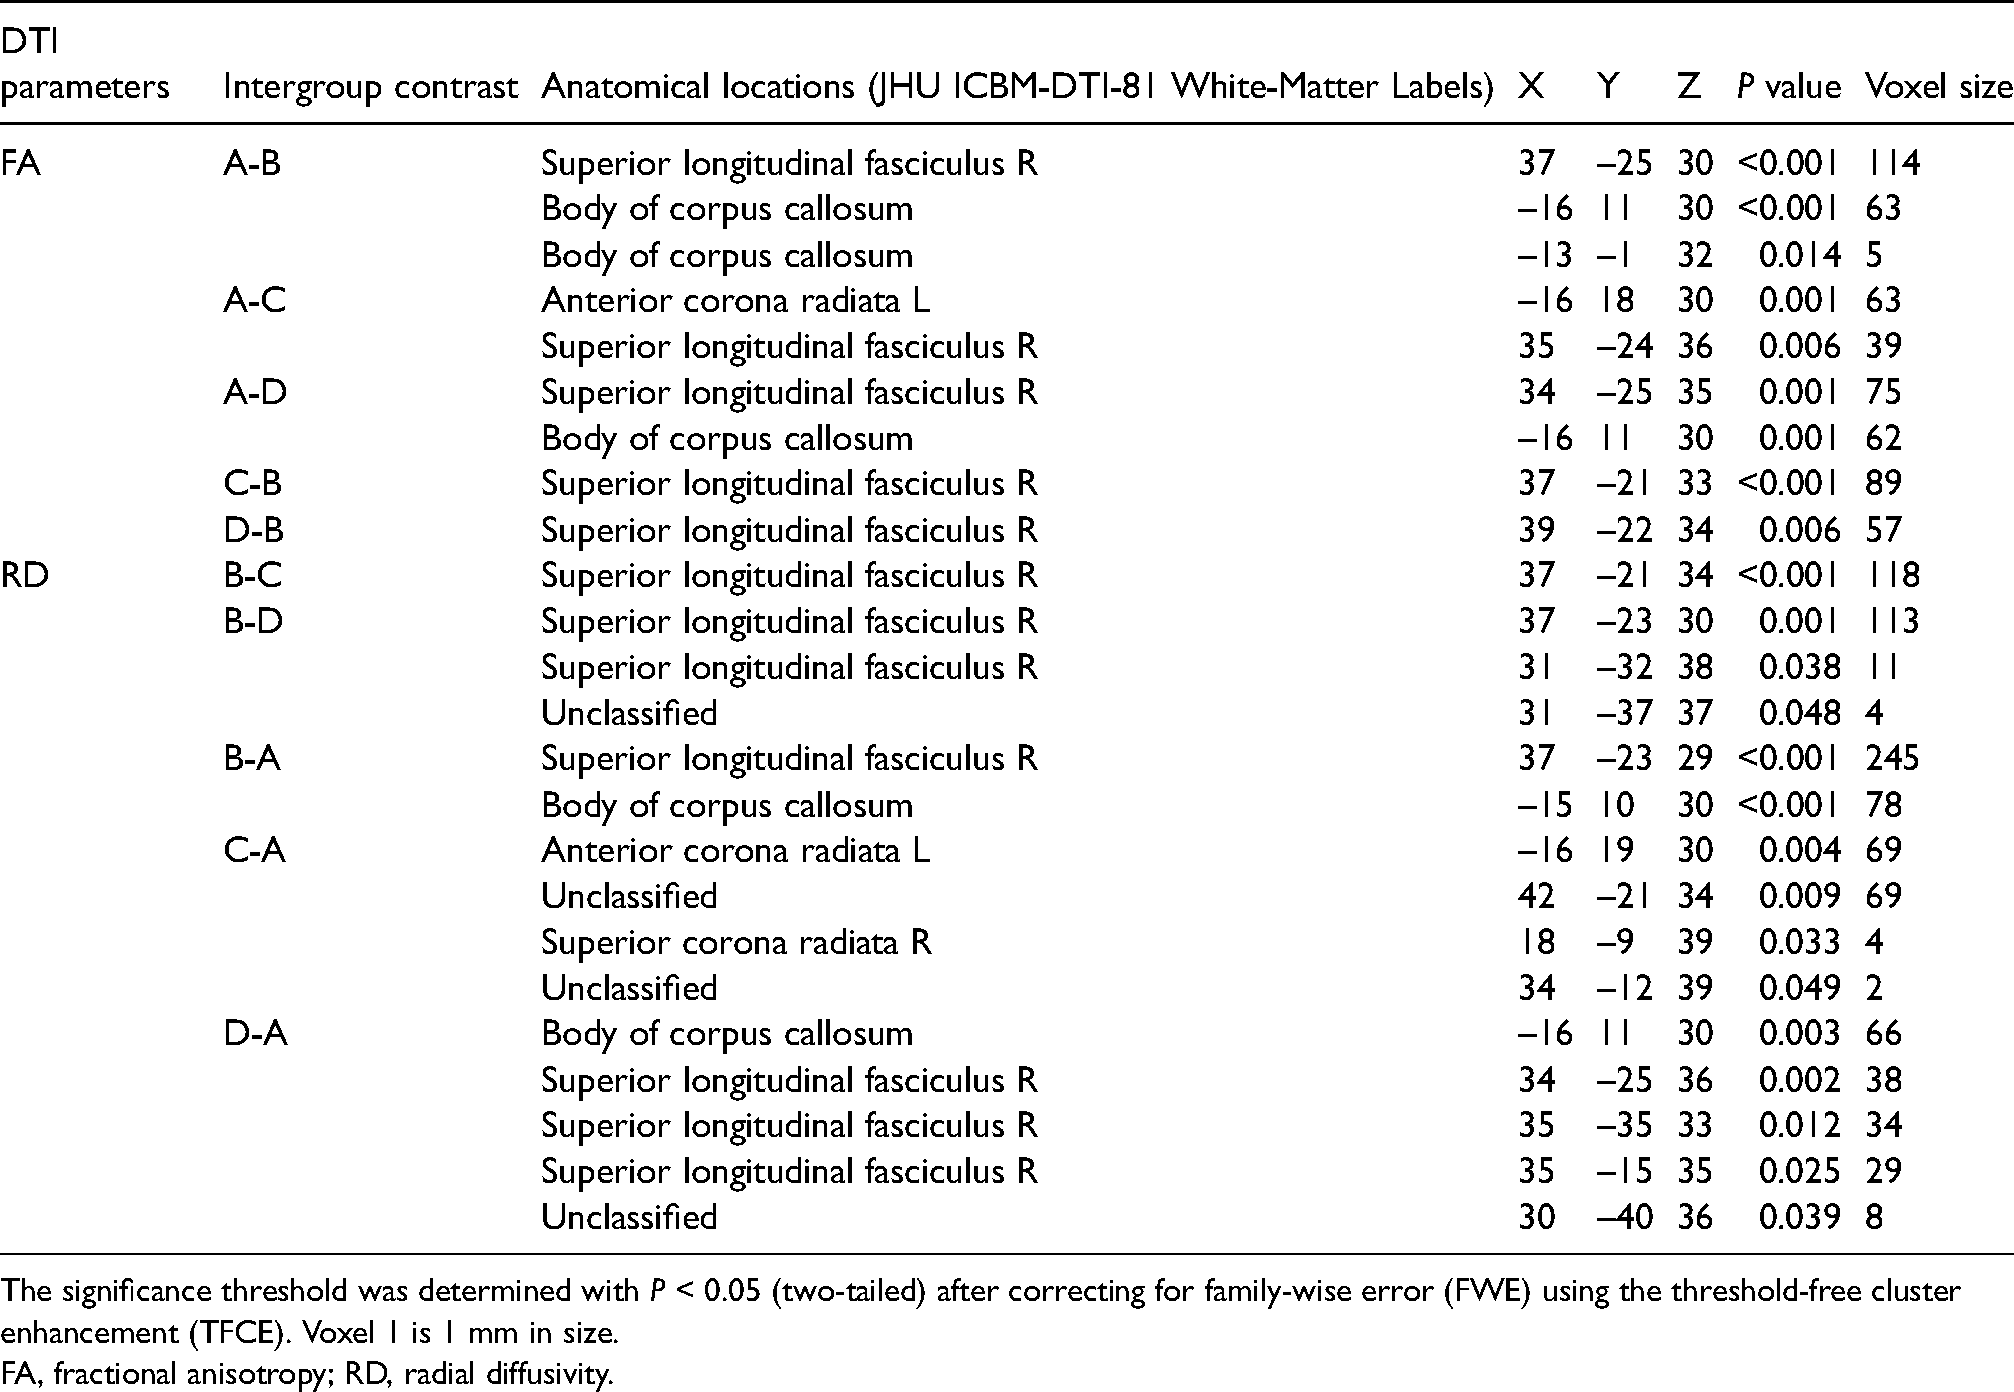
The significance threshold was determined with P < 0.05 (two-tailed) after correcting for family-wise error (FWE) using the threshold-free cluster enhancement (TFCE). Voxel 1 is 1 mm in size.
FA, fractional anisotropy; RD, radial diffusivity.
Discussion
T2DM is a common metabolic disease characterized by chronic hyperglycemia, which can lead to complications of multiple organ systems, and brain tissue is the target tissue of diabetic organ damage (14). The chronic damage of T2DM to the brain function of patients has been a highly concerned problem (15). As WM is an important part of the central nervous system, the correct interpretation of the pathogenesis of WM lesions in patients with T2DM has become one of the key issues (16,17). The WMH is considered a sign of the change of cerebral small vessel disease (CSVD), which is related to the disease of diabetic microvascular disease. Many studies have supported the expansion of WMH in patients with T2DM and insulin resistance, HBA1c and fasting insulin are significantly related to WMH (18). This study was based on the level of HBA1c, using Fazekas scores to evaluate the WM of the deep brain, and the difference among each group was not statistically significant. However, using the TBSS analysis method, the FA and RD values of WM in the corpus callosum, corona radiate, and superior longitudinal fascicles were found to be statistically significant among the groups, and were significantly correlated with BMI, SBP_L, and β2 microglobulin.
Glycosylated hemoglobin (GHb) is the combination of hemoglobin in red blood cells and sugars in serum (19). It is formed by slow continuous and irreversible saccharification. The amount depends on the blood sugar concentration and the contact time between blood sugar and hemoglobin and has no relation with the time of drawing blood, fasting status, insulin use, and other factors. Therefore, GHb can effectively reflect the average blood glucose level of patients with T2DM in the past 8–12 weeks. GHb is composed of HBA1a, HBA1b, and HBA1c, of which HBA1c accounts for about 70% and has a stable structure. Therefore, HBA1c has always been recognized as the core index for evaluating the treatment effect of T2DM (7,20). In clinical practice, HbA1c <7.0% (53 mmol/mol) is generally considered the control index for many non-pregnant adults with T2DM, but when patients with T2DM have a history of severe hypoglycemia or complications of vascular damage, the control index of HBA1c is relaxed to <8.0% (64 mmol/mol) (7). Therefore, in this study, the HBA1c levels of 7.0% (53 mmol/mol) and 8.0% (64 mmol/mol) were used as the boundary values for grouping diabetics, respectively.
A comparison of 25 clinical characteristic parameters that may be related to T2DM was conducted among each group. The results showed that, except for two indicators of blood glucose, some indicators showed significant differences between the T2DM groups and the non-diabetic control group, but no significant differences between the T2DM groups. In the correlation analysis, in addition to the two indicators of blood glucose, HBA1c was also correlated with weight, BMI, and SBP_L. Although the correlation between β2-BG and HBA1c was not obvious, it was correlated with BMI and SBP_L, respectively. In the study, some obvious abnormal areas of WM were found in patients with T2DM compared with those without diabetes, but few were found between the T2DM groups. FA and RD values of WM regions with differences between groups were extracted, most of which were not significantly correlated with HBA1c, but were significantly correlated with BMI, SBP_L, andβ2-BG. There were no significant correlations between these parameters and other blood glucose indicators (fasting BG and BG before MRI) and fasting insulin, respectively. First, an increase in BMI often indicates abnormal lipid metabolism, increasing the risk of atherosclerosis (21). Second, the increase of blood pressure is closely related to the vascular damage caused by arteriosclerosis (22). In addition, β2-BG is an independent risk factor associated with the severity of peripheral artery disease (PAD) (23,24). All these abnormalities indicated that patients with T2DM have developed vascular damage complications to a certain extent. Therefore, the main cause of the damage of T2DM WM may be the damage of vascular system, rather than the direct cause of hyperglycemia. There is evidence that microvascular dysfunction is one of the key underlying mechanisms that is common in T2DM and began before the onset of T2DM (25). Microvessels are involved in the regulation of many brain functions and are mainly driven by a combination of factors such as high blood sugar, obesity, insulin resistance, and hypertension (26,27). A growing body of research has confirmed that diabetes-related microvascular dysfunction is associated with a higher risk of stroke, cognitive dysfunction, and depression. The prognosis of T2DM brain changes can be improved by treating T2DM disruption of microcirculation (15).
DTI is a highly sensitive, non-invasive magnetic resonance imaging technique that detects abnormalities in the microstructure of WM (28). FA is the most commonly used parameter for anisotropy analysis. Abnormal FA values in cerebral WM usually indicate changes in myelin integrity, nerve fiber density, and consistency of travel, but the specificity of distinguishing different pathological changes is not high (29). MD reflects the overall situation of molecular dispersion level and resistance. MD only indicates the size of the diffusion and is independent for the direction of diffusion. The abnormality of MD generally indicates the enlargement of the pericellular space (30). Abnormal AD indicates possible axonal damage of nerve fibers, and abnormal RD indicates possible demyelination changes (31,32). According to literature reports, the areas of WM lesions in patients with T2DM are mainly in the corpus callosum, radiative corona, cingulate gyrus, supoccipital frontal tract, and visual radiation, with the decrease of FA and the increase of AD, RD, and MD (8). In the results of this study, abnormal WM regions were found in the FA and RD parametric images, with similar locations and sizes. No obvious abnormalities were found in the WM regions of the AD and MD images. Therefore, FA and RD are sensitive to the abnormal change of WM in diabetic patients, and the change of WM was only demyelinating change, but the change of neuraxons was not obvious.
The damage of T2DM to cognitive function of patients has been widely concerned, and elucidating its pathogenesis is still a major problem to be solved, which may be multifaceted (33). MMSE and MoCA are the two most commonly used methods to evaluate cognitive impairment in clinical or related studies (34,35). In order to ensure the accuracy of image registration, participants with a history of stroke or cerebrovascular lesions were excluded from this study, which may be the reason why there were no significant differences in MMSE and MoCA scores among the groups. Nevertheless, it was observed that MMSE and MoCA scores tended to decrease when HBA1c was >8.0% (64 mmol/mol). At the same time, it was found that the WM damage in patients with T2DM mainly occurred in the corpus callosum, corona radiate, and superior longitudinal fasciculus, which were all closely related to cognitive function. The corpus callosum (CC) connects hemispheres of the brain and plays an important role in their coordination. Different parts of CC are involved in different functions, among which the back part of CC is more involved in visual processing, while the front part is related to cognitive function (36). Corona radiata is made up of ascending and descending nerve fibers that transmit information to and from the cerebral cortex, which is closely related to the work of cognitive control and attention (37). Superior longitudinal fasciculus (SLF) is the main associated fiber pathway connecting the frontal, parietal, and temporal regions, and is closely related to core cognitive functions such as language, attention, memory, and visuospatial skills (38). It can be seen from the results of this study that when there is no obvious impairment of cognitive function, abnormalities have been found in the WM of the corpus callosum, corona radialis, and superior longitudinal fasciculus. Studies have shown that damage to the WM of the brain occurs in pre-diabetes but does not occur due to the compensatory effect of the brain tissue itself (4).
In conclusion, before the obvious impairment of cognitive ability, abnormalities of the WM of patients with T2DM were found, mainly located in the corpus callosum, corona radiata, and superior longitudinal fasciculus, which were closely related to cognitive function. These changes were mainly demyelination changes, but the axonal itself did not change significantly. In T2DM, the WM damage was not significantly associated with blood glucose indicators such as HBA1c, but was significantly correlated with BMI, SBP_L, andβ2-BG, which reflected that the main cause of the damage of T2DM WM may be the damage of vascular system, rather than the direct cause of hyperglycemia.
Footnotes
Acknowledgements
The authors thank the Medical Imaging Laboratory of Tianjin Medical University General Hospital for the technical support of image processing, and especially thank Quan Zhang and Qin Wen for her help in the research process. They also thank their radiology colleagues at at Huabei Petroleum General Hospital for their research efforts.
Declaration of conflicting interests
The author(s) declared no potential conflicts of interest with respect to the research, authorship, and/or publication of this article.
Funding
The author(s) received no financial support for the research, authorship and/or publication of this article.
