
Abstract
Background
Early identification of placental insufficiency can lead to appropriate treatment selections and can improve neonates' outcomes. Possible contributions of magnetic resonance imaging (MRI) have been suggested.
Purpose
To evaluate the prognostic capabilities of placental intravoxel incoherent motion (IVIM) parameters and T2-relaxation time, and their correlation with fetal growth and adverse outcomes, comparing umbilical artery (UmA) pulsatility index (PI).
Material and Methods
A total of 68 singleton pregnancies at 24–40 weeks of gestation underwent placental MRI and were reviewed retrospectively. UmA-PI was measured using Doppler ultrasound by obstetricians. IVIM parameters (Dfast, Dslow, and f) were calculated with a Bayesian model fitting. First, the associations between gestational age (GA) with placental IVIM parameters, T2-relaxation time, and placental thickness (PT) were evaluated. Second, IVIM parameters, T2 value (Z-score), PT (Z-score), and UmA-PI (Z-score) were compared between ( 1) those delivering small for gestational age (SGA) and appropriate for gestational age (AGA) neonates, ( 2) emergency cesarean section (ECS), and non-ECS, and ( 3) preterm birth and full-term birth.
Results
Low birth weight was observed in 15/68 cases (22%). GA was significantly associated only with T2-relaxation time and PT. SGA was significantly associated with T2 value (Z-score), f, and UmA-PI (Z-score). In the ECS groups, T2 value (Z-score), f, and Dfast were significantly lower than those in non-ECS groups. All IVIM parameters and T2 values (Z-score) showed significantly lower scores in the preterm birth group.
Conclusion
Placental f and T2 value (Z-score) had significant associations with low birth weight and clinical adverse outcomes and could be potential imaging biomarkers of placental insufficiency.
Keywords
Introduction
Placental insufficiency is closely associated with neonatal morbidity and mortality and might result in various clinical adverse outcomes such as fetal growth restriction (FGR), delivery of small for gestational age (SGA) neonates, preterm birth, and pre-eclampsia (1). Such conditions can elevate the risk of maternal and neonatal adverse outcomes (2). Early prenatal identification of placental insufficiency would lead to appropriate treatment selections including close monitoring, timely delivery, and prompt neonatal care (3).
Ultrasound (US) is the standard imaging modality of choice in evaluating in vivo placental health. Fetal hypoxemia has been known to be associated with increased umbilical artery (UmA) and middle cerebral artery (MCA) pulsatility index (PI) (4,5). These indexes are adopted as essential biomarkers for clinical management of fetal growth restriction as well as sonographic estimation of fetal weight (4). However, low reproducibility of these US measurements in the assessment of fetal weight is reported, especially for fetal weight of SGA fetuses (6,7).
Magnetic resonance imaging (MRI) has been an increasingly common clinical tool for in vivo placental structural and functional assessment, which is considered to be safe and tolerable for both the fetus and the mother (8,9). MRI obtains a larger field of view which is independent on maternal body habitus and placental implantation site. T2-relaxation time has been widely used for the assessment of placental condition including infarction, necrosis, and fibrosis (10,11). Recently, intravoxel incoherent motion (IVIM) MRI has been explored as a novel method for the evaluation of placental perfusion (12,13). Although some studies have demonstrated that FGR pregnancies exhibited low placental perfusion using IVIM MRI (14,15) and T2-relaxation time (10,11), few studies exist that reveal the associations between adverse outcomes of delivery and MRI parameters.
The objective of this study was to evaluate the feasibility of placental IVIM and T2-relaxation time in the prediction of low birth weight (BW) and adverse outcomes of delivery, by comparing with UmA-PI.
Material and Methods
Eligibility criteria and patients
Ethics approval for this retrospective study was granted by our institutional review board (#R-0383). The necessity for informed consent was waived.
The inclusion criteria were as follows: (i) fetal MRI exams, including IVIM and multi-echo spin echo (SE) T2-weighted (T2W) images for the measurement of T2-relaxation time, performed at our institution for any clinical purpose between February 2015 and November 2018; (ii) singleton pregnancy; and (iii) the outcome for the baby was available in the medical records after delivery at our institute. Exclusion criteria were abnormal fetal karyotype and apparent congenital malformations, such as congenital diaphragmatic hernia or gastroschisis.
Patient data
The medical records were reviewed by one of the authors (KN) with nine years of experience in genitourinary diagnostic radiology. Clinical data at the time of US, MRI, and delivery, which included GA, maternal age, fetal gender, BW, gravidity and parity, and the course and the outcome of the delivery, were collected. Low BW was defined by SD ≤ −1.5 (16). All the patients underwent routine US fetal examination by obstetricians, and UmA-PI was measured using Doppler ultrasound as part of our routine clinical practice.
ECS was performed when there was an immediate threat to the life of the fetus or mother during delivery, such as fetal or maternal distress or maternal hemorrhage, decided by the obstetrician. In the following evaluations, cases of unscheduled CS (e.g. due to weak uterine contractions or baby intolerance) were also included in the ECS group. Preterm birth was defined as any birth before 37 weeks completed weeks of gestation.
MR protocols
All examinations were performed using a 1.5-T MR unit (Avanto; Siemens Healthineers, Erlangen, Germany) with a phased array receiver coil. The patients were scanned in the supine position during the examination. The examinations were performed in the left lateral decubitus position if the patient could not tolerate lying down while facing upward. Our routine gynecological MRI protocol included multi-plane half-Fourier acquisition single-shot turbo spin (HASTE) images, T1-weighted (T1W) volumetric interpolated breath-hold examination (VIBE), diffusion-weighted imaging (DWI), multi-echo SE T2W imaging for the measurement of T2-relaxation time, and IVIM. The parameters were as follows: for HASTE, repetition time (TR)/echo time (TE) = 800/84 ms, field of view (FOV) = 320 mm, slice thickness = 4 mm, flip angle (FA) = 113°, and bandwidth 260 Hz/pixel; for VIBE, TR/TE = 4.35/1.67 ms, FOV = 260 mm, slice thickness = 4 mm, FA = 10°, and bandwidth = 360 Hz/pixel; for DWI, TR/TE = 3700/60 ms, FOV = 360 mm, slice thickness = 6 mm, diffusion direction = 3, and bandwidth = 2368 Hz/pixel. The b-values of DWI were 0, 100, 500, and 1000 s/mm2. The IVIM DWI was acquired using echo planar imaging and 11 b-values (b = 0, 30, 50, 80, 100, 150, 200, 300, 500, 800, and 1000 s/mm2). For multi-echo SE T2W imaging, TR = 400 ms, TE = 30, 60, 90, 120, 150, 180, 210, 240, 270, 300, 330 ms, FOV = 350 mm, slice thickness = 8 mm, and bandwidth = 2298 Hz/pixel. Multi-echo SE T2W imaging and IVIM were scanned at the three largest and contiguous slices of the placenta that did not include motion artifact by fetus , selected by a board-certified radiologist specializing in genitourinary imaging.
Data analysis and image analysis
The DICOM data of multi b-value DW images and multi-echo SE T2W images were transferred to a workstation. The MR images were processed using in-house scripts written in MATLAB (The MathWorks Inc., Natick, MA, USA) to calculate IVIM parameters (pseudo-diffusion coefficient [Dfast], diffusion coefficient [Dslow], and perfusion fraction [f]) and T2-relaxation times. IVIM parameters were calculated with a Bayesian model fitting, which is recommended for IVIM modeling in previously published studies (17–19). Region of interests (ROIs) were drawn by a single board-certified observer (KN) blinded to the complications of pregnancy and neonatal outcomes. IVIM and T2 measurements were calculated by averaging the values of all voxels in the ROIs in selected three slices. When the image orientations of two sequences were not identical, IVIM parameter maps were resliced to match the T2 map. Freehand ROIs were placed manually on slices to show the maximum cross-section of the placenta on the T2 map, and the same ROIs were applied for the IVIM parameter maps. Maximum placental thickness (PT) was also measured at the apparent center of the placenta on multi-plane HASTE images.
Statistical analysis
First, only for patients with AGA, the associations between GA and placental MRI parameters (IVIM parameters, T2-relaxation times, and PT) were evaluated using Spearman correlation. Spearman rank correlation coefficient rho (r) of 0.80–1.00 indicated a very strong correlation, 0.60–0.80 indicated strong to good correlation, 0.40–0.60 indicated moderate correlation, 0.20–0.40 indicated fair correlation, and ≤0.19 indicated little or no correlation. If any quantitative MRI parameters were significantly (P < 0.05) associated with GA, we subsequently used Z-scores in the following statistical assessments to remove the effect of physiological changes associated with GA. BW and UmA-PI were also converted to Z-scores. Birth weight was converted to its Z-score using Cole's lambda mu sigma (LMS) method, which is regarded as the gold standard for tracing anthropometric charts (20,21). After that, for all patients, the associations between BW (Z-scores) and placental IVIM parameters, T2 value, and PT were evaluated.
Second, using the Mann–Whitney U-test, IVIM parameters (Dfast, Dslow, and f), T2 value, and UmA-PI were compared between the following groups: (i) patients who delivered SGA neonates and appropriate for gestational age (AGA) neonates; (ii) patients with and without ECS; and (iii) patients with preterm birth and with full-term birth. The UmA-PI was converted to its Z-score to exclude the effect of GA (22). P < 0.05 was considered significant. Statistical analyses were conducted using R 3.5.1 (R Foundation for Statistical Computing, Vienna, Austria).
Results
Patient characteristics
A total of 89 women with singleton pregnancies between February 2015 and November 2018 met the inclusion criteria of the study. Of them, 21 cases were excluded because of abnormal fetal karyotype and apparent congenital malformations. Consequently, 68 patients were included in the present study. Details of maternal and pregnancy characteristics are presented in Table 1. Among the 68 patients, 16 cases were SGA and 52 cases were AGA; 25 cases underwent ECS; 23 cases were preterm births and the remaining 45 cases were full-term births.
Maternal and pregnancy characteristics.

Values are given as n (%) or mean ± SD.
AGA, appropriate-for-gestational-age; ECS, emergency cesarean section; MRI, magnetic resonance imaging; SGA, small-for-gestational age.
MRI parameters
Of the 52 AGA patients, the Spearman rank correlation coefficient between placental T2-relaxation times and GA was significant and Spearman rho was −0.631 (P < 0.0001), indicating strong correlation (Fig. 1). PT showed a weak association with GA, and Spearman rho was 0.296 (P = 0.0031) (Fig. 1). Therefore, T2-relaxation times and PT were converted to Z-scores in the statistical assessments. On the other hand, IVIM parameters (Dfast, Dslow, and f) did not have significant associations with GA, and their Spearman rho were 0.0786 (P = 0.58), 0.0015 (P = 0.99), and −0.187 (P = 0.18), respectively. The distribution of AGA and SGA in the correlation between fetal weeks of gestation and MR parameters is shown in Fig. 2.

The relationship between placental magnetic resonance imaging parameters and gestational age of 52 appropriate for gestational age neonates.

The relationship between placental magnetic resonance imaging parameters and gestational age.
Associations between body weight (Z-scores) and MRI parameters
As for the relation with BW (Z-scores), among all 68 patients, significant associations were observed with T2 values (Z-scores) (Spearman rho = 0.397, P < 0.0001) and UmA-PI (Z-scores) (Spearman rho = −0.439, P < 0.0001) (Fig. 3). There were also weak associations between f and BW (Z-scores) (Spearman rho = 0.289, P = 0.017). BW (Z-scores) was not significantly associated with Dfast, Dslow, and PT, with their Spearman rho at 0.0202 (P = 0.099), −0.187 (P = 0.13), and −0.052 (P = 0.67), respectively.
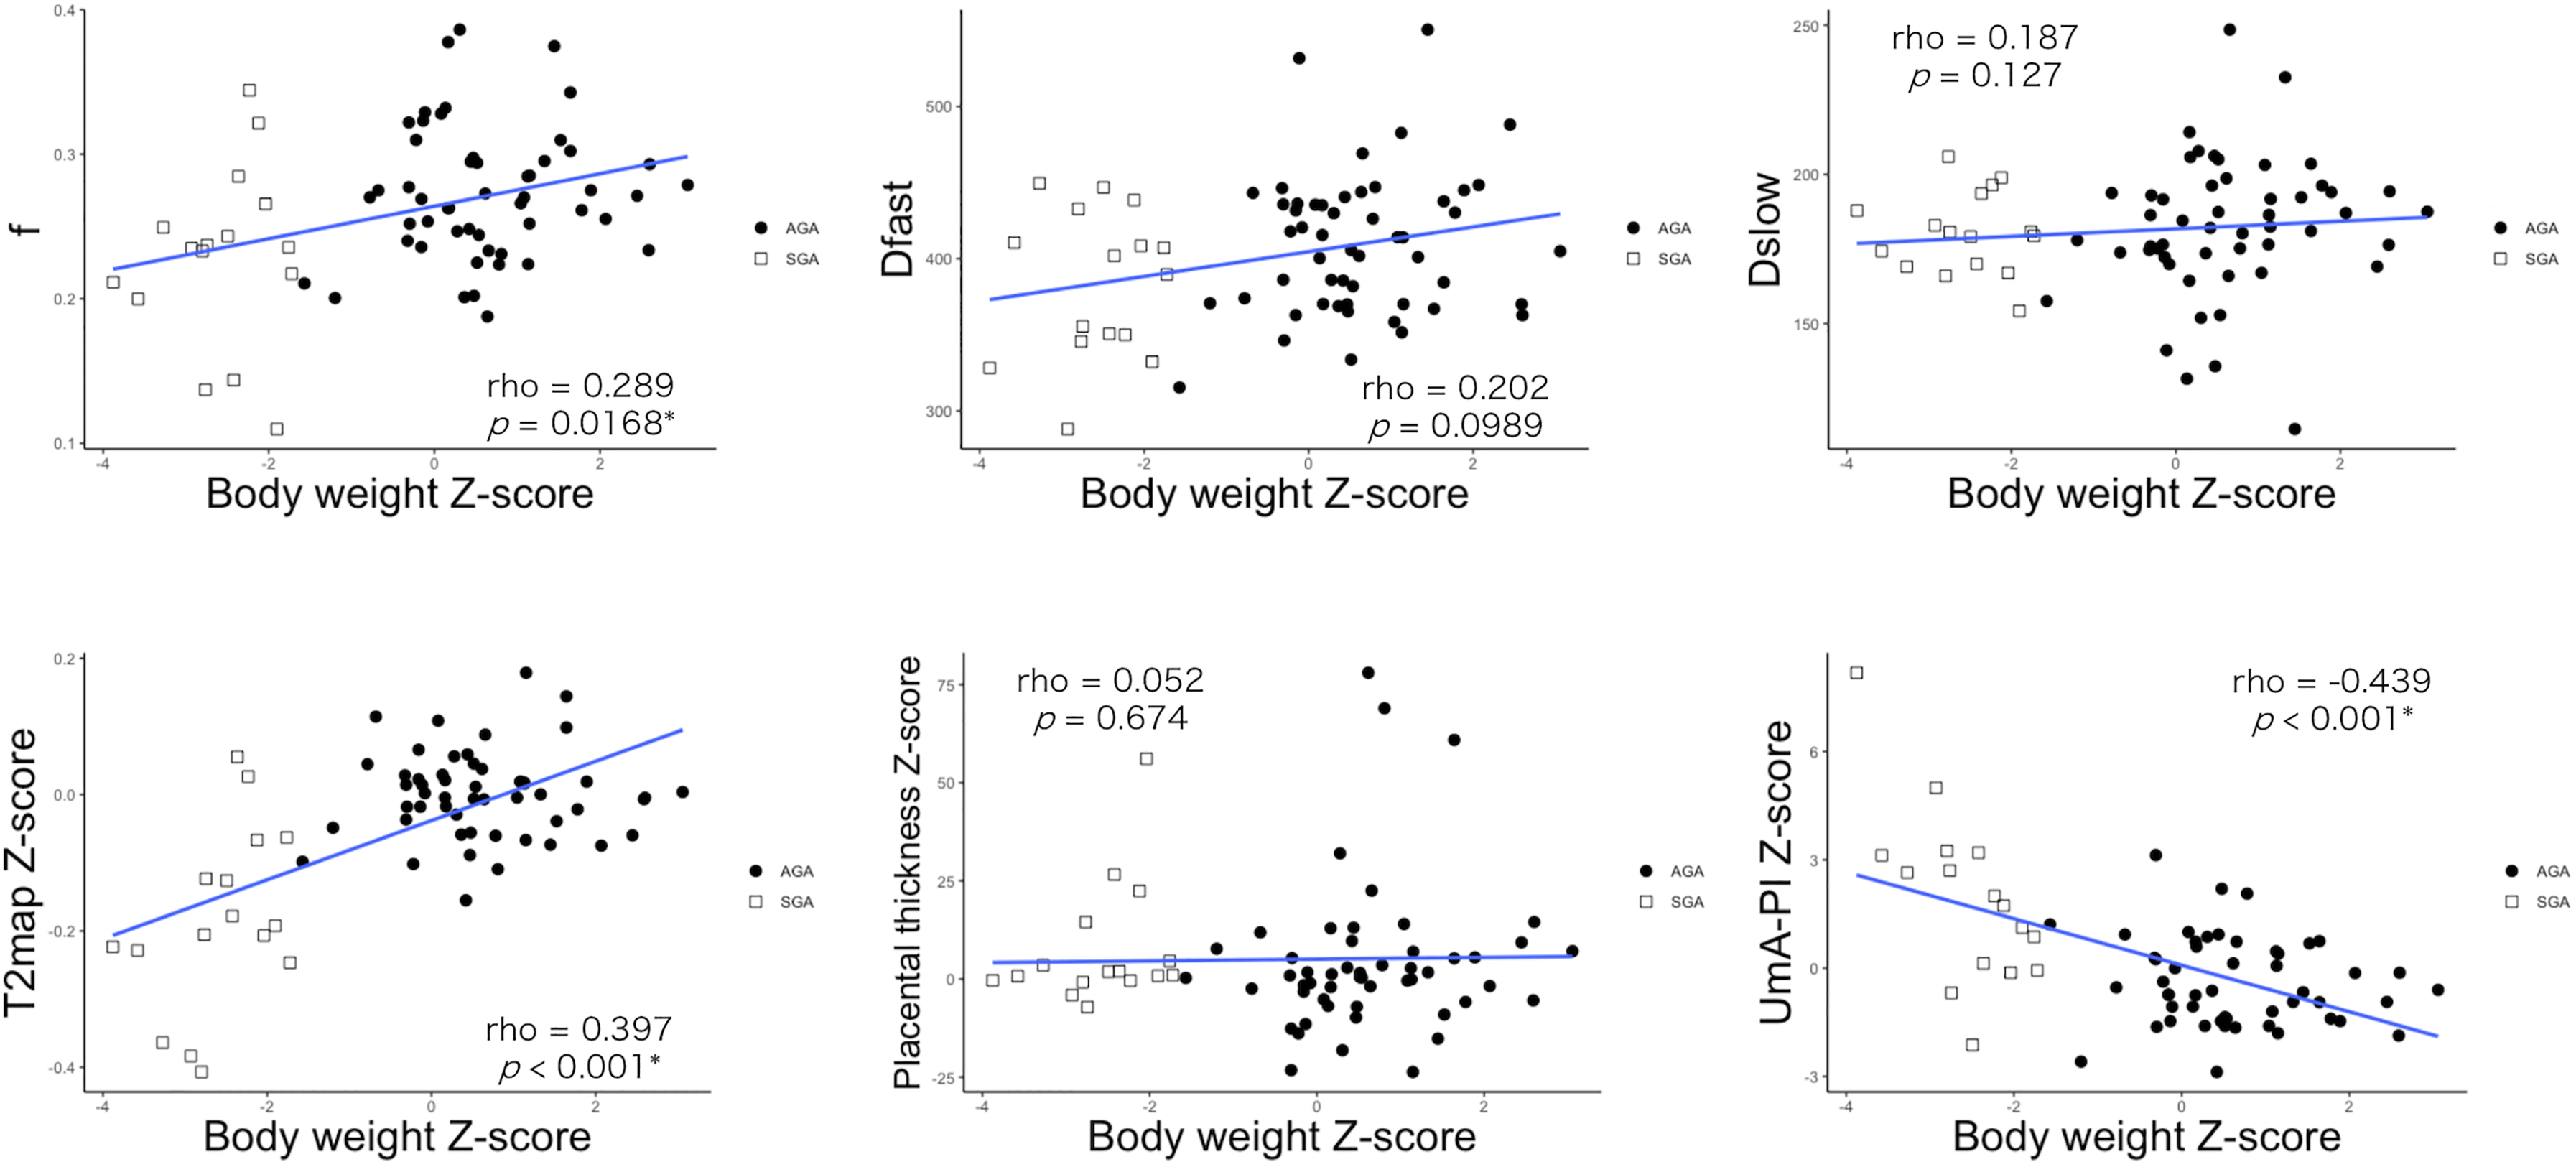
The association of magnetic resonance imaging parameters and birth body weight (Z-score).
Associations between MRI parameters and adverse outcomes
The associations of MRI parameters with adverse outcomes of pregnancies are summarized in Table 2. SGA was significantly associated with low f, T2 values (Z-scores), and high UmA-PI (Z-scores) (P = 0.008, P < 0.0001, and P < 0.0001, respectively) (Supplemental material 1). ECS was significantly associated with small f, small Dfast, and low T2 value (Z-scores) (P = 0.001, P = 0.050, and P < 0.0001, respectively) (Supplemental material 2). The preterm birth group had significantly differences in IVIM parameters (Dfast, Dslow, and f) and lower T2 values (Z-scores) (P = 0.024, P = 0.032, P = 0.002, and P < 0.0001, respectively) than those in the full-term birth group (Table 2) (Supplemental material 3).
Associations with MRI parameters and adverse outcomes of pregnancies(a) SGA vs AGA

UmA, Umbilical artery; PT, placental thickness
Discussion
In the present study, placental T2 values (Z-scores) and perfusion fraction (f) of IVIM showed statistically significant associations with low BW and clinical adverse outcomes. These two quantitative MRI parameters showed promise in non-invasive evaluation of placental function. The conversion of T2 values to Z-scores would be recommended to avoid the physiological effects of GA. IVIM parameters did not vary by GA.
Among patients with AGA fetuses, GA showed significant association with T2 values but not with IVIM parameters. The T1- and T2-relaxation times typically decrease and placental heterogeneity increases throughout gestation in normal placenta, and our results support these findings (23,24). Regarding IVIM parameters, some papers demonstrated that normal placental perfusion fraction (f) values also decreased with GA (13–15,25), whereas Capuani et al. reported placental perfusion fraction (f) moderately increased during gestation (26). However, they measured only in the peripheral area of the placenta. In our study, perfusion fraction (f) seems to show a slight decrease against GA after 30 weeks of gestation, but the overall trend did not show significance (Fig. 1). The number of patients in early gestation was small and its perfusion fraction (f) values varied in our cases. Those factors might be different in previous reports.
Our results suggest that lower perfusion fraction (f) and T2 values were associated with adverse outcomes of pregnancy and correspond with previous results. Kristi et al. showed perfusion fraction (f) of placenta in complicated pregnancies was significantly lower than in normal pregnancies, but not in pseudo-diffusion coefficient (Dfast) and diffusion coefficient (Dslow) (1). Sohlberg et al. also reported that the placental perfusion fraction (f) is smaller in early pre-eclampsia than in early normal pregnancy (13). Perfusion fraction (f) is known to represent the proportion of fast diffusion components associated with microcirculation and usually related to the volume of blood (26). Therefore, it is convincing that perfusion of the placenta in patients of SGA, preterm birth, and ECS was lower than in normal pregnancy. In contrast, diffusion coefficient (Dslow) is related to the diffusion of pure water molecules, and pseudo-diffusion coefficient (Dfast) is affected by the velocity of blood flow and capillary morphology (26). Then, these factors may not be directly related to blood volume or circulation to the fetus. Our study demonstrated a better performance in T2 values for detecting placental insufficiency compared to IVIM parameters, but IVIM parameters would also be useful because of their constancy throughout gestation.
In the distribution of AGA and SGA in the correlation between fetal weeks of gestation and MR parameters (Fig. 2), the T2 values of the SGA group showed clearly lower values than the AGA group during the second trimester to the early third trimester. In contrast, in the late third trimester, the difference of T2 values between the SGA and AGA groups became unclear due to the overlap (Fig. 2). UmA-PI showed a similar (but “reversed”) feature in the second trimester and early third trimester. These results might indicate that T2 values have the potential to detect cases of SGA in the early stages of pregnancy. Spinillo et al. reported that Doppler abnormalities of UmA were associated with the increased intervillous fibrin deposits, villous hypoplasia, and syncytial knots suggesting superficial implantation and maternal vascular underperfusion (27). Our results might be related with the previously suggested differences in pathophysiology between early and late pre-eclampsia (28–30).
In our study, UmA-PI measurement and MRI scans were performed at almost the same time, allowing a direct comparison of T2 values, IVIM parameters, and UmA-PI performance. Doppler measurement of UmA-PI is reported to be a potential indicator in evaluating placental health and essential for clinical management of fetal growth restriction (31). In our results, UmA-PI could show a significant difference between SGA and AGA but not for ECS/non-ECS and preterm/full-term birth (Table 2). In contrast, placental T2 values (Z-scores) showed good correlation with the adverse effects of pregnancy. As Derwig et al. demonstrated, T2-relaxation time is a good index for placental function, reflecting various biochemical and physical mechanisms (14). Our study might indicate that MR scans could detect the placental insufficiency that US scans could not reveal. US is bound to have an observer bias and MR examination may cover the shortcomings of US.
The present study has some limitations. First, as we mentioned previously, the number of cases in this study was relatively small, especially in the early second trimester. We calculated Z-scores in order to exclude the effects of GA and found that after removing the effects of GA-related normal changes, there were statistically significant differences among MRI parameters and clinical outcomes. We will need to continue to collect cases from both the second and third trimesters. Second, some of the most severe and high-risk cases of FGR may not have undergone MRI scans. Further analysis needs to be performed with more patients, especially in the early second trimester. Third, estimation of Dfast and f is generally not so stable. For example, in some cases, we need to define parameters in the curve-fitting procedure (17). To make IVIM parameters more stable, we used the Baysesian model fitting free from user-defined parameters.
In conclusion, placental f and T2 values (Z-scores) had significant associations with low BW and clinical adverse outcomes. Placental IVIM and T2 Z-score could be a promising and potential non-invasive imaging biomarker for placental insufficiency, regardless of GA, and might help in making important decisions in the management of compromised pregnancies.
Supplemental Material
sj-docx-1-acr-10.1177_02841851211060410 - Supplemental material for Placental functional assessment and its relationship to adverse pregnancy outcome: comparison of intravoxel incoherent motion (IVIM) MRI, T2-relaxation time, and umbilical artery Doppler ultrasound
Supplemental material, sj-docx-1-acr-10.1177_02841851211060410 for Placental functional assessment and its relationship to adverse pregnancy outcome: comparison of intravoxel incoherent motion (IVIM) MRI, T2-relaxation time, and umbilical artery Doppler ultrasound by Kyoko Kameyama Nakao, Aki Kido, Koji Fujimoto, Yoshitsugu Chigusa, Sachiko Minamiguchi, Masaki Mandai and Yuji Nakamoto in Acta Radiologica
Footnotes
Acknowledgments
The authors thank the following people for their contributions to the study: Dr Yuki Himoto (Department of Diagnostic Imaging and Nuclear Medicine, Graduate School of Medicine, Kyoto University), Dr Yasuhisa Kurata (Department of Diagnostic Imaging and Nuclear Medicine, Graduate School of Medicine, Kyoto University), Dr Masahiro Yakami (Preemptive Medicine and Lifestyle-Related Disease Research Center, Kyoto University Hospital), Dr Ryo Kuwahara (Department of Radiology, National Hospital Organization Kyoto Medical Center), Dr Naoko Nishio (Department of Radiology, Osaka Red Cross Hospital), Dr Ryo Yajima (Department of Diagnostic Imaging and Nuclear Medicine, Graduate School of Medicine, Kyoto University), and Dr Satoshi Otani (Department of Diagnostic Imaging and Nuclear Medicine, Graduate School of Medicine, Kyoto University).
Declaration of conflicting interests
The author(s) declared no potential conflicts of interest with respect to the research, authorship, and/or publication of this article.
Funding
The author(s) received no financial support for the research, authorship and/or publication of this article.
Supplemental material
Supplemental material for this article is available online.
References
Supplementary Material
Please find the following supplemental material available below.
For Open Access articles published under a Creative Commons License, all supplemental material carries the same license as the article it is associated with.
For non-Open Access articles published, all supplemental material carries a non-exclusive license, and permission requests for re-use of supplemental material or any part of supplemental material shall be sent directly to the copyright owner as specified in the copyright notice associated with the article.