
Abstract
Background
Voxel-based morphometry (VBM) using magnetic resonance imaging (MR) has been used to estimate cortical atrophy associated with various diseases. However, there are mis-segmentations of segmented gray matter image in VBM.
Purpose
To study a twofold evaluation of single- and multi-channel segmentation using synthetic MR images: (1) mis-segmentation of segmented gray matter images in transverse and cavernous sinuses; and (2) accuracy and repeatability of segmented gray matter images.
Material and Methods
A total of 13 healthy individuals were scanned with 3D quantification using an interleaved Look–Locker acquisition sequence with a T2 preparation pulse (3D-QALAS) sequence on a 1.5-T scanner. Three of the 13 healthy participants were scanned five consecutive times for evaluation of repeatability. We used SyMRI software to create images with three contrasts: T1-weighted (T1W), T2-weighted (T2W), and proton density-weighted (PDW) images. Manual regions of interest (ROI) on T1W imaging were individually set as the gold standard in the transverse sinus, cavernous sinus, and putamen. Single-channel (T1W) and multi-channel (T1W + T2W, T1W + PDW, and T1W + T2W + PDW imaging) segmentations were performed with statistical parametric mapping 12 software.
Results
We found that mis-segmentations in both the transverse and cavernous sinuses were large in single-channel segmentation compared with multi-channel segmentations. Furthermore, the accuracy of segmented gray matter images in the putamen was high in both multi-channel T1W + PDW and T1W + T2W + PDW segmentations compared with other segmentations. Finally, the highest repeatability of left putamen volumetry was found with multi-channel segmentation T1WI + PDWI.
Conclusion
Multi-channel segmentation with T1WI + PDWI provides good results for VBM compared with single-channel and other multi-channel segmentations.
Introduction
Voxel-based morphometry (VBM) (1) using magnetic resonance imaging (MRI) has been used to estimate cortical atrophy associated with various diseases such as Alzheimer's disease (AD) (2), idiopathic normal pressure hydrocephalus (3), epilepsy (4), diabetes (5), Parkinson's disease (6), and panic disorders (7). In many studies, statistical parametric mapping (SPM) software (Wellcome Department of Imaging Neuroscience Group, London, UK; http://www.fil.ion.ucl.ac.uk/spm) has been used to prepare segmented gray matter images by segmentation of T1-weighted (T1W) imaging and for statistical analysis of value in voxels (8,9). Signal intensity on T1W imaging is an important factor in segmentation with SPM software because uniformity of signal intensity on T1W imaging is a cause of mis-segmentation (10–12). Therefore, signal intensity correction for non-uniformity on T1W imaging is generally performed as preprocessing of analysis with SPM software. Still, mis-segmentation due to the information of signal intensity remains in some structures (transverse sinus and cavernous sinus) because signal intensity in such structures is the same as the signal intensity in gray matter. This mis-segmentation is decreased by using other contrast images such as fluid-attenuated inversion recovery (FLAIR) or proton density (PD) to increase contrast between some structures and gray matter. Therefore, multimodal segmentation based on T1W imaging and other contrast images has been suggested for decreasing mis-segmentation (13,14). However, multimodal segmentation has two important problems. First, additional image scan time (about 5–7 min (13)) is longer than scan time of two-dimensional (2D) clinical images because small voxel size is needed in VBM. Head motion artifacts are increased by long scan times compared with short scan times. Motion artifact increases mis-estimation on computational analysis in the human brain (15). Second, misalignment between different image scans occurs during head movement and image distortion.
Recently, a synthetic MR method was introduced into clinical MRI (16). 3D quantification using an interleaved Look–Locker acquisition sequence with a T2 preparation pulse (3D-QALAS) sequence has been developed for simultaneous quantification of relaxation times (longitudinal T1 and transverse T2 relaxation times) and PD (17) and has been applied to the brain (18,19). Using information obtained by T1, T2, and PD maps, the synthetic MR method using SyMRI software (SyntheticMR, Linköping, Sweden) can make any contrast including T1W, T2W, PDW, and inversion recovery images (20). Therefore, VBM with synthetic MR images overcomes these problems of additional image scan time and misalignment between different image scans incurred during multimodal segmentation. This synthetic MR method can also create segmented gray matter images, by assigning tissue partial volumes to each voxel through matching of the measured T1, T2, and PD and predetermined tissue values (21). However, accuracy of segmentation by the synthetic MR method seems to be lower than segmentation with SPM software using T1W imaging because large mis-segmented regions in the superior sagittal sinus was observed in a previous study (19). We think the reason for these large mis-segmented regions using the synthetic MR method lies in the difference between the segmentation algorithms of the SPM and SyMRI software. The synthetic MR method does not use tissue probability mapping, although SPM software uses it in segmentation of gray matter image.
A previous study showed that the accuracy of intracranial volume extraction using the brain extraction tool was improved by using multi-contrast images with the synthetic contrast images (22). Therefore, we suppose that the accuracy of gray matter segmentation with SPM software can be improved by using multi-channel segmentation with synthetic MR images compared with single-channel segmentation (T1W imaging). Thus, the aim of the present study was the following twofold evaluation of single- and multi-channel segmentation with SPM 12 software using synthetic MR images: (i) mis-segmentation in the transverse sinus and cavernous sinus; and (ii) accuracy and repeatability of segmented gray matter image.
Material and Methods
Participants
The study included 13 healthy participants (10 men, 3 women; mean age = 25.9 ± 6.6 years; age range = 21–44 years). Individuals were eligible for inclusion if evaluation of their 3D-T1W and T2W images by a board-certified radiologist (AH) with eight years of experience did not show brain tumors, infarction, hemorrhage, brain atrophy, or white matter lesions graded >1 according to the Fazekas scale (23). The study protocol was approved by the institutional ethics committee. After explaining the purpose of the study to each participant, written informed consent was obtained from all individuals. To ensure participant confidentiality, data were anonymized.
MRI scanning protocol
All scans were performed on a 1.5-T scanner (Ingenia; Philips Healthcare, Best, The Netherlands) with a 12-channel head coil. The scan parameters of the 3D-QALAS were as follows: axial acquisition; repetition time/echo time (TR/TE) = 6.2/2.8 ms; inversion delay times = 100, 1000, 1900, 2800 ms; T2-prep echo time = 100 ms; field of view (FOV) = 250 × 214 × 182 mm; matrix size = 192 × 165 × 140; section thickness = 1.30 mm; flip angle = 4°; receiver bandwidth = 249.4 Hz/pixel; acceleration factor = 1.7; averages = 1; and acquisition time = 9 min 56 s. The 13 healthy individuals were scanned with the 3D-QALAS for evaluation of mis-segmentation and accuracy. Three of the 13 healthy participants were scanned five consecutive times for evaluation of repeatability.
Based on the 3D-QALAS data, we used SyMRI version 0.45.14 software to create images with three contrasts: T1W, T2W, and PDW imaging. Parameters in SyMRI software were as follows: T1W imaging, TR/TE = 500/10 ms; T2W imaging, TR/TE = 4500/100 ms; PDW imaging, TR/TE = 8000/10 ms. Multimodal segmentation using FLAIR imaging was suggested for decreasing mis-segmentation (13,14). In our preliminary study, we created FLAIR images and performed visual evaluation of segmented gray matter images with multi-channel (T1W + FLAIR) segmentation. However, the quality of the segmented gray matter images was very low compared with single-channel (T1W) segmentation. Therefore, we did not use FLAIR images in the present study.
Image preprocessing for evaluation of mis-segmentation
For the evaluation of mis-segmentation in the transverse sinus and cavernous sinus, single-channel (T1W) and multi-channel (T1W + T2W, T1W + PDW, T1W + T2W + PDW) segmentations were performed with SPM 12 software using the data of 13 healthy individuals. During segmentation, the affine regularization space template from the International Consortium for Brain Mapping was changed from European to East Asian because all participants were Japanese; default settings were used for all other parameters. We then obtained segmented gray matter images in native space. The segmented gray matter images are used for evaluation of accuracy and repeatability in our study.
Evaluation of mis-segmentation
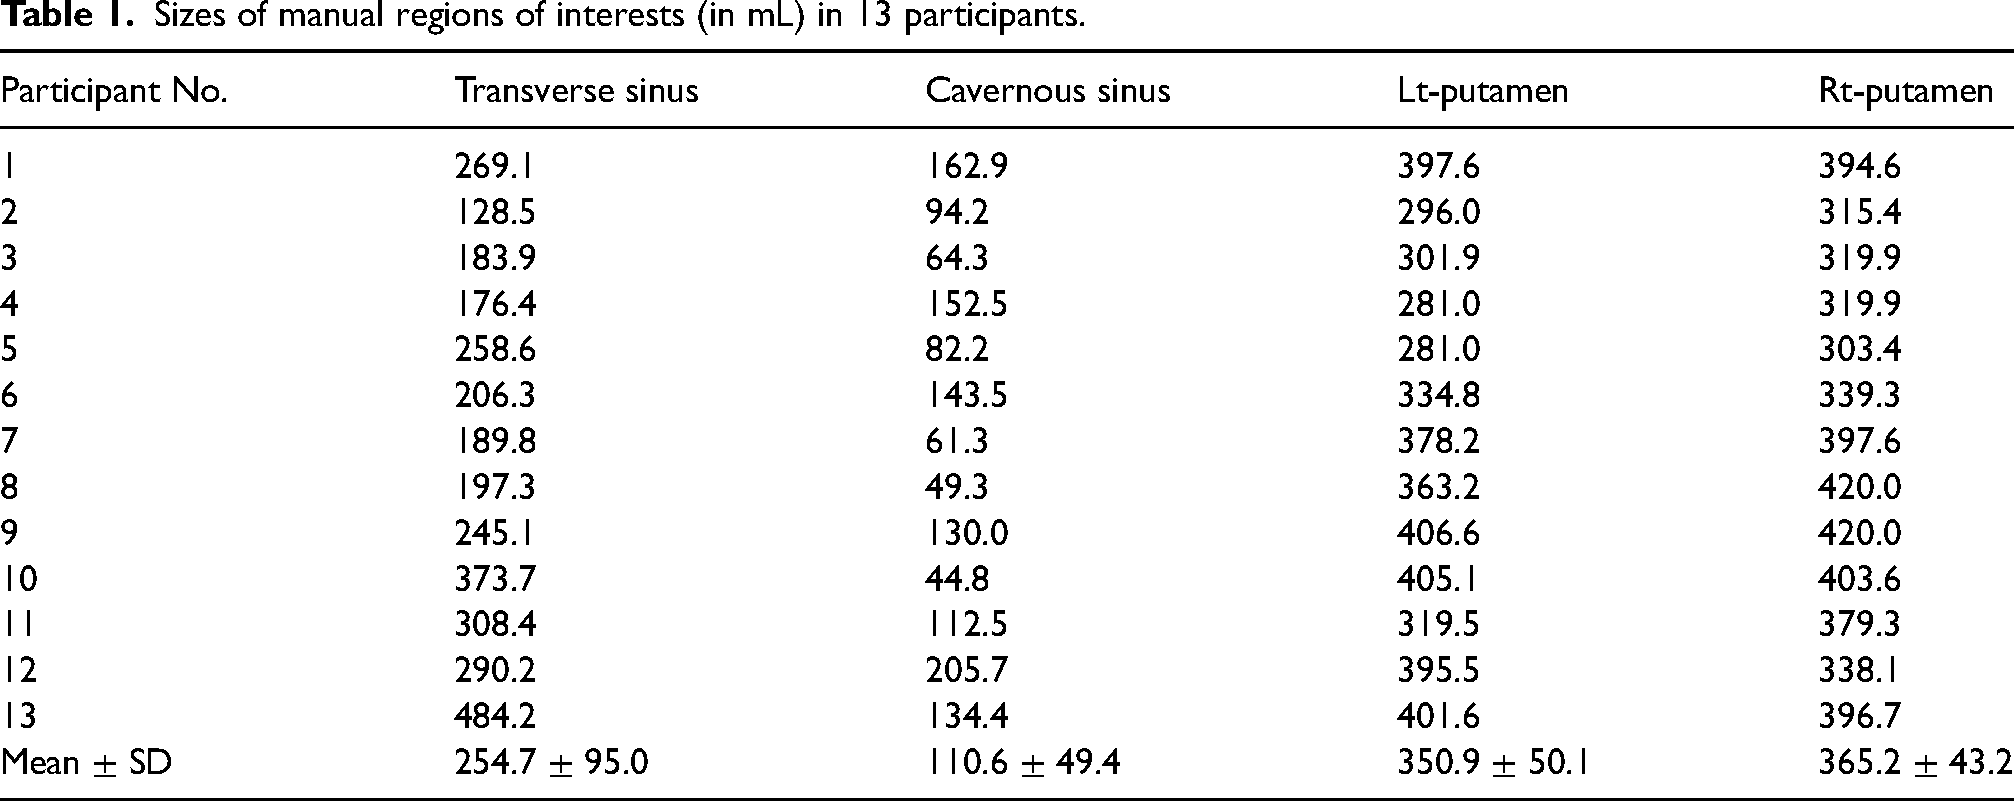
We created manual regions of interest (ROI) as the gold standard individually in transverse sinus and cavernous sinus on T1W imaging. An experienced operator (MG, with 16 years of clinical experience as a radiologic technologist) segmented areas as transverse sinus or cavernous sinus by manually tracing their borders using Multi-image Analysis GUI (Mango) software (University of Texas Health Science Center, San Antonio, TX, USA; https://www.nitrc.org/projects/mango). To ensure segmentation accuracy, all manual ROIs were saved and later reviewed in another session by a board-certified neuroradiologist (AH). All manual ROIs were corrected until a consensus was reached by the radiologic technologist and neuroradiologist
The R score was defined as follows:

The gray matter volume inside the manual ROI was measured individually on segmented gray matter images. If no mis-segmentation was found in the segmented gray matter image, the R score was 0. By contrast, large mis-segmentation of transverse and cavernous sinuses to gray matter images yielded R-score values near 100. In both transverse and cavernous sinuses, differences in the R score between single- and multi-channel segmentations were tested using two methods: (i) repeated measure analysis of variance (repeated ANOVA); and (ii) paired Student's t-test with Bonferroni/Dunn post-hoc tests. A P value < 0.05 was considered statistically significant.
Image preprocessing for accuracy and repeatability of segmented gray matter images
For evaluation of accuracy of segmented gray matter image, single-channel (T1W) and multi-channel (T1W + T2W, T1W + PDW, T1W + T2W + PDW) segmentations were performed with SPM 12 software using data from the 13 healthy participants. During segmentation, all parameters were the same as those in the “Image preprocessing for evaluation of mis-segmentation” subsection above.
For evaluation of repeatability of segmented gray matter image, single-channel (T1W) and multi-channel (T1W + T2W, T1W + PDW, T1W + T2W + PDW) segmentations were performed with SPM 12 software using three sets of data (one set = a healthy participant × five repeats). During segmentation, all parameters were set as above to the same as “Image preprocessing for evaluation of mis-segmentation.”
Evaluation of accuracy and repeatability of segmented gray matter images
True gray matter volume in the whole brain cannot be easily determined in humans. The brain cortex is complex in shape, and manually segmenting it is a process that is both laborious and prone to labeling inconsistencies and errors. Unlike cortical segmentation, manual segmentation of the putamen is a simple process because its shape is simple, and its boundary is visually clear on a T1W image. Therefore, we created manual ROIs as the gold standard individually in the left (Lt) and right (Rt) putamen. The experienced operator (MG) segmented areas as the putamen by manually tracing its borders using Mango software. To ensure segmentation accuracy, all manual ROIs were saved and later reviewed in another session by the board-certified neuroradiologist (AH). As noted previously, all manual ROIs were corrected until a consensus was reached by the radiologic technologist and neuroradiologist.
For evaluation of the accuracy of segmented gray matter images, the R scores were calculated with segmented gray matter images from 13 healthy individuals. No mis-segmentation of the putamen in segmented gray matter images yielded an R score of 100. By contrast, large mis-segmentation of the putamen brought the R score near to 0. Differences in the R score between single- and multi-channel segmentations were tested using the same methods as those in the “Evaluation of mis-segmentation” section.
For evaluation of repeatability of segmented gray matter images, the percentage change (P score) was defined as follows:

Results
Evaluation of mis-segmentation
Fig. 1 contains examples of images created using SyMRI software with T1W, T2W, and PDW imaging contrasts. Manual ROI sizes of transverse and cavernous sinuses are shown in Table 1. Fig. 2 shows sample manual ROIs of the transverse sinus in Participants 4 and 9. Of all 13 individuals, Participant 9 showed the lowest R score in single-channel (T1W) segmentation, and Participant 4 showed the highest. Fig. 3 shows the manual ROIs of the cavernous sinus in Participants 7 and 8. Of all 13 individuals, Participant 7 had the lowest R score in single-channel (T1W) segmentation, and Participant 8 had the highest. Mean R scores of manual ROIs of both sinuses are shown in Table 2; significant differences arose between single- and multi-channel segmentations in both sinuses by repeated ANOVA (P < 0.05). Post-hoc tests also revealed significant differences (P < 0.05) when the following images were compared within each sinus group: single-channel (T1W) versus multi-channel (T1W + T2W); single-channel (T1W) versus multi-channel (T1W + PDW); and single-channel (T1W) versus multi-channel (T1W + T2W + PDW). Mis-segmentations in both sinuses were large in single-channel (T1W) segmentation compared with multi-channel segmentations (Table 2).
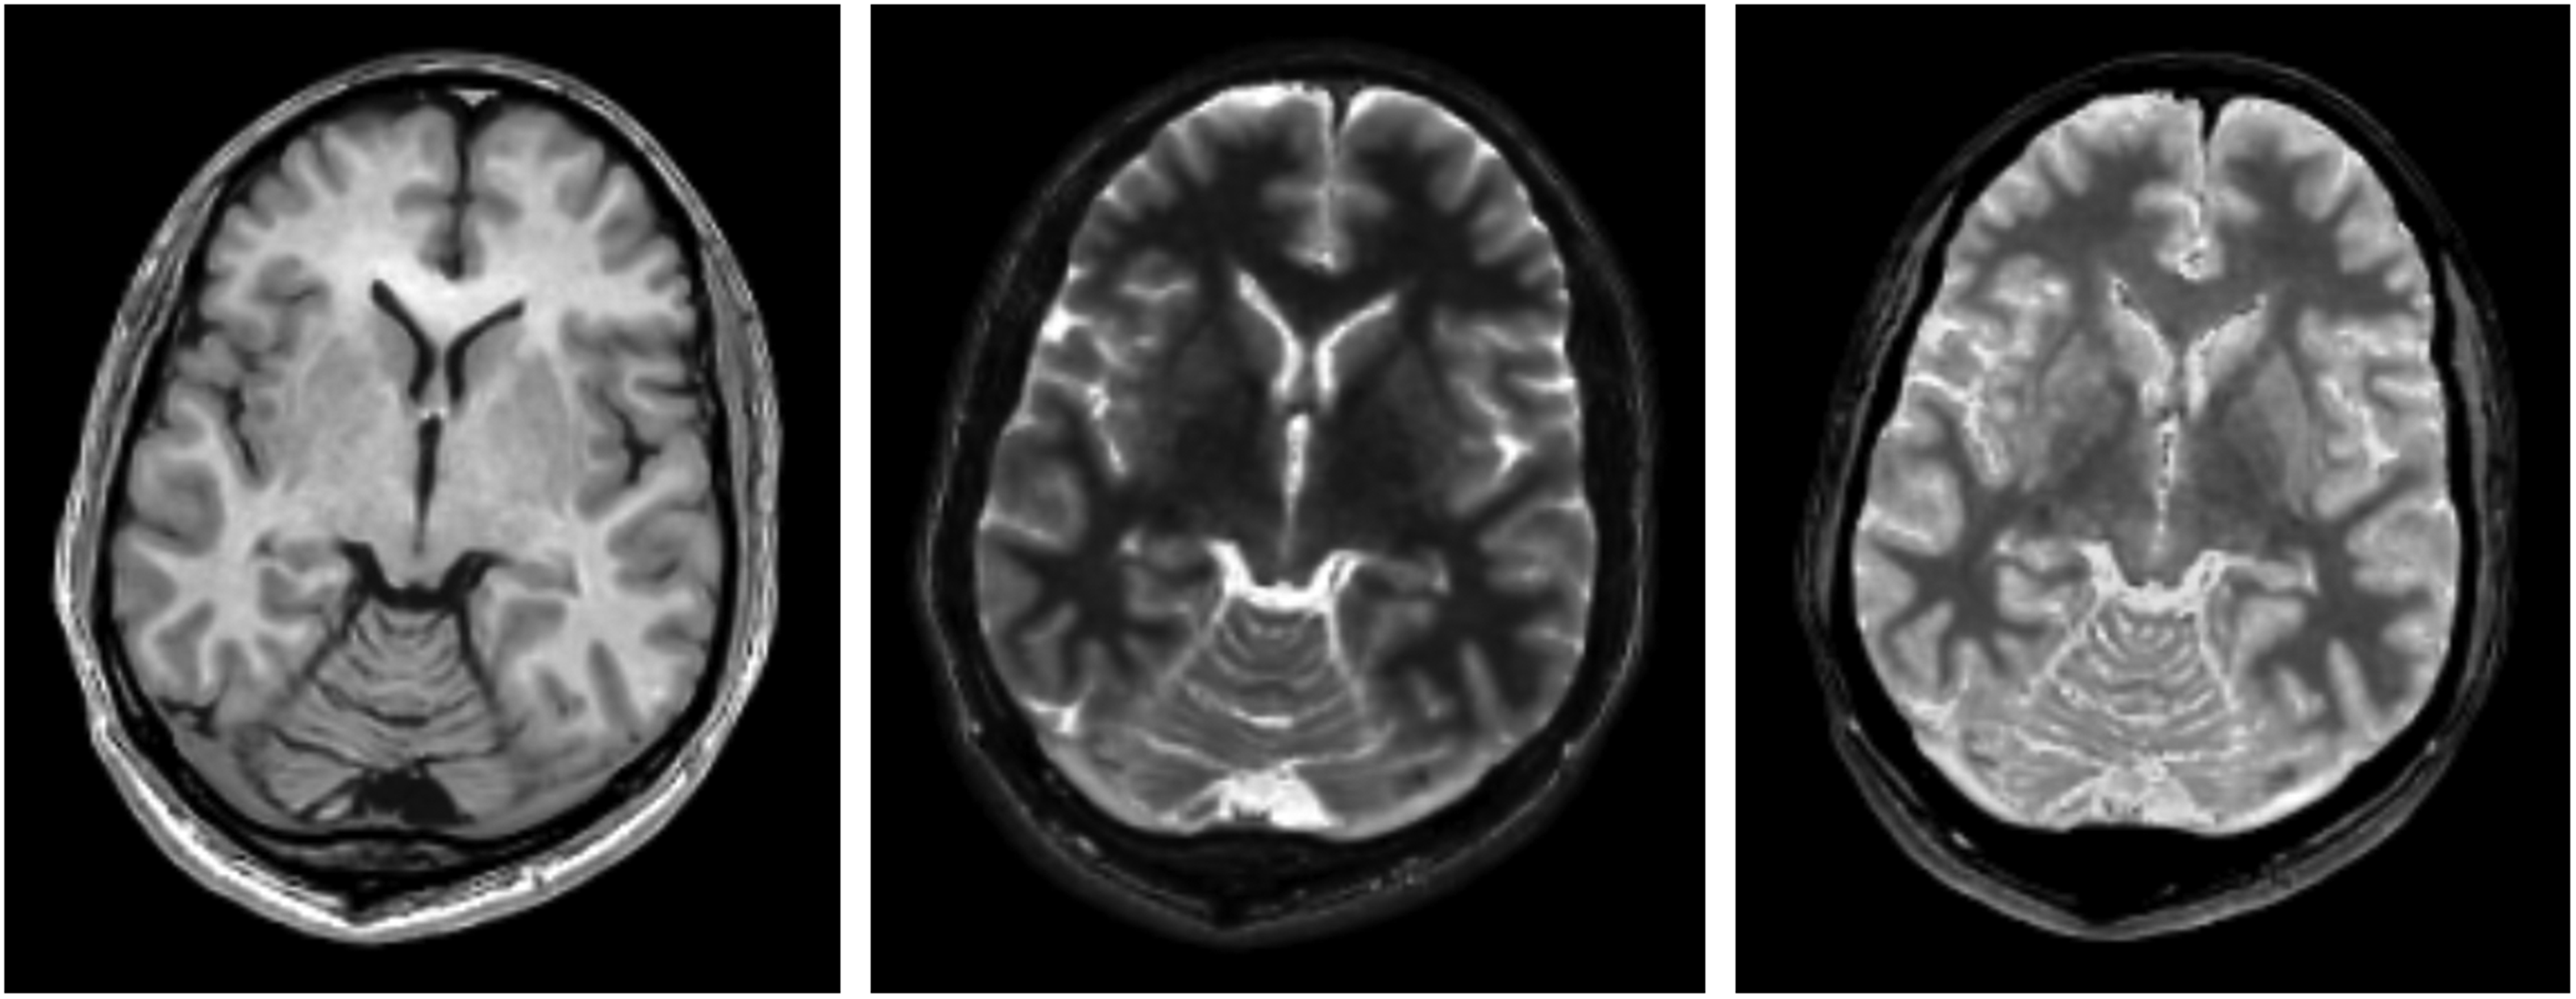
Examples of created images with T1-weighted image (left), T2-weighted image (middle), and PDW image (right) in Participant 4. PDW, proton density-weighted.
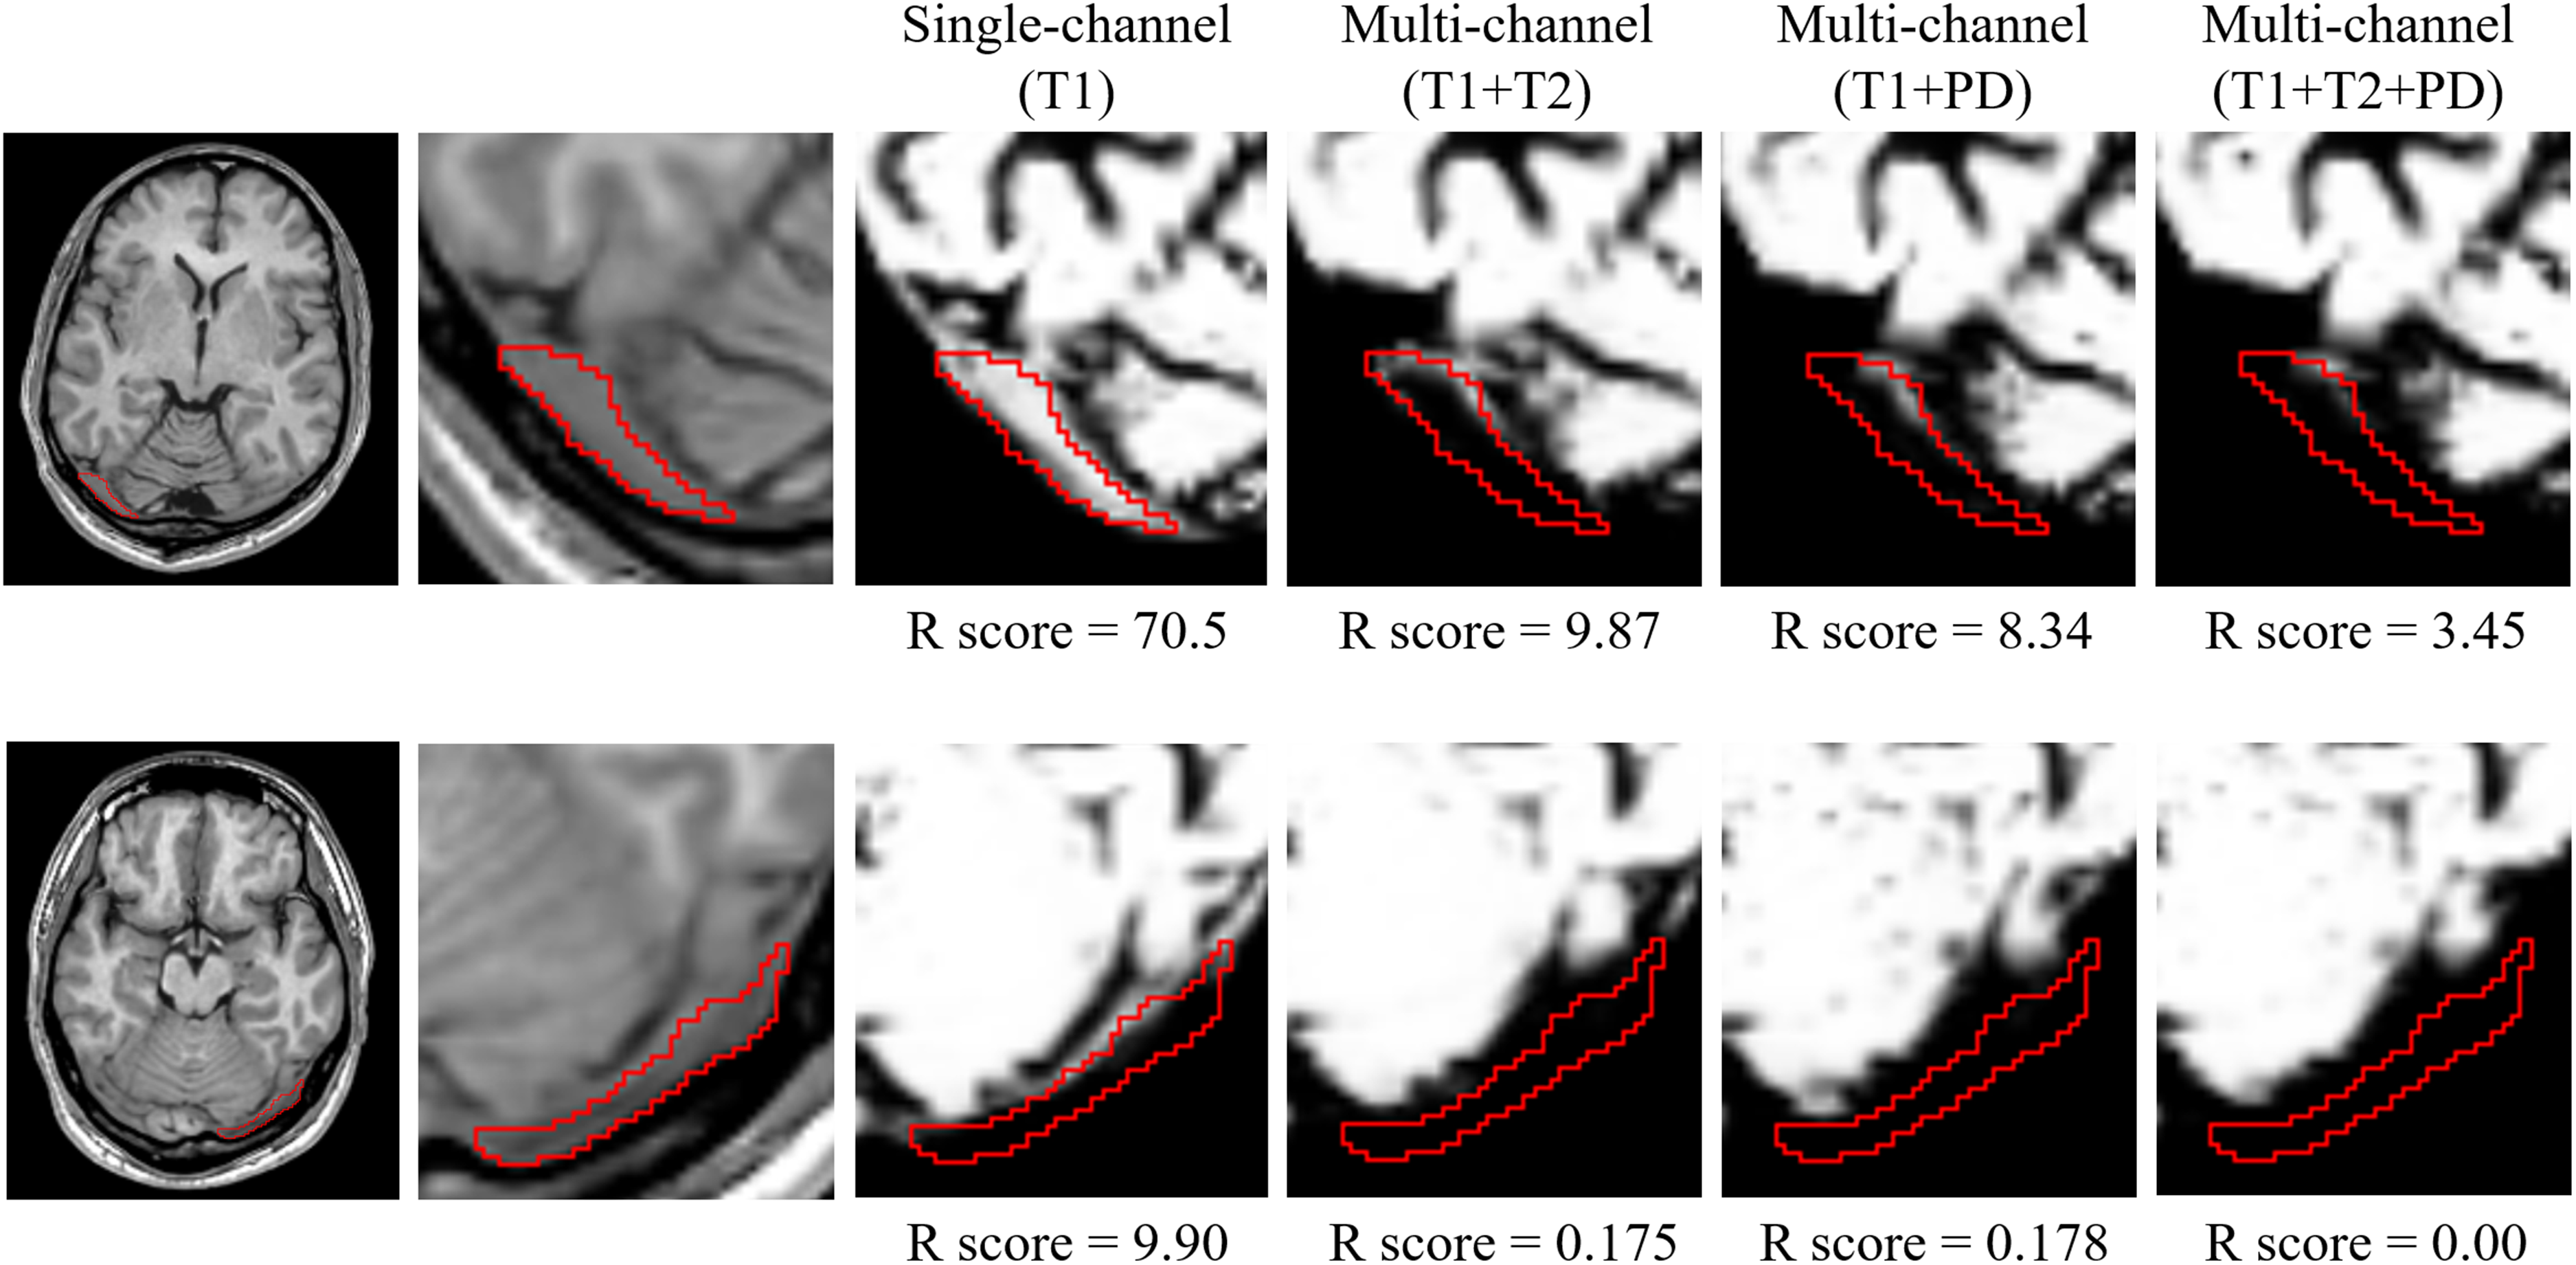
Examples of manual ROIs (red lines) in the transverse sinus and segmented gray matter images of Participant 4 (top row) and Participant 9 (bottom row). Of all 13 individuals examined in this study, Participant 9 demonstrated the lowest R score in single-channel segmentation, and Participant 4 had the highest. Per row, the far left image is a T1W image, and the other five images (one T1W and four segmented gray matter images) are enlarged images. R score = 100 × (the gray matter volume inside manual ROI) / (size of manual ROI). The gray matter volume inside the manual ROIs was measured individually on segmented gray matter images. A high R score denotes large mis-segmentation. ROI, region of interest; T1W, T1-weighted.
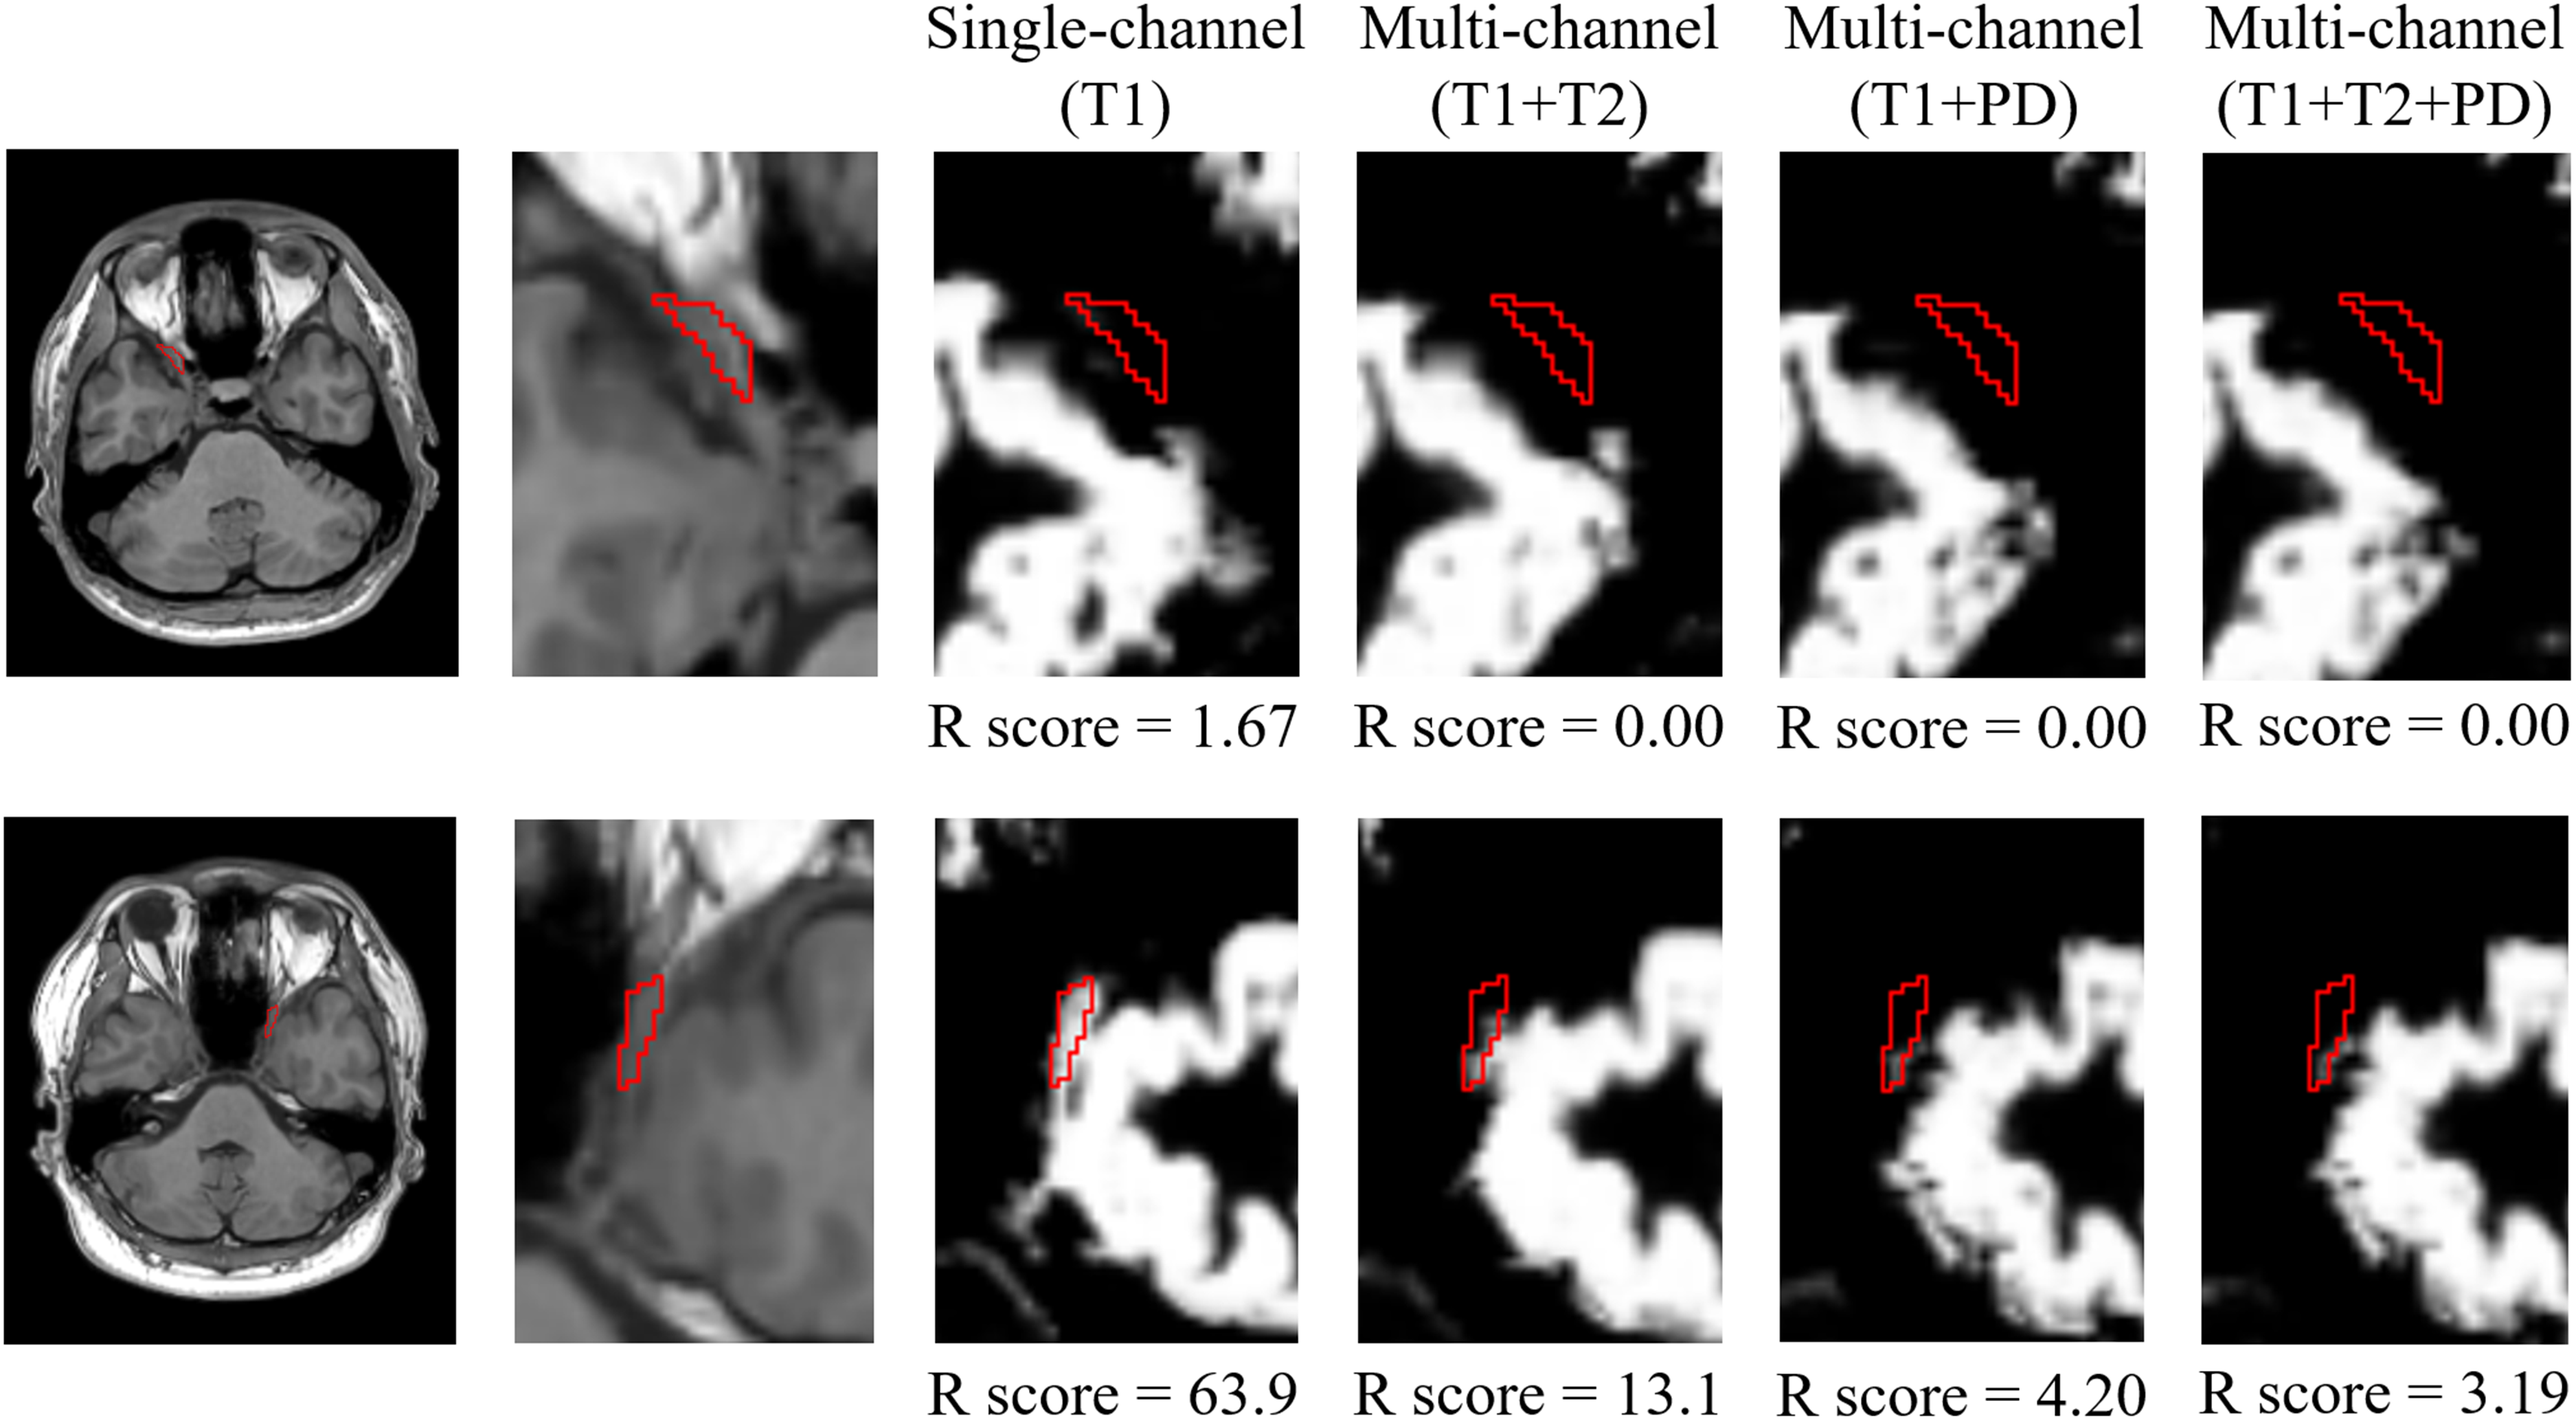
Examples of manual ROIs (red lines) in the cavernous sinus and segmented gray matter images of Participant 7 (top row) and Participant 8 (bottom row). Of all 13 individuals, Participant 7 had the lowest R score in single-channel (T1W) segmentation, and Participant 8 had the highest. As in Fig. 2, the far left image per row is a T1W image, and the other five images (one T1W and four segmented gray matter images) are enlarged images. R score = 100 × (the gray matter volume inside manual ROI) / (size of manual ROI). The gray matter volume inside the manual ROIs was measured individually on segmented gray matter images. A high R score denotes large mis-segmentation. ROI, region of interest; T1W, T1-weighted.
Sizes of manual regions of interests (in mL) in 13 participants.
R scores* in the transverse sinus and cavernous sinus.
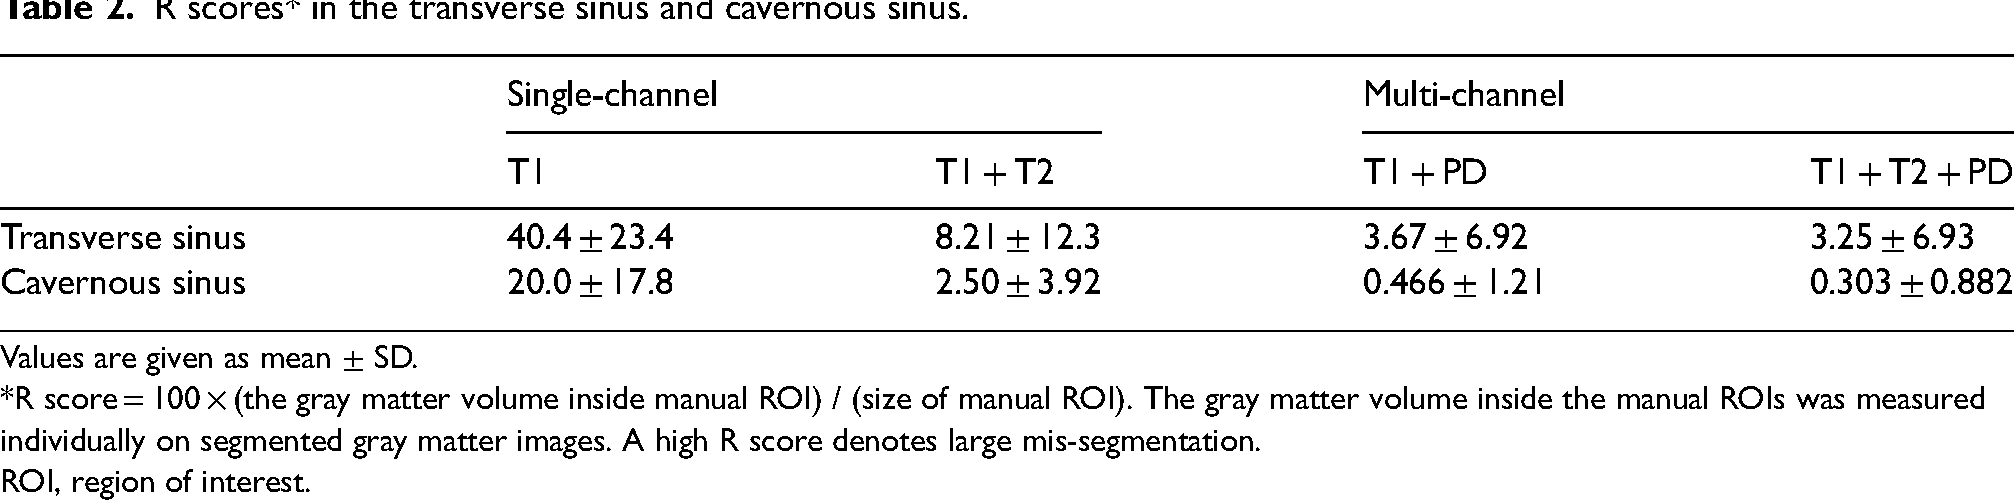
Values are given as mean ± SD.
*R score = 100 × (the gray matter volume inside manual ROI) / (size of manual ROI). The gray matter volume inside the manual ROIs was measured individually on segmented gray matter images. A high R score denotes large mis-segmentation.
ROI, region of interest.
Evaluation of accuracy and repeatability of segmented gray matter images
Manual ROI sizes of both sides of the putamen are shown in Table 1. Fig. 4 shows sample ROIs as the Rt-putamen in Participants 4 and 12. Of the 13 individuals, Participant 4 had the highest R score in single-channel (T1W) segmentation of the putamen, and Participant 12 had the lowest. Mean R scores in both sides of the putamen are shown in Table 3. Significant differences occurred in both sides of the putamen between single- and multi-channel segmentations by repeated ANOVA (P < 0.05). In the Lt-putamen, significant differences were found on post-hoc tests as follows: single-channel (T1W) versus multi-channel (T1W + PDW); single-channel (T1W) versus multi-channel (T1W + T2W + PDW); multi-channel (T1W + T2W) versus multi-channel (T1W + PDW); and multi-channel (T1W + T2W) versus multi-channel (T1W + T2W + PDW). In the Rt-putamen, significant differences after post-hoc tests were found as follows: single-channel (T1W) versus multi-channel (T1W + T2W); single-channel (T1W) versus multi-channel (T1W + PDW); multi-channel (T1W + T2W) versus multi-channel (T1W + PDW); and multi-channel (T1W + T2W) versus multi-channel (T1W + T2W + PDW). The accuracy of segmented gray matter images in the putamen was low in multi-channel (T1W + T2W) segmentation compared with other segmentations (Table 3).

Manual ROIs (red lines) from the Rt-putamen and segmented gray matter images of Participant 4 (top row) and Participant 12 (bottom row). Of the 13 individuals, Participant 4 had the highest R score in single-channel (T1W) segmentation of the putamen, and Participant 12 had the lowest. As in Fig. 2, the far left image per row is a T1W image, and the other five images (one T1W and four segmented gray matter images) are enlarged images. R score = 100 × (the gray matter volume inside manual ROI) / (size of manual ROI). The gray matter volume inside the manual ROIs was measured individually on segmented gray matter images. A low R score denotes large mis-segmentation. ROI, region of interest; T1W, T1-weighted.
R scores in the putamen.

Values are given as mean ± SD.
*R score = 100 × (the gray matter volume inside manual ROI) / (size of manual ROI). The gray matter volume inside the manual ROIs was measured individually on segmented gray matter images. A low R score denotes large mis-segmentation.
ROI, region of interest.
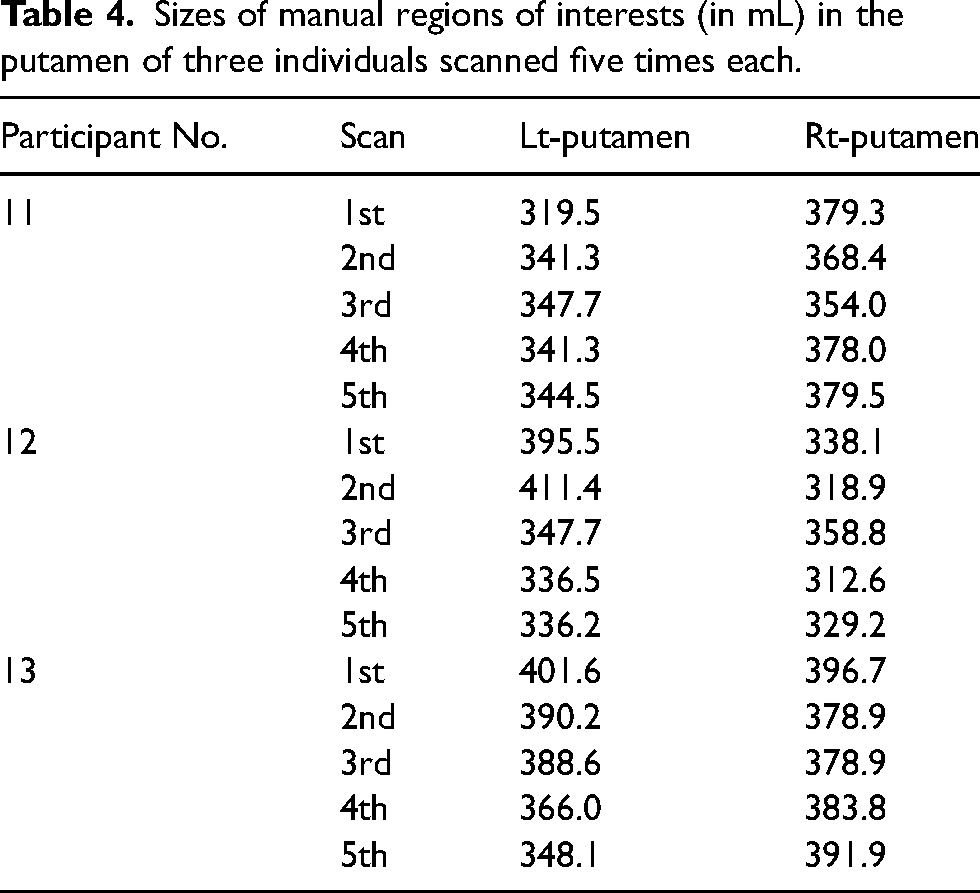
Sizes of the manual ROIs drawn on both sides of the putamen for evaluation of repeatability are shown in Table 4, and mean P scores are shown in Table 5. Significant differences were found for P scores (Table 5) between single- and multi-channel segmentations in repeated ANOVA (P < 0.05) of the Lt-putamen, but not in those of the Rt-putamen. After post-hoc tests of the Lt-putamen, significant differences were found as follows: single-channel (T1W) versus multi-channel (T1W + T2W); single-channel (T1W) versus multi-channel (T1W + PDW); multi-channel (T1W + T2W) versus multi-channel (T1W + PDW); multi-channel (T1W + T2W) versus multi-channel (T1W + T2W + PDW); and multi-channel (T1W + PDW) versus multi-channel (T1W + T2W + PDW).
Sizes of manual regions of interests (in mL) in the putamen of three individuals scanned five times each.
P scores* in the putamen.
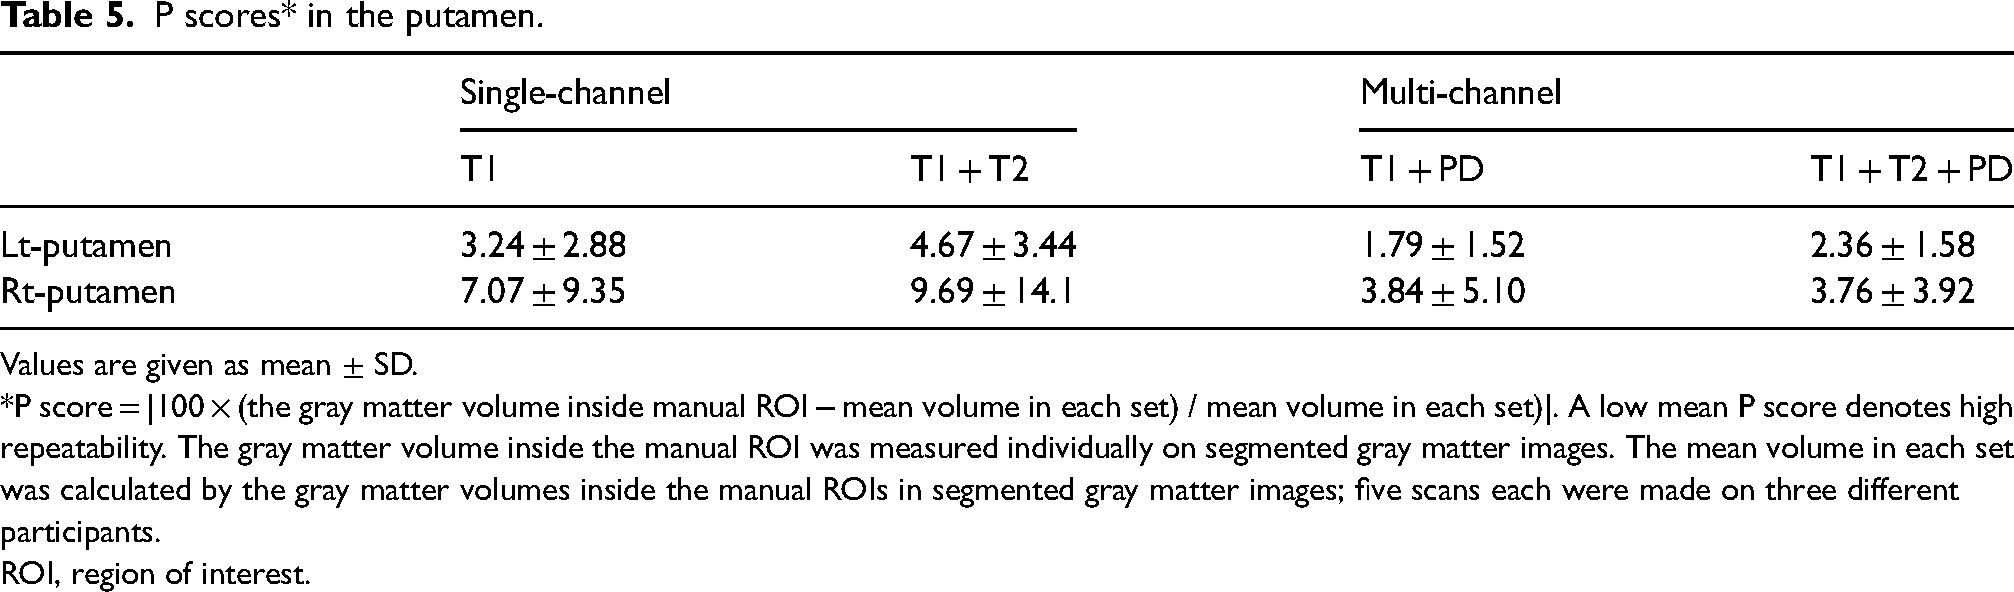
Values are given as mean ± SD.
*P score = |100 × (the gray matter volume inside manual ROI − mean volume in each set) / mean volume in each set)|. A low mean P score denotes high repeatability. The gray matter volume inside the manual ROI was measured individually on segmented gray matter images. The mean volume in each set was calculated by the gray matter volumes inside the manual ROIs in segmented gray matter images; five scans each were made on three different participants.
ROI, region of interest.
Discussion
The present study demonstrates threefold results: (i) mis-segmentations in both transverse sinus and cavernous sinus were large in single-channel (T1W) segmentation; (ii) accuracy of segmented gray matter images in the putamen was low in multi-channel (T1W + T2W) segmentation; and (iii) the highest repeatability of Lt-putamen volumetry was found with multi-channel segmentation (T1W + PDW). Based on these results, VBM with multi-channel segmentation (T1W + PDW) using synthetic MRI provides good results of segmented gray matter images and does not contain the common important problems of additional image scan time or misalignment between different image scans seen in multimodal segmentation.
In both the transverse sinus and cavernous sinus, decreased mis-segmentation in multi-channel segmentation compared with single-channel segmentation is consistent with previous reports with multimodal segmentation that showed decreased mis-segmentation in blood vessels and dura matter (13,14). This mis-segmentation is due to the similar intensity of the signal from both sinuses and gray matter on T1W imaging. Therefore, mis-segmentation was decreased by adding a contrast image (i.e. T2W imaging, PDW imaging) with a large difference in signal intensity between sinuses and gray matter. In our study, PDW and T2W imaging contained sufficiently high signal intensity in sinuses compared with gray matter (see transverse sinus in Fig. 1).
The highest mean R scores (superior accuracy) in the putamen were found in multi-channel (T1W + PDW) segmentation, and the lowest mean R scores (inferior accuracy) were found in multi-channel (T1W + T2W) segmentation. In the putamen, we often found mis-segmentation in segmented gray matter images with SPM software because there is a difference in signal intensity between the anterior and posterior portions of the putamen. Large mis-segmentation in the posterior portion of the Rt-putamen was also observed in segmented gray matter images with Participant 12 (see Fig. 4). This mis-segmentation was decreased in multi-channel segmentation (T1W + PDW and T1W + T2W + PDW) but was increased in multi-channel segmentation (T1W + T2W) compared with single-channel segmentation. A previous report with multimodal segmentation using FLAIR imaging showed a shift in segmentation from gray matter images to white matter images in the posterior portion of the putamen (14). Our result coincides with this previous report because a voxel with a short T2 relaxation time is indicated by low signal intensity on T2W and FLAIR images. Iron deposition contributes to shortening of T2 relaxation time, and iron deposition in the brain increases with age (24–26). Moreover, high amounts of iron deposition were found in the posterior portion of the putamen compared with the anterior portion (27). Non-uniformity of iron deposition may contribute to non-uniformity of signal intensity in the putamen on T1W, T2W, and FLAIR images. Mis-segmentation in SPM software was found in the posterior portion of the putamen; thus, increases in mis-segmentation in the putamen may reflect the signal intensity changes on MR images related to iron deposition. By contrast, signal intensity on PDW imaging is not greatly influenced by iron deposition because PDW imaging was obtained with shorter TE and longer TR compared with the TE of T2W imaging and the TR of T1W imaging. Therefore, because the uniformity of signal intensity of the putamen on PDW imaging is higher than that of T2W and T1W imaging, mis-segmentation was decreased in multi-channel segmentation using PDW imaging. To our knowledge, multimodal segmentation using PDW imaging for the putamen has not yet been reported; only one study reports multimodal segmentation using PDW imaging for the brainstem (28).
In the study of the putamen, we found a relation between low mean R score (large mis-segmentation) (Table 3) and high mean P score (low repeatability) (Table 5). We hypothesized that the lack of significant differences of repeatability in the Rt-putamen is due to the large standard deviation of the mean P score for this area, most likely because of Participant 12. This participant is one of only three individuals used for calculating mean P scores. Participant 12 had the lowest R score with single-channel segmentation in the Rt-putamen of all 13 participants, and thus increased the mean P score and its standard deviation. We speculate that if Participant 12 had shown a higher R score, a significant difference might have been found in mean P scores of the Rt-putamen. As a high mean P score (low repeatability) hid any putative significant difference between repeatability of single- and multi-channel segmentation in the Rt-putamen, low repeatability of segmented gray matter images in the putamen may reduce the sensitivity of volume differences in VBM results. Many previous studies with VBM have reported gray matter atrophy in parkinsonian syndromes, and meta-analysis showed significant gray matter volume reduction in the anterior portion of the putamen (29). In this meta-analysis report, there was no discussion about insignificant gray matter volume reduction in the posterior portion. Moreover, in a previous study, significant gray matter volume reduction in the anterior portion of the putamen was found in a VBM study with early-onset Parkinson's disease and controls, and there was also no discussion about insignificant gray matter volume reduction in the posterior portion (30). In the future, VBM with multi-channel segmentation (T1W + PDW) in patients with Parkinson's disease and controls may identify whether a significant volume reduction exists in the posterior portion of the putamen.
The present study has some limitations. A major limitation is that our results were influenced by the image quality of synthetic MR images. Image quality was affected by SyMRI software. Many previous reports with multimodal segmentation used FLAIR images and yielded good results of gray matter segmentation (13,14). However, segmented gray matter image with multi-channel (T1W + FLAIR) segmentation had very poor results in our preliminary study. This mismatch is likely because synthetic FLAIR images are of lower quality than conventional FLAIR images (31). Recently, some study reported that deep learning improves the quality of synthetic FLAIR images (31,32). The second limitation is that the accuracy of the segmented gray matter in the whole brain was not evaluated, and our study focused only the putamen. There may be areas where accuracy was decreased by using multi-channel segmentation. Unfortunately, we were unable to determine the most accurate method for gray matter segmentation because we have no gold standard for gray matter in the whole brain. The third limitation is that we used synthetic MR images with 1.3 × 1.3 × 1.3 mm. The voxel size is smaller than that of spatially normalized gray matter image in SPM processing (i.e. 1.5 × 1.5 × 1.5 mm) but is bigger than that in FreeSurfer processing (i.e. 1.0 × 1.0 × 1.0 mm). If we obtain data with 1.0 × 1.0 × 1.0 mm, it takes about 20 min. A long acquisition time increases adverse impact as motion artifacts.
In conclusion, we show the following: (i) mis-segmentations in both transverse sinus and cavernous sinus were large in single-channel (T1W) segmentation compared with multi-channel segmentations; (ii) accuracy of segmented gray matter images in the putamen was high in both multi-channel segmentations (T1W + PDW and T1W + T2W + PDW) compared with other segmentations; and (iii) the repeatability of the Lt-putamen volumetry was the highest with multi-channel segmentation (T1W + PDW). Multi-channel segmentation (T1W + PDW) may provide results with better quality for VBM compared with single-channel (T1W) and multi-channel (T1W + T2W and T1W + T2W + PDW) segmentation, and does not demonstrate the usual multimodal segmentation problems of additional image scan time and misalignment between different image scans.
Footnotes
Acknowledgements
This work was supported by JSPS KAKENHI: Grant Number JP20K08057.
Declaration of conflicting interests
The author(s) declared no potential conflicts of interest with respect to the research, authorship, and/or publication of this article.
Funding
The author(s) received no financial support for the research, authorship, and/or publication of this article.