



Abstract
Background
Non-invasive biomarkers for early chemotherapeutic response in Ewing sarcoma family of tumors (ESFT) are useful for optimizing existing treatment protocol.
Purpose
To assess the role of diffusion-weighted magnetic resonance imaging (MRI) in the early evaluation of chemotherapeutic response in ESFT.
Material and Methods
A total of 28 patients (mean age = 17.2 ± 5.6 years) with biopsy proven ESFT were analyzed prospectively. Patients underwent MRI acquisition on a 1.5-T scanner at three time points: before starting neoadjuvant chemotherapy (baseline), after first cycle chemotherapy (early time point), and after completion of chemotherapy (last time point). RECIST 1.1 criteria was used to evaluate the response to chemotherapy and patients were categorized as responders (complete and partial response) and non-responders (stable and progressive disease). Tumor diameter, absolute apparent diffusion coefficient (ADC), and normalized ADC (nADC) values in the tumor were measured. Baseline parameters and relative percentage change of parameters after first cycle chemotherapy were assessed for early detection of chemotherapy response.
Results
The responder:non-responder ratio was 21:7. At baseline, ADC ([0.864 ± 0.266 vs. 0.977 ± 0.246]) × 10−3mm2/s; P = 0.205) and nADC ([0.740 ± 0.254 vs. 0.925 ± 0.262] × 10−3mm2/s; P = 0.033) among responders was lower than the non-responders and predicted response to chemotherapy with AUCs of 0.6 and 0.735, respectively. At the early time point, tumor diameter (27% ± 14% vs. 4.6% ± 10%; P = 0.002) showed a higher reduction and ADC (75% ± 44% vs. 52% ± 72%; P = 0.039) and nADC (81% ± 44% vs. 48% ± 67%; P = 0.008) showed a higher increase in mean values among responders than the non-responders and identified chemotherapy response with AUC of 0.890, 0.723, and 0.756, respectively.
Conclusion
Baseline nADC and its change after the first cycle of chemotherapy can be used as non-invasive surrogate markers of early chemotherapeutic response in patients with ESFT.
Keywords
Introduction
Ewing sarcoma family of tumors (ESFT) is the second most common primary malignant bone tumor in children and young adults next only to osteosarcoma and has an incidence of 2.97 per million (1). ESFT is a group of cancers sharing common phenotypes, molecular features, and management strategy. This group includes osseous and extraosseous Ewing sarcoma, peripheral primitive neuroectodermal tumor, and Askin tumor; osseous Ewing sarcoma is the most common among the group. Almost 25% of patients with ESFT present with metastasis at the time of diagnosis; the most common sites of metastasis being lungs and bones (1). Clinically ESFT is treated with systemic neoadjuvant chemotherapy to reduce primary tumor size and remove micrometastasis followed by surgery or radiotherapy or a combination of both (2–4). The prognosis of ESFT depends on the size of the primary tumor at presentation and the presence of any metastasis. Overall, five-year disease-free survival is in the range of 61%–67% (5,6).
Traditionally, the assessment of chemotherapy response is done by evaluating the change in the size of the mass on computed tomography (CT) or magnetic resonance imaging (MRI) scan based on the RECIST 1.1 criteria (7) or by histology of the resected tumor. However, a change in size of the mass might take much longer whereas the actual response to chemotherapy may occur earlier. Early assessment of response to treatment helps to prevent the non-responders from undergoing the entire treatment and can direct the patient to an alternate therapeutic option. Early non-invasive assessment of tumor response to treatment before the size change occurs can be done using new functional MRI techniques such as diffusion-weighted imaging (DWI) (8,9).
DWI evaluates the diffusion of water molecules (Brownian motion) in the tissues and has been used in various tumors for the detection, characterization, and evaluation of treatment response with promising results (10–12). The extent of diffusion in tissues can be quantified and is expressed as apparent diffusion coefficient (ADC). Restriction of diffusion is seen as an increased signal on the trace DW image and reduction in the ADC value and vice versa (10). In malignant lesions, because of increased cellularity, the extracellular space is reduced causing restriction of diffusion. Studies in osteosarcoma, colorectal cancers, and colorectal hepatic metastases have shown that cellular tumors with low pretreatment ADC values respond better to chemotherapy than those necrotic tumors exhibiting high pretreatment ADC values (13). Anticancer treatment results in tumor lysis, loss of cell membrane integrity, and increased extracellular space therefore leading to increased diffusion and ADC (12). Studies have shown that patients who respond to chemotherapy show a significant rise in ADC after starting treatment (10–19). Therefore, this study was undertaken to assess the role of DWI in the early evaluation of chemotherapy response in ESFT using correlation with RECIST 1.1 criteria as the standard measurement for chemotherapeutic response.
Material and Methods
Sample size
A similar prospective study on chemotherapy response evaluation using DWI in bone tumors have reported a response group ratio of 10:21 (good-responder:poor-responder), where pre-chemotherapy ADC per unit volume predicted good histological response with an area under the curve (AUC) of 86% (19). Taking these values as prior art, in order to achieve an AUC of 0.8 with a 20% absolute error margin in a two-sided 95% confidence interval and dropout rate of 15%, a total of 37 cases were needed to be recruited.
Study group
Patients presenting with biopsy proven ESFT involving bone and soft tissue were considered for this study. A total of 38 patients were recruited prospectively according to the inclusion and exclusion criteria of the institutional ethics committee approval after taking informed consent from all patients. Inclusion criteria included treatment-naïve patients with biopsy proven ESFT with localized as well as metastatic disease who were planned for neoadjuvant chemotherapy and aged eight years or older. Malignant round cell tumors with classical histomorphology and strong membrane immunopositivity with MIC2 were included. The exclusion criteria included recurrent disease after successful previous treatment and any contraindications to MRI. Cases with atypical morphology, such as spindle cell differentiation and variable, weak or absent MIC2 immunopositivity, were excluded.
Treatment protocol
Patients received a neoadjuvant chemotherapy cycle—VAC (Vincristine, Doxorubicin/Actinomycin-D, Cyclophosphamide) alternated with IE (Ifosfamide, Etoposide)—with a three-week interval between each cycle for five complete cycles (i.e. 12 weeks). After completion of five cycles of chemotherapy if the tumor was operable, definitive surgery was planned; otherwise, chemotherapy/chemoradiotherapy was planned.
MRI acquisition
MRI acquisition was performed on a 1.5-T scanner (Achieva; Philips, Best, Netherlands ) using extremity and/or torso coils with the patient in the supine position. Conventional MRI (T1-weighted and T2-weighted [T2W]) along with DW scan was done at three time points: first, within seven days before starting chemotherapy (baseline); second, after one week of receiving the first cycle of chemotherapy (early time point); and third, after completion of five cycles of chemotherapy (last time point). Baseline MRI was performed in all 38 patients. Of the 38 patients, four patients died after the first cycle of chemotherapy due to advanced disease and six patients dropped out. Hence, 28 patients who completed the full chemotherapy regimen were included in the analysis. DWI sequence was acquired using free breathing spin-echo echo planar imaging (SE-EPI) using parallel imaging at b-values of 0, 100, 500, and 1000 s/mm2 and diffusion-sensing gradients were applied in all three orthogonal planes.
Size parameters
The largest diameter of the extraosseous soft-tissue component of the primary tumor was measured as per RECIST 1.1 criteria on axial images at three time points. The percentage size change between baseline and early time point (Δ%SE) and percentage size change between baseline and late time point (Δ%SL) were evaluated using the equation:

Diffusion-weighted MRI
DWI was viewed on a PACS workstation (Syngo.via; Siemens, Erlangen, Germany). ADC maps were derived automatically using all b-values on a voxel-by-voxel basis. Absolute ADC value in tumor mass was calculated by drawing a freehand region of interest (ROI) on the section with the largest diameter of the mass covering the entire lesion including the solid and necrotic parts on b = 1000 s/mm2 DWI, which was then automatically transferred to the ADC map with reference to the structural T2W images. Images of ROI placement and ADC calculation from a representative patient are depicted in Fig. 1. Normalized ADC (nADC) was calculated by obtaining the ratio of tumor and muscle ADC (20,21). Muscle ADC was calculated by placing a 10-mm2 ROI on adjacent uninvolved segments of skeletal muscle.
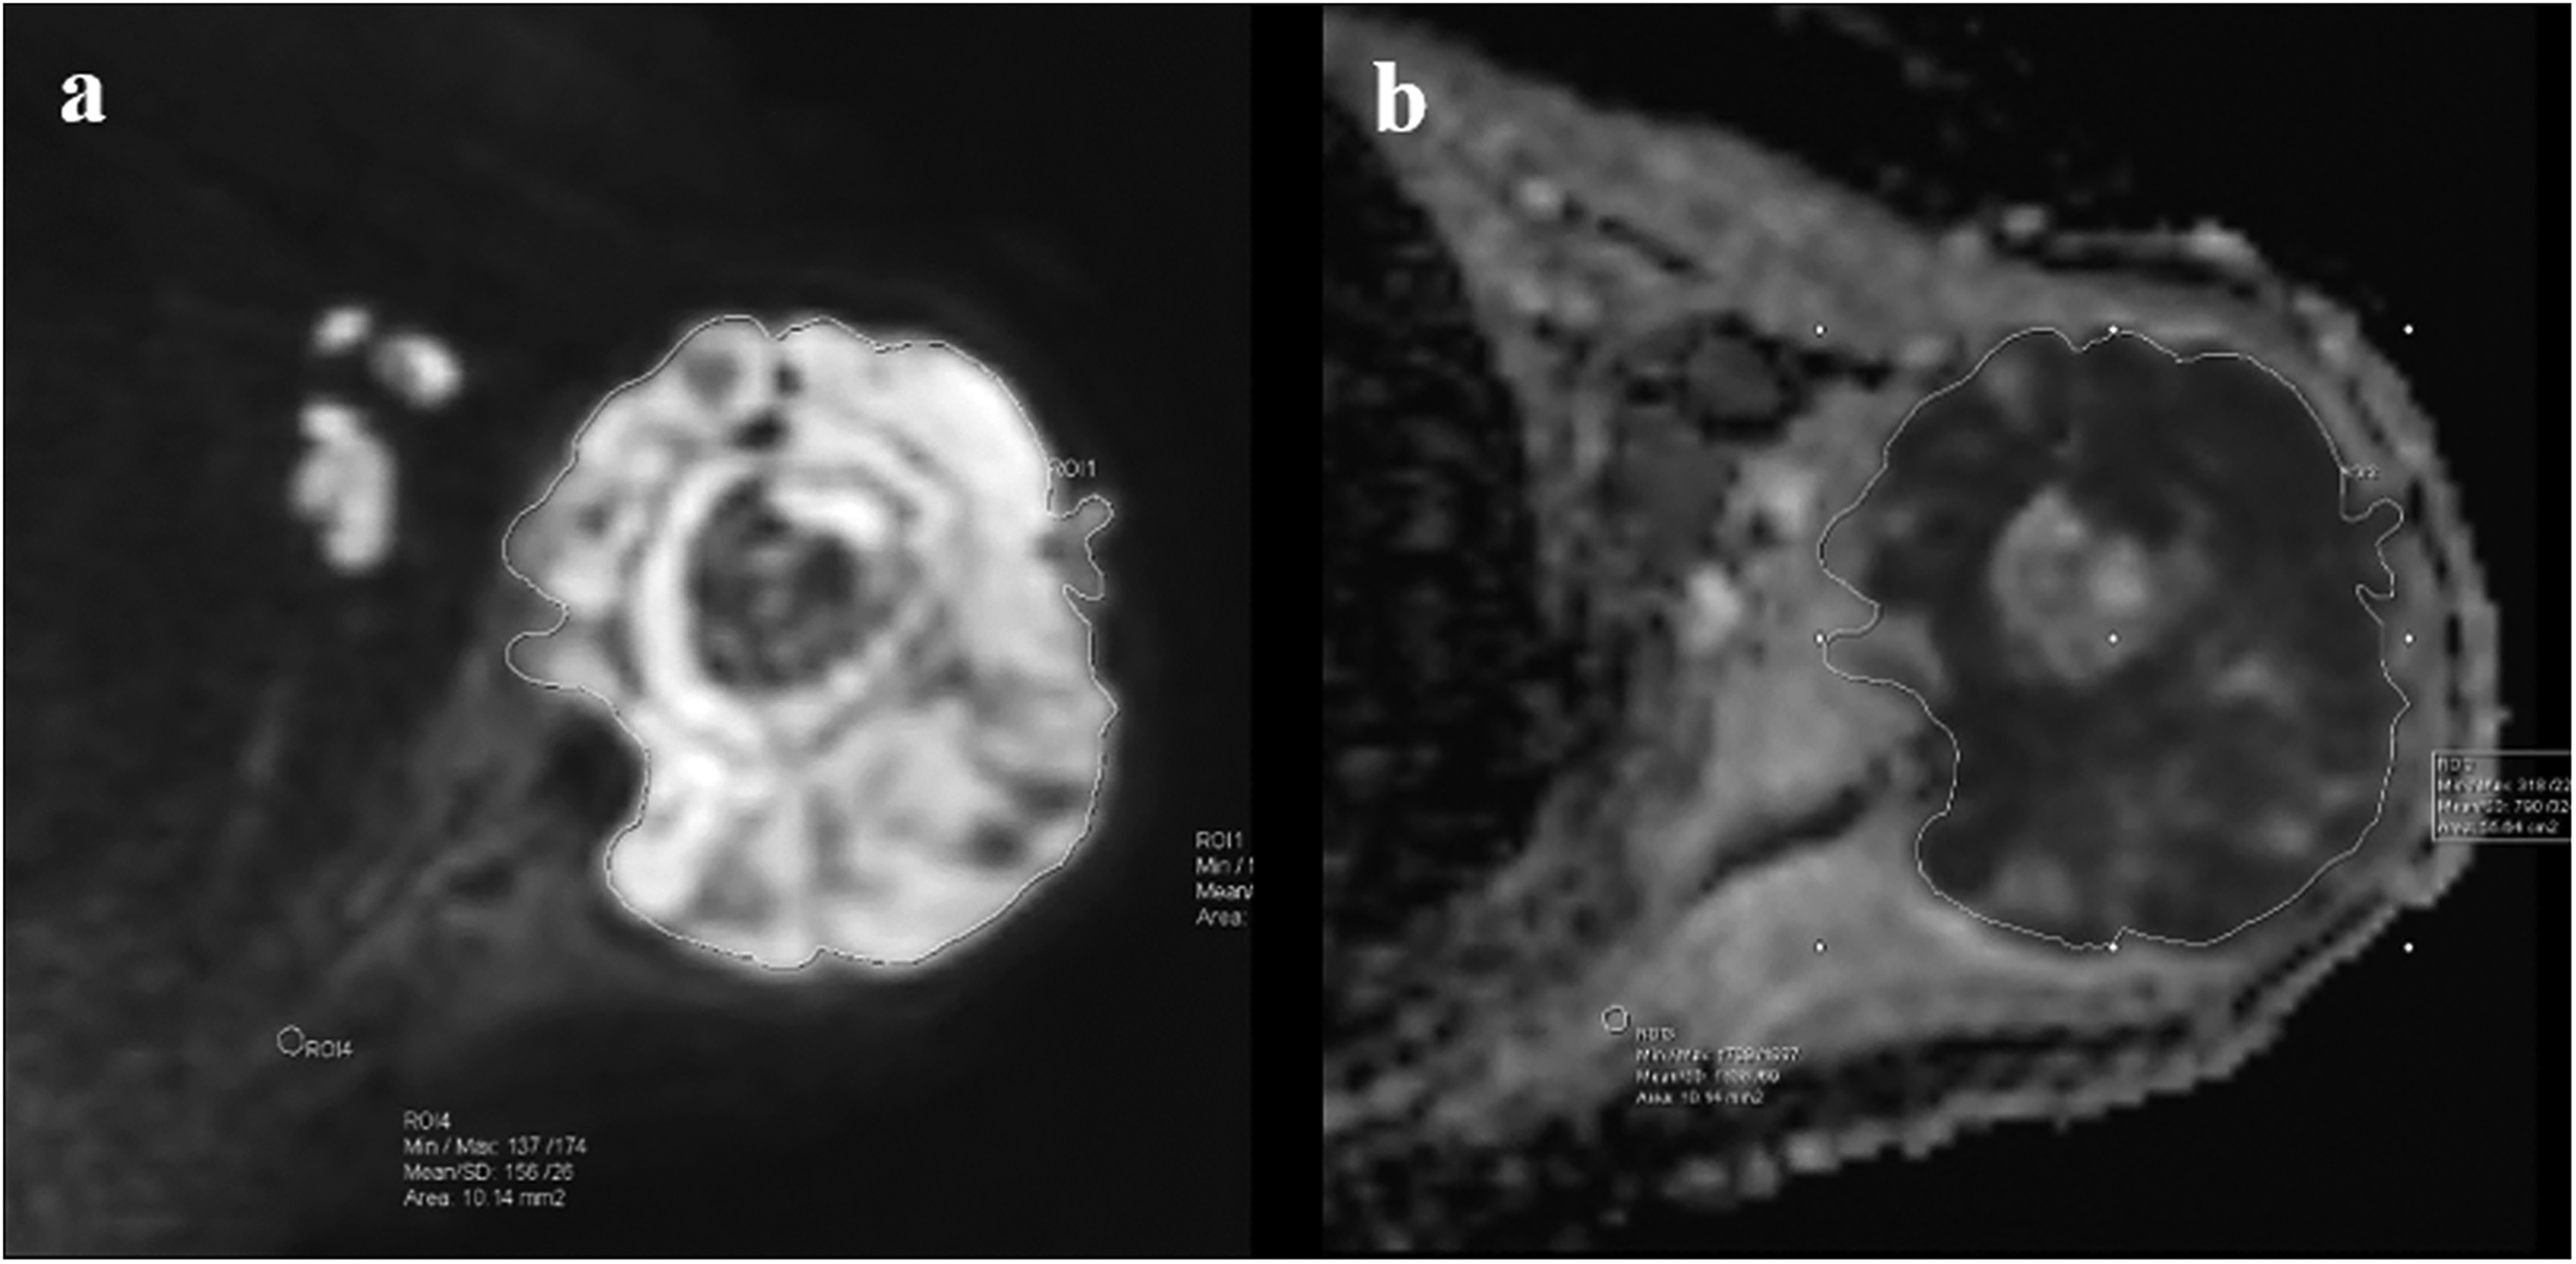
DW images showing measurement of normalized ADC in a patient with left humeral ESFT. (a) b-1000 image showing freehand ROI placement over the lesion. (b) Transfer of the ROI to the corresponding ADC map. Another small 10-mm2 ROI placed over a normal adjacent skeletal muscle to calculate normalized ADC. ADC, apparent diffusion coefficient; DW, diffusion-weighted; ESFT, Ewing sarcoma family of tumors; ROI, region of interest.
The ADC and nADC in lesions were calculated at baseline (ADCB, nADCB) and early time point (ADCE, nADCE). At the early time point, absolute change in ADC (ΔADCE), absolute change in nADC (ΔnADCE), percentage change in ADC (Δ%ADCE), and percentage change in nADC (Δ%nADCE) were calculated as follows:




Evaluation of response to chemotherapy
Of the 28 patients, only four patients underwent surgery; the others did not undergo surgery due to either the presence of metastasis, locally advanced disease, poor performance status, or the location of the tumor precluding them from a curative resection. Therefore, response evaluation was performed using RECIST 1.1 criteria (7) (Supplemental Table 1). Patients with partial response (PR) and complete response (CR) were categorized as responders, patients with stable disease (SD) and progressive disease (PD) were categorized as non-responders, similar to earlier published studies (22,23).
Statistical analysis
Baseline parameters and change in the parameters after one cycle of chemotherapy were assessed for early detection of chemotherapy response. Inter-group comparison of parameters between responders and non-responders was performed using the Mann–Whitney U test. Intra-group comparison of parameters between baseline and the early time point was performed using the Wilcoxon signed-rank test. Box and whisker plots were drawn to highlight the variation of parameters. Receiver operating characteristics (ROC) curve analysis was used to assess the predictability of chemotherapy response by quantitative parameters and the best threshold(s) with the highest sum of sensitivity and specificity for predicting responders was generated. Data were analyzed using STATA 12.1 and a P value of 0.05 was considered statistically significant.
Results
Demographics and tumor characteristics
Patients’ demographics and characteristics of ESFT are summarized in Table 1. The age of the study population was in the range of 8–35 years (mean age = 17.2 ± 5.6 years). Male predominance was noted (male:female = 26 [68%]:12 [32%]). Pain (n = 34, 89%) and swelling (n = 29, 76%) were the most common and second most common presenting complaints and swelling associated with pain was seen in 24 (63%) patients. Systemic symptoms such as fever or weight loss were seen in 10 (26%) patients, while history of trauma was present in 5 (13%) and pathological fracture was noted in 3 (7%) patients. Out of 38 patients, 34 (89%) had a primary osseous tumor and the remaining 4 (11%) had extraosseous Ewing sarcoma. Extraosseous Ewing sarcomas were noted in the left thigh, presacral, left hand, and in the neck region with no adjacent bone abnormality. Flat and long bones were involved in 16 (42%) and 18 (47%) patients, respectively. The pelvic bone (26%) and humerus (21%) were the most common and second most common sites of involvement, respectively. Other bones involved were the radius, ulna, tibia, sternum, and scapula. Out of 38 patients, 23 (60.5%) had distant metastatic disease at presentation and 15 (39.5%) had localized disease. Lung metastasis was the most common, seen in 15 (39%) patients, while skeletal metastasis was seen in 9 (23%) and bone marrow aspirate was positive in 8 (21%) patients.
Patient demographics and characteristics of ESFT.
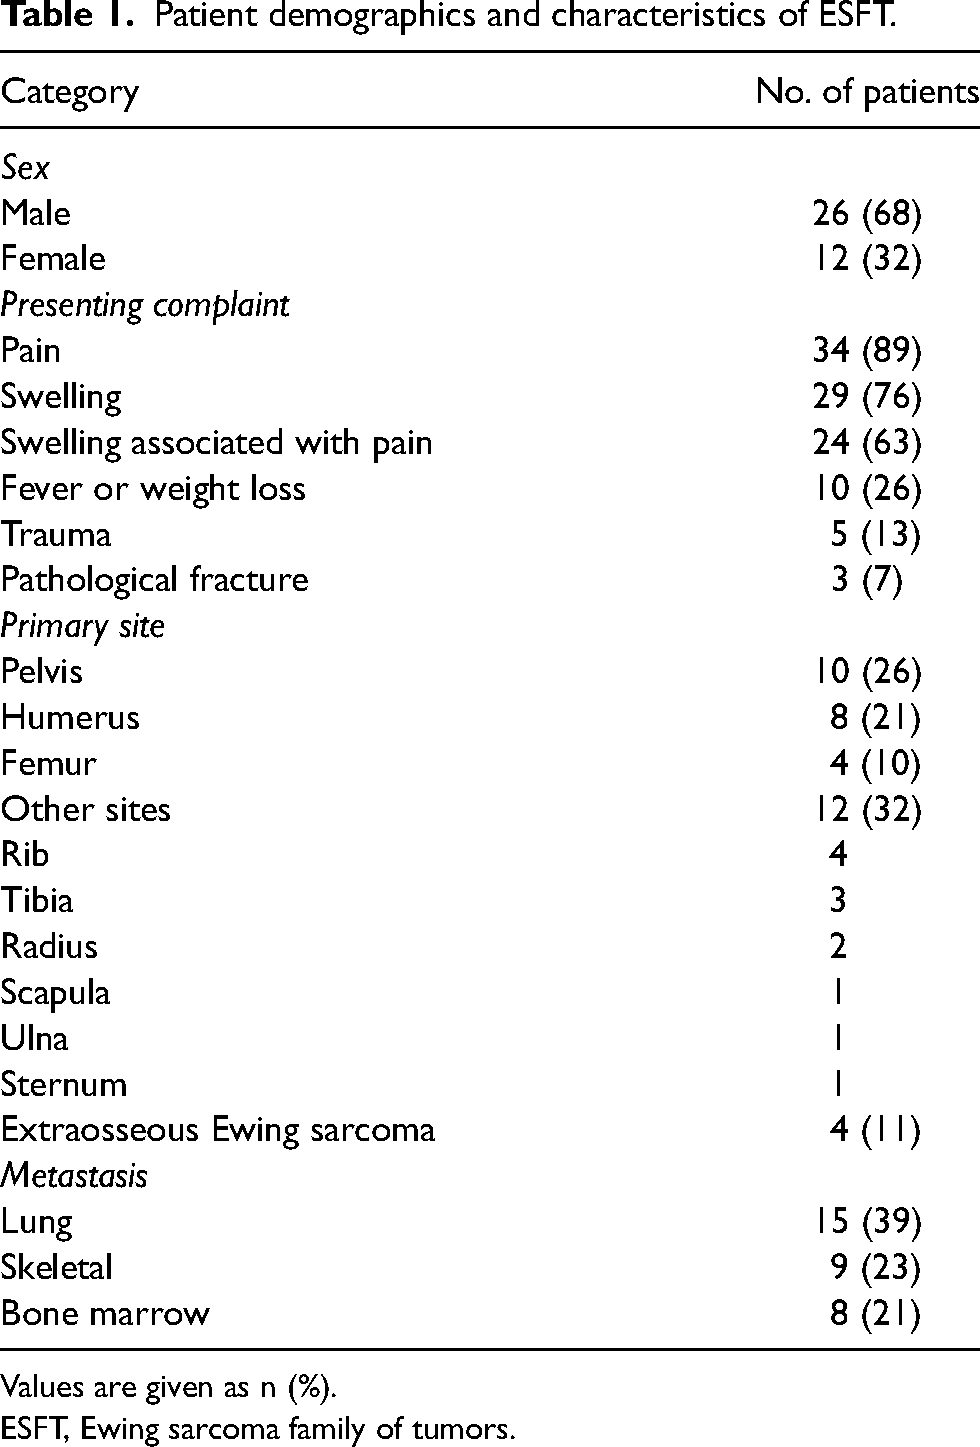
Values are given as n (%).
ESFT, Ewing sarcoma family of tumors.
Evaluation of neoadjuvant chemotherapy response using RECIST 1.1
Based on the RECIST 1.1 score presented in Table 2, 21 were responders (CR = 2, PR = 19) and seven were non-responders (SD = 6, PD = 1).
Treatment response in study population (RECIST 1.1).

Tumor size at baseline and follow-up
The mean tumor size among 28 patients was 8.44 ± 3.79 cm at baseline, decreasing to 6.80 ± 3.34 cm at the early time point, and further decreasing to 5.15 ± 3.20 cm at the last time point. Among responders and non-responders, the mean tumor size at baseline and its percentage changes at the early time point (Δ%SE) and last time point (Δ%SL) are presented in Table 3. Mean Δ%SE in responders (27% ± 14%) was significantly higher (P = 0.002) compared with non-responders (4.6% ± 10%). Box and whisker plots in Fig. 2 show the distribution of tumor size among responders and non-responders at baseline and the early time point.
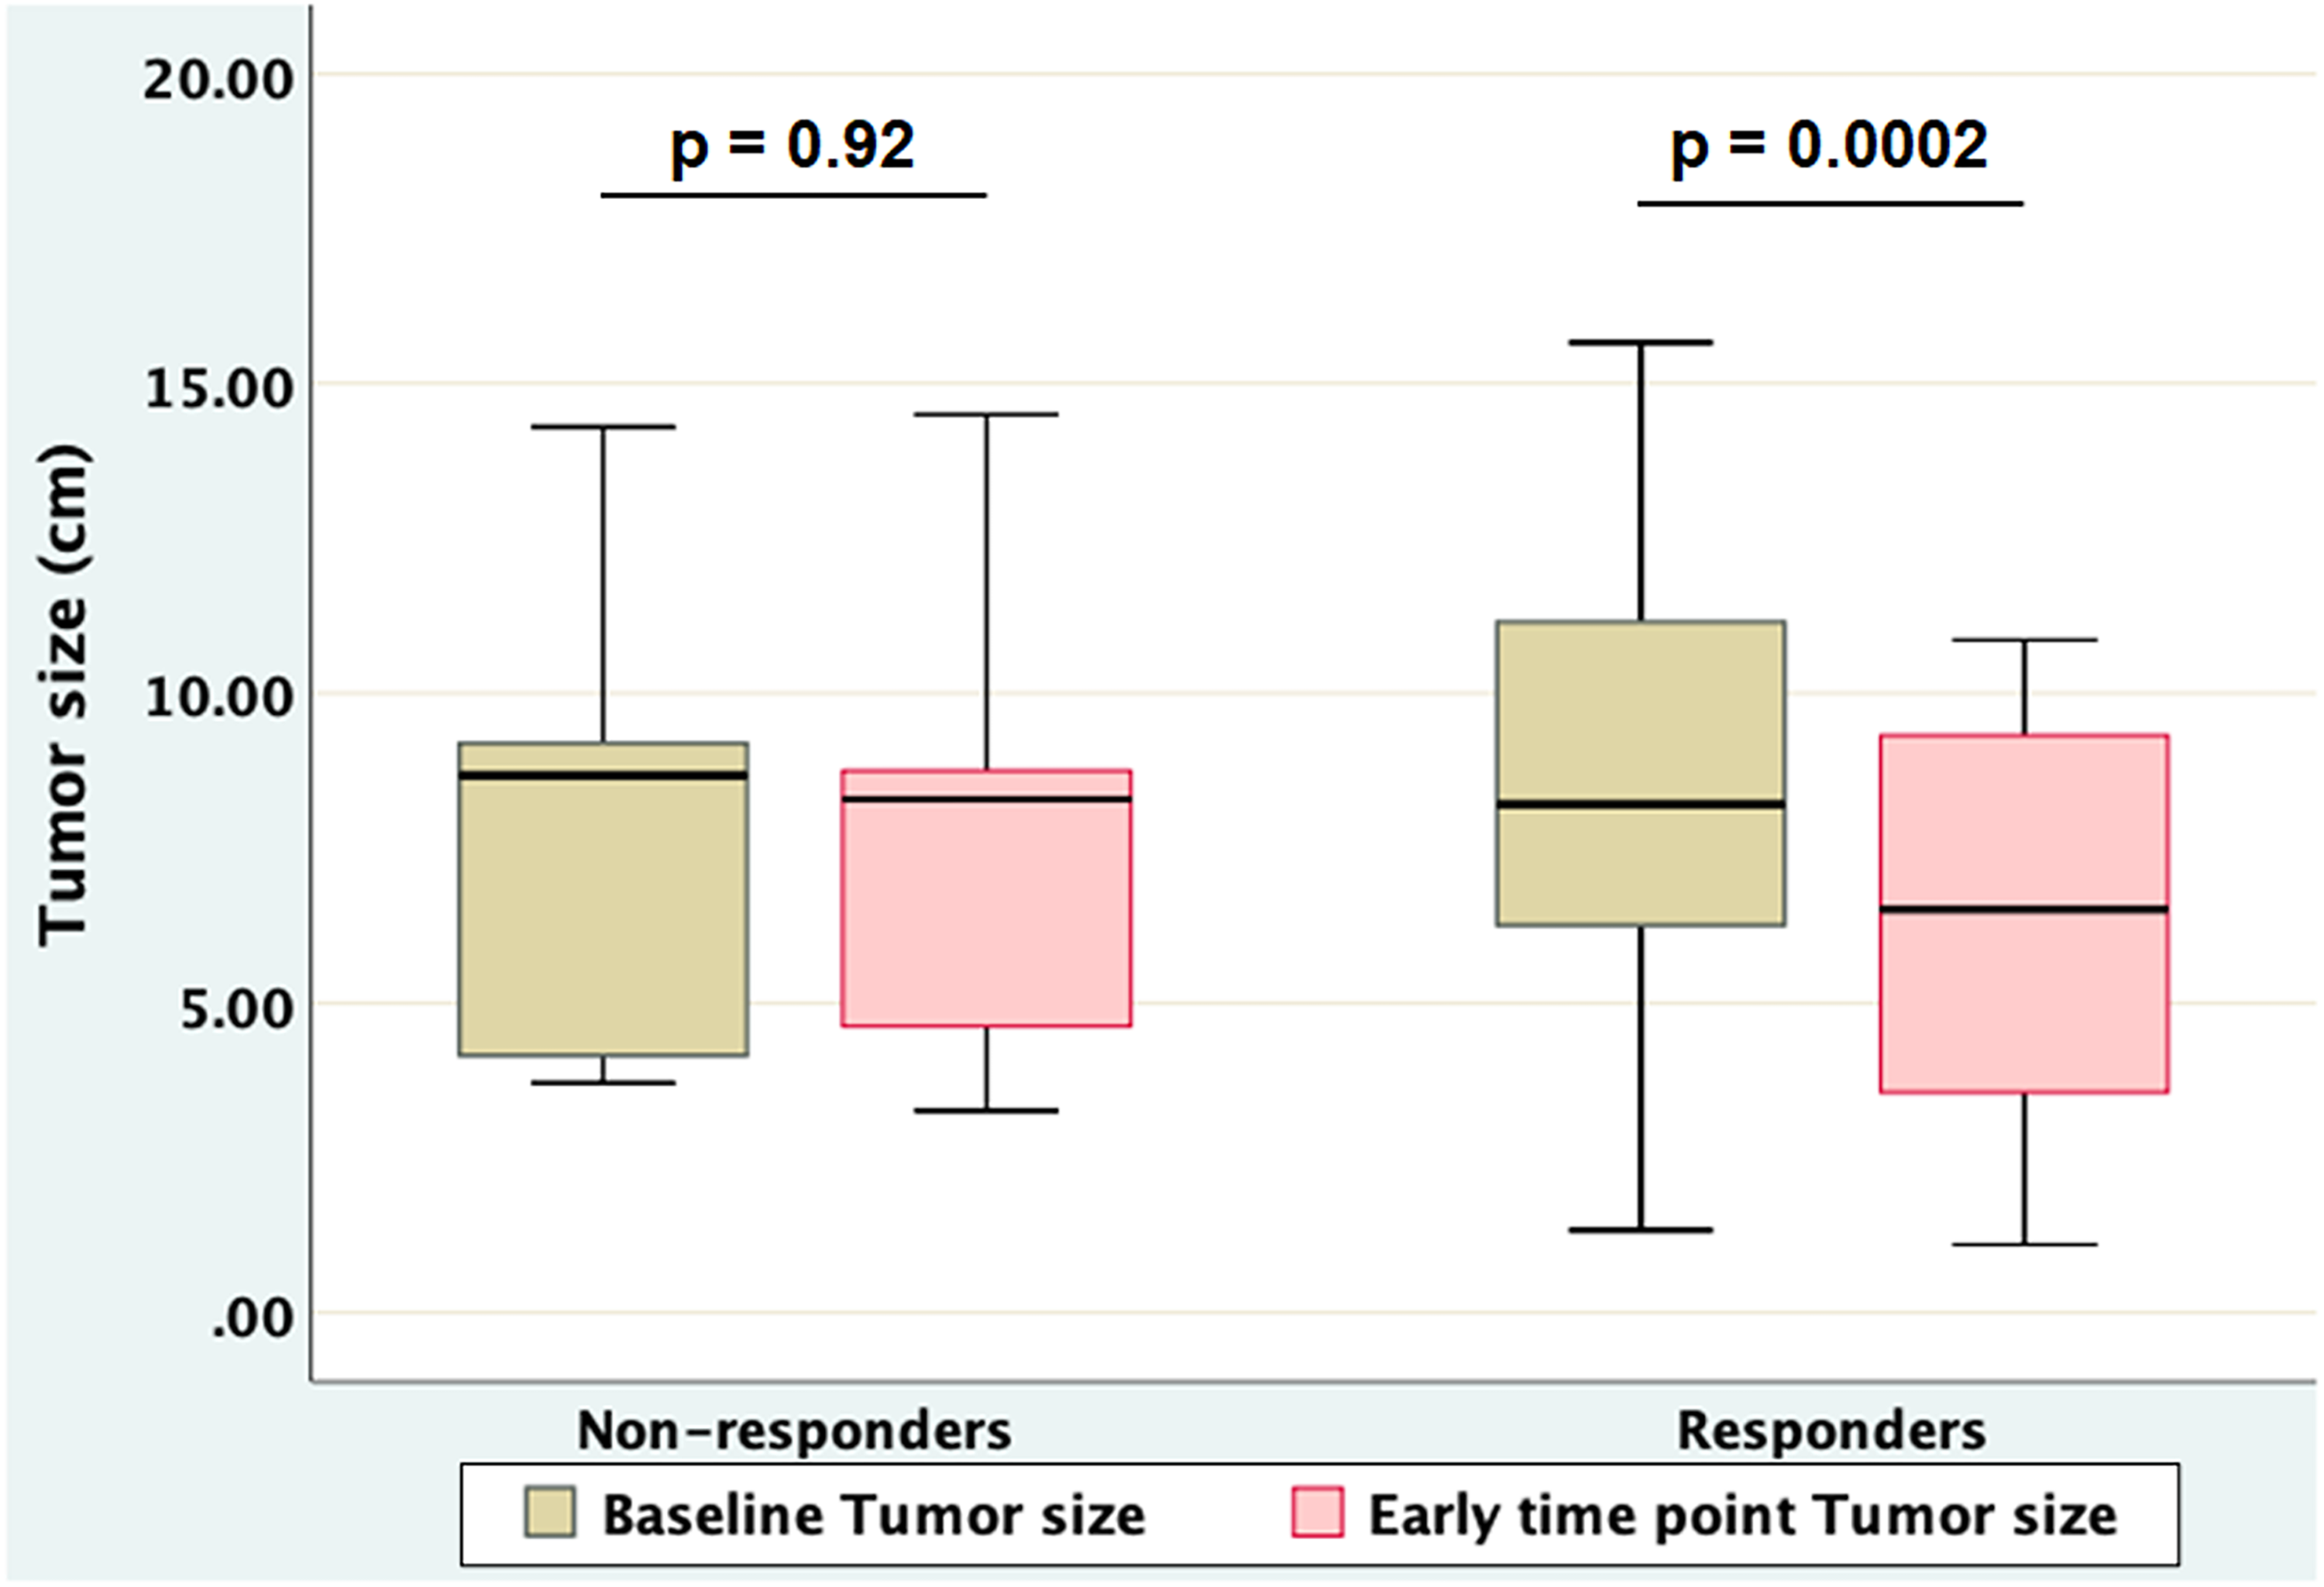
Box and whisker plots of tumor size of responders and non-responders at baseline (SB) and early time point (SE): shows considerable overlap between baseline and early time point tumor sizes among non-responders. There is a significant difference between baseline and early time point tumor sizes among responders.
Tumor size among responders and non-responders at baseline (SB) and mean percentage size changes at early time point (Δ%SE) and last time point (Δ%SL).

Values are given as mean ± SD. Significant P values (P < 0.05) are in bold.
DWI at baseline and early time point
Among responders and non-responders, ADC and nADC at baseline and their absolute and percentage changes at the early time point are presented in Table 4.
Values of baseline ADC, baseline nADC, absolute change in ADC and nADC at early time point, and percentage change in ADC and nADC at early time point.
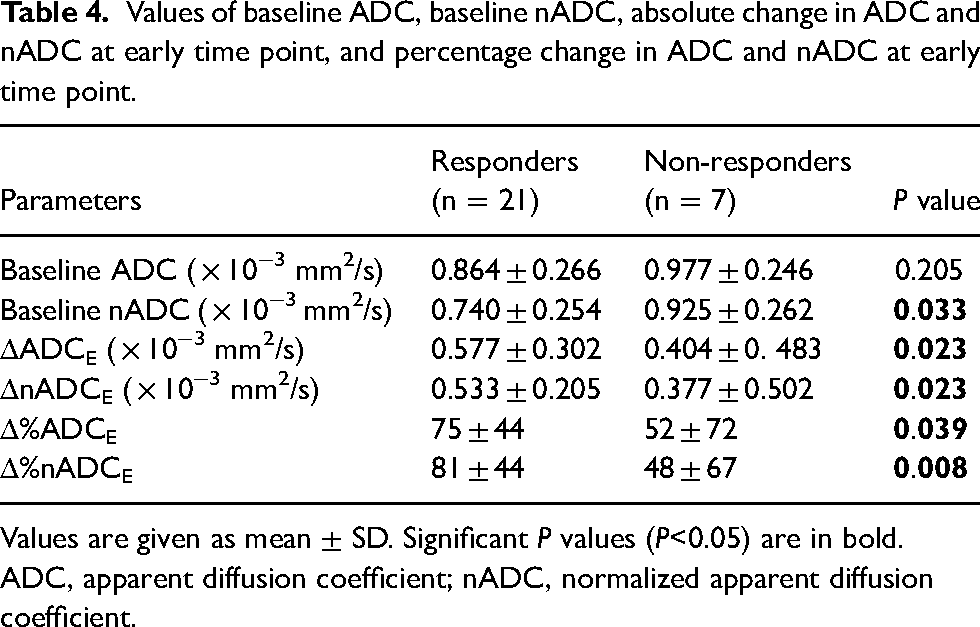
Values are given as mean ± SD. Significant P values (P<0.05) are in bold.
ADC, apparent diffusion coefficient; nADC, normalized apparent diffusion coefficient.
At baseline, comparatively lower mean ADC ([0.864 ± 0.266 vs. 0.977 ± 0.246) × 10−3mm2/s; P = 0.205) and significantly lower mean nADC ([0.740 ± 0.254 vs. 0.925 ± 0.262] × 10−3mm2/s; P = 0.033) were observed among responders compared to the non-responders.
At an early time point, ADC and nADC were observed to be increased among both the groups; however, a significant increase in mean nADC (Δ%nADCE) was noted (81% ± 44%; P < 0.0001) among responders, while non-responders did not show any significant change (48% ± 67%; P = 0.078). Box and whisker plots in Fig. 3 depict the distribution of nADC values in responder and non-responder groups at baseline and early time points. DWI b = 1000 s/mm2 and corresponding ADC map of a representative patient from each of the responder and non-responder groups are presented in Fig. 4 and Fig. 5, respectively.
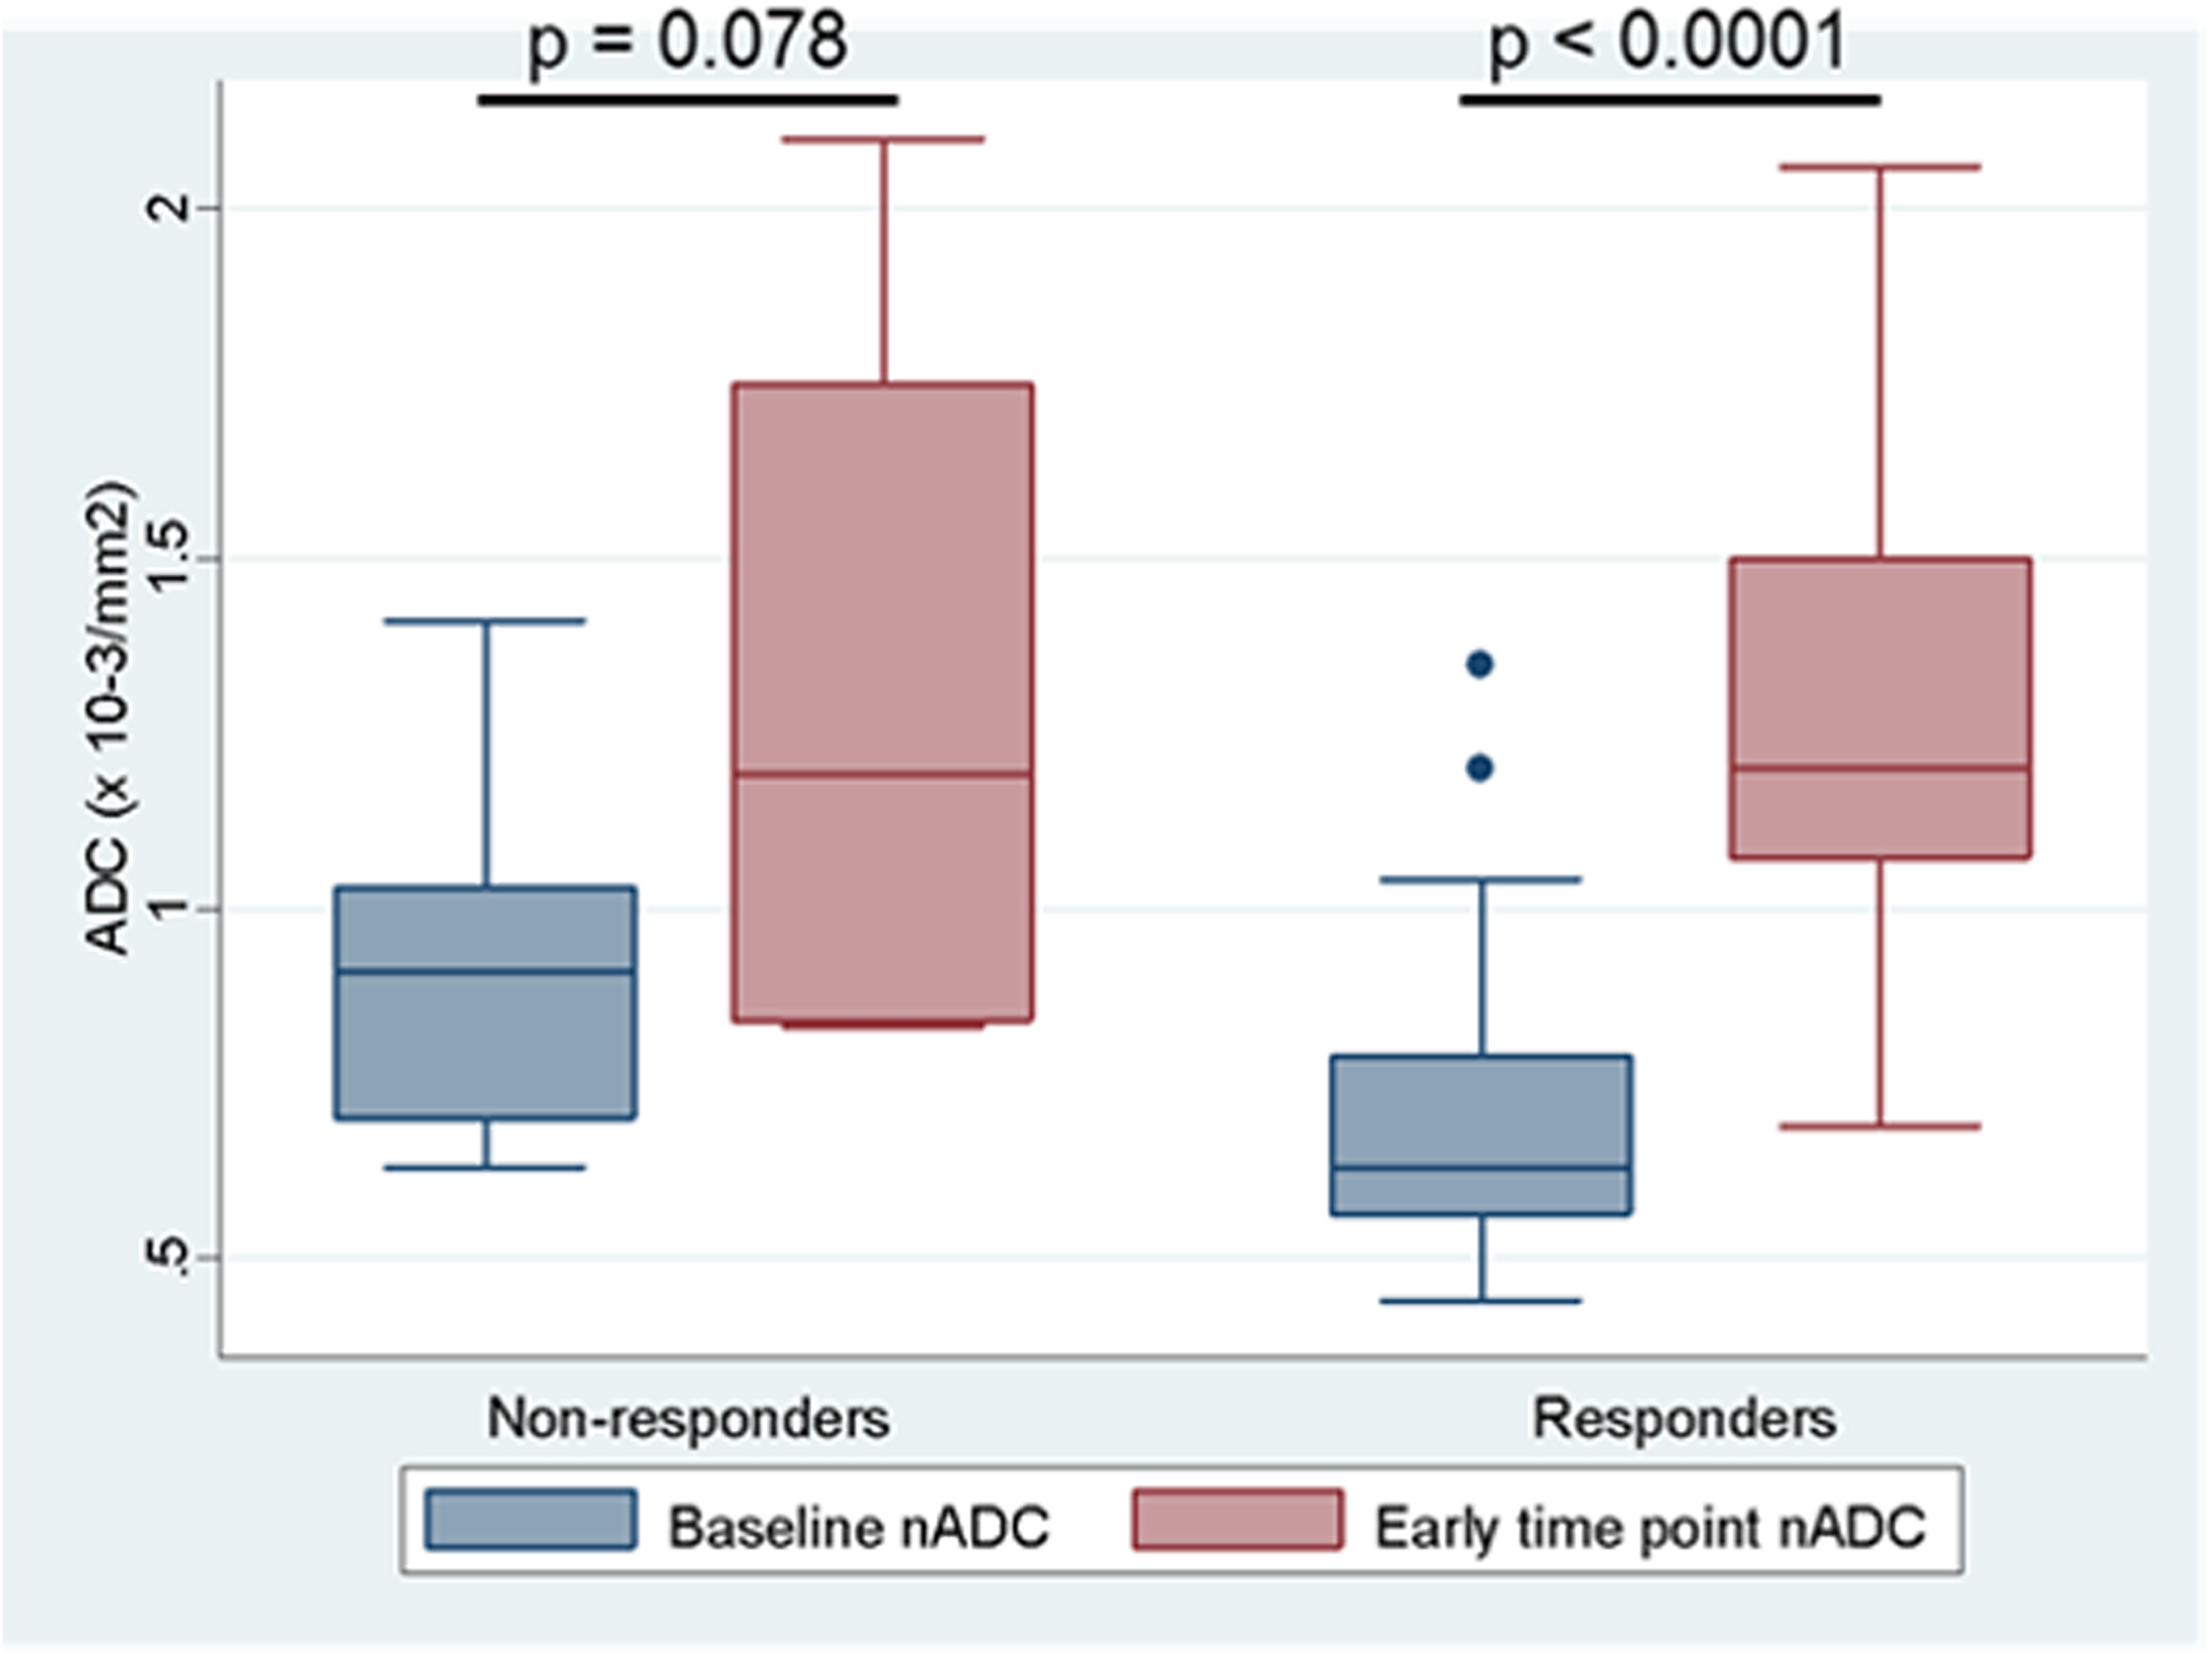
Box and whisker plots of nADC of responders and non-responders at baseline (nADCB) and early time point (nADCE): shows considerable overlap between baseline and early time point nADC values of non-responders. There is a significant difference between baseline and early time point nADC values of responders. Two outliers were noted in the responder group at baseline. nADC, normalized apparent diffusion coefficient.
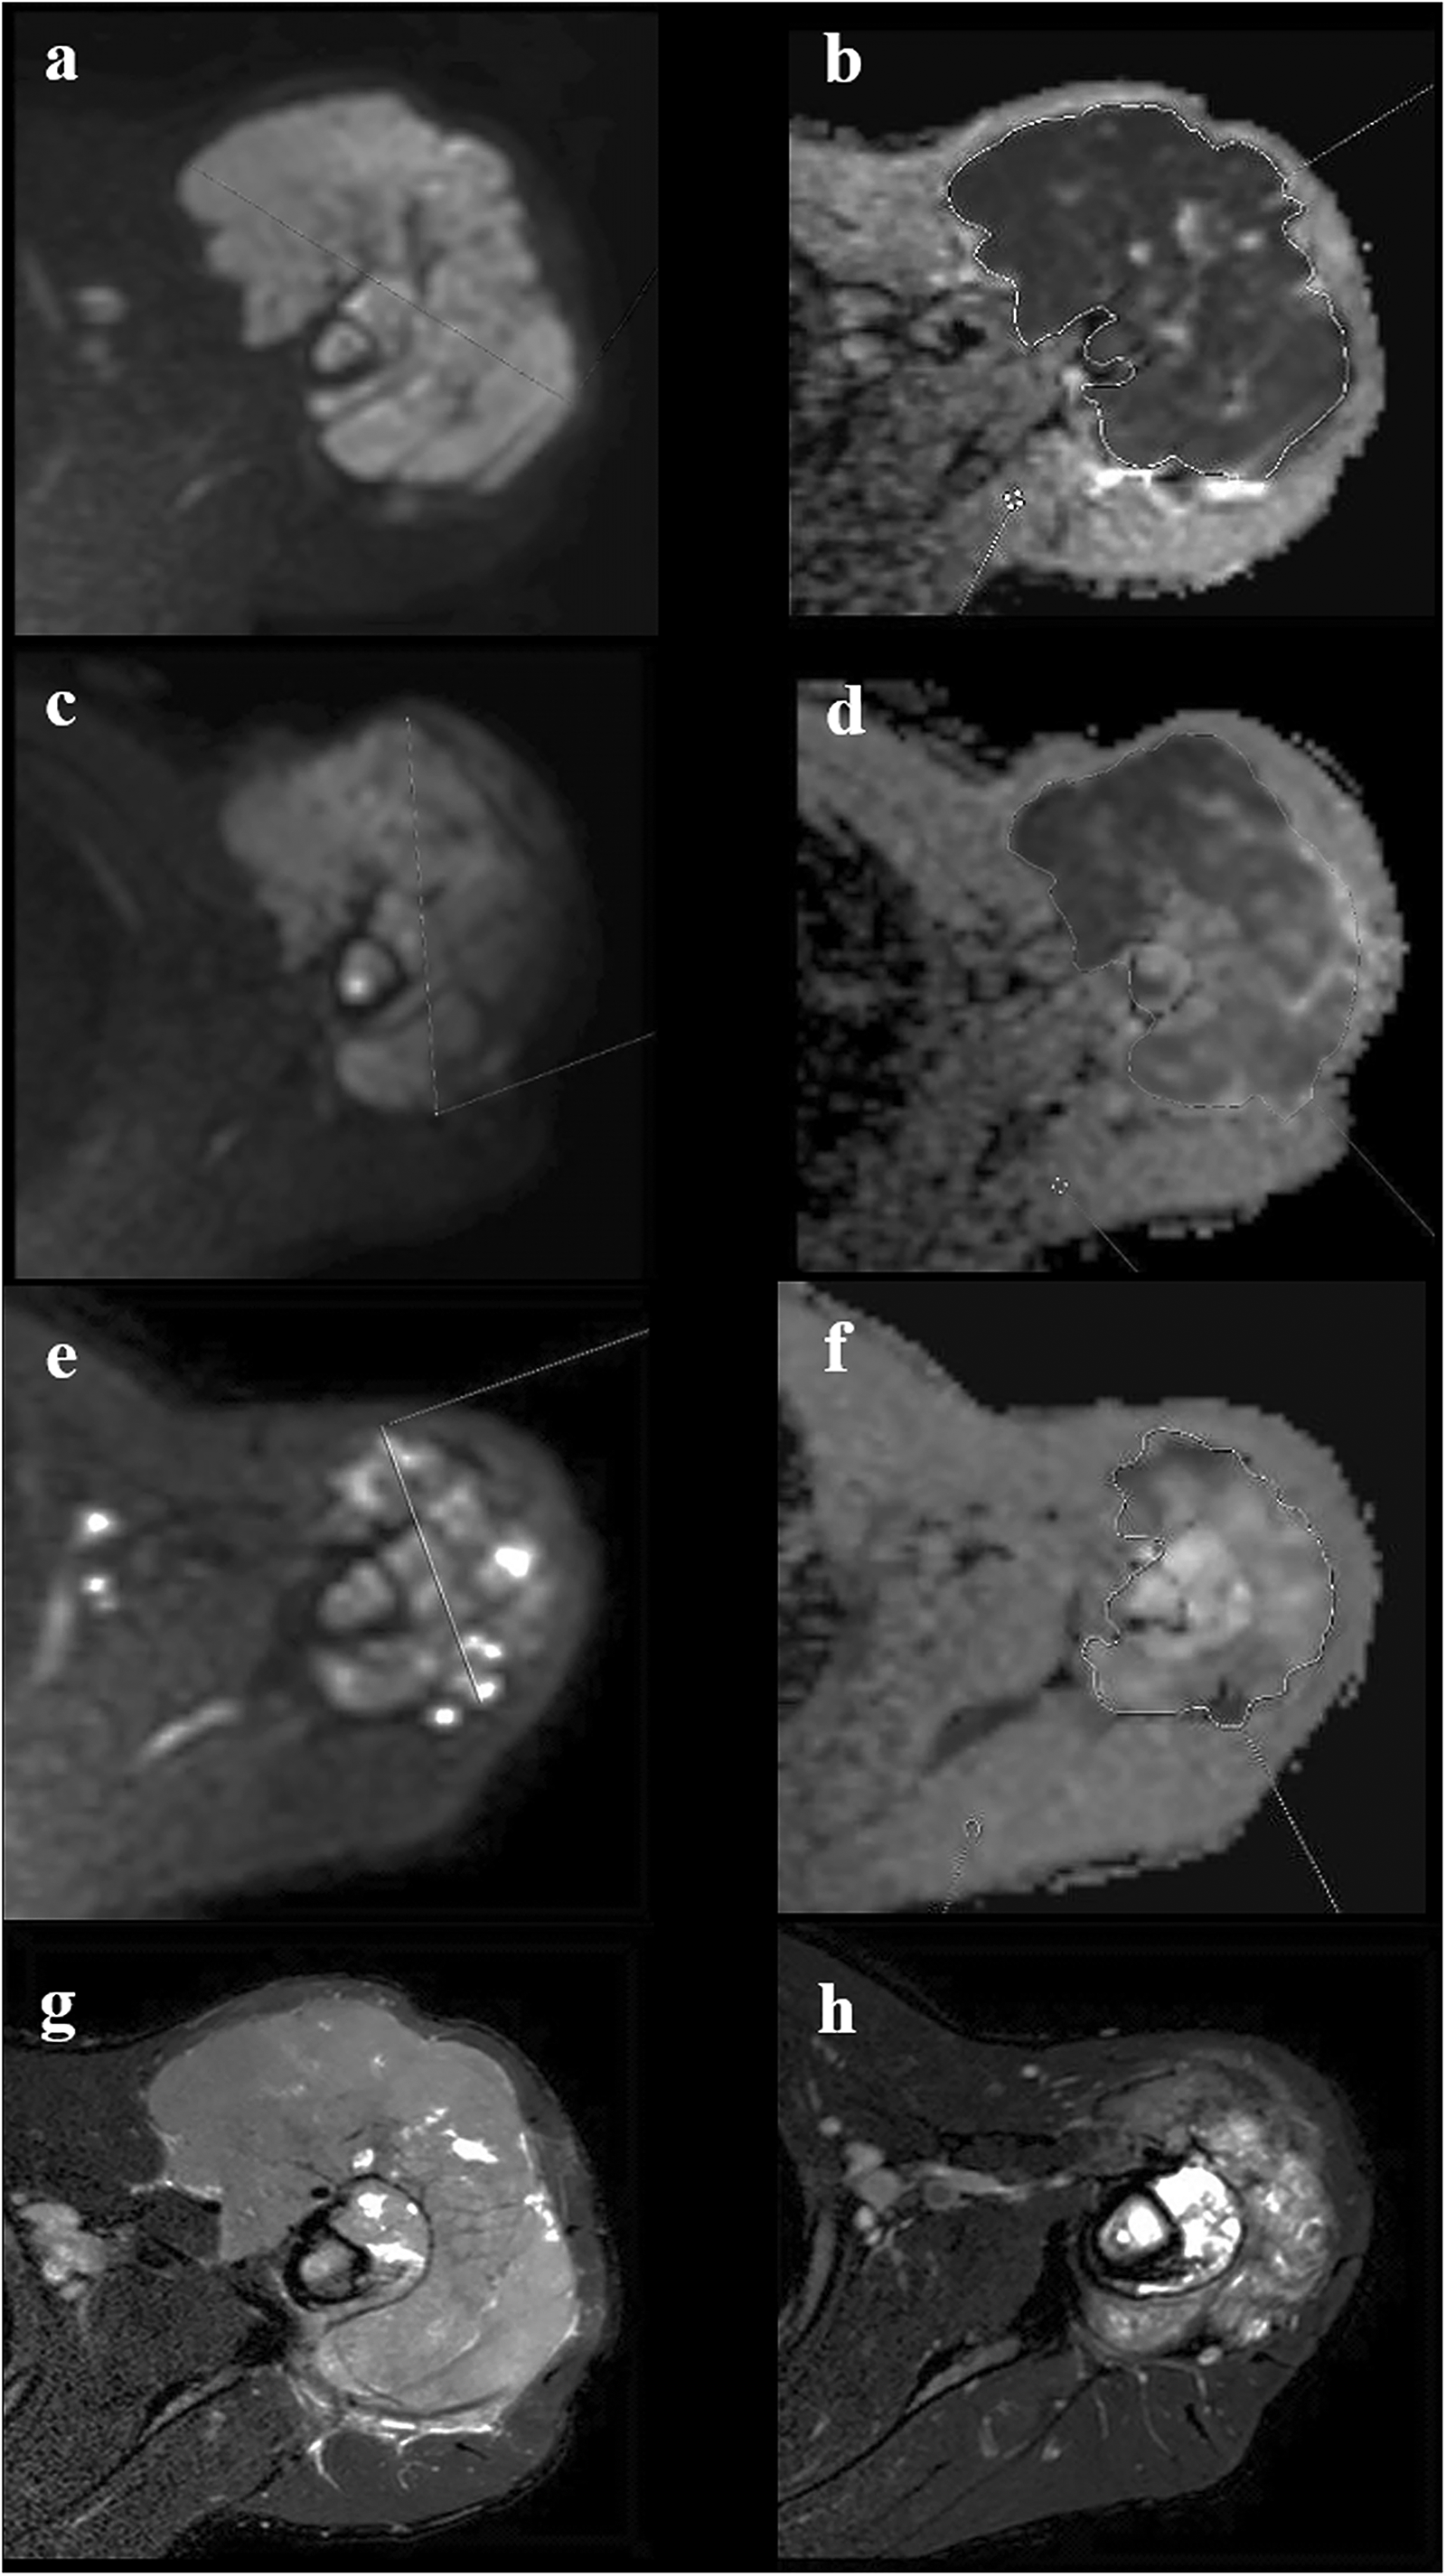
A 22-year-old male patient with left humerus ESFT, who was a responder on the basis of RECIST 1.1 and showed concordant finding on DWI. (a, c, e) DW b-1000 images and (b, d, f) corresponding ADC maps showing size measurement and ADC calculation at baseline, early, and last time points. Baseline nADC was 0.54 × 10⁻³ mm2/s, which showed increases of 71% and >100% at early and last time points, respectively. T2-weighted images at (g) baseline and (h) last time point showed a significant reduction in the size of the primary mass (partial response). In this patient, both the baseline nADC and the percentage change in nADC correctly predicted the response to therapy. ADC, apparent diffusion coefficient; DWI, diffusion-weighted imaging; ESFT, Ewing sarcoma family of tumors; nADC, normalized apparent diffusion coefficient.
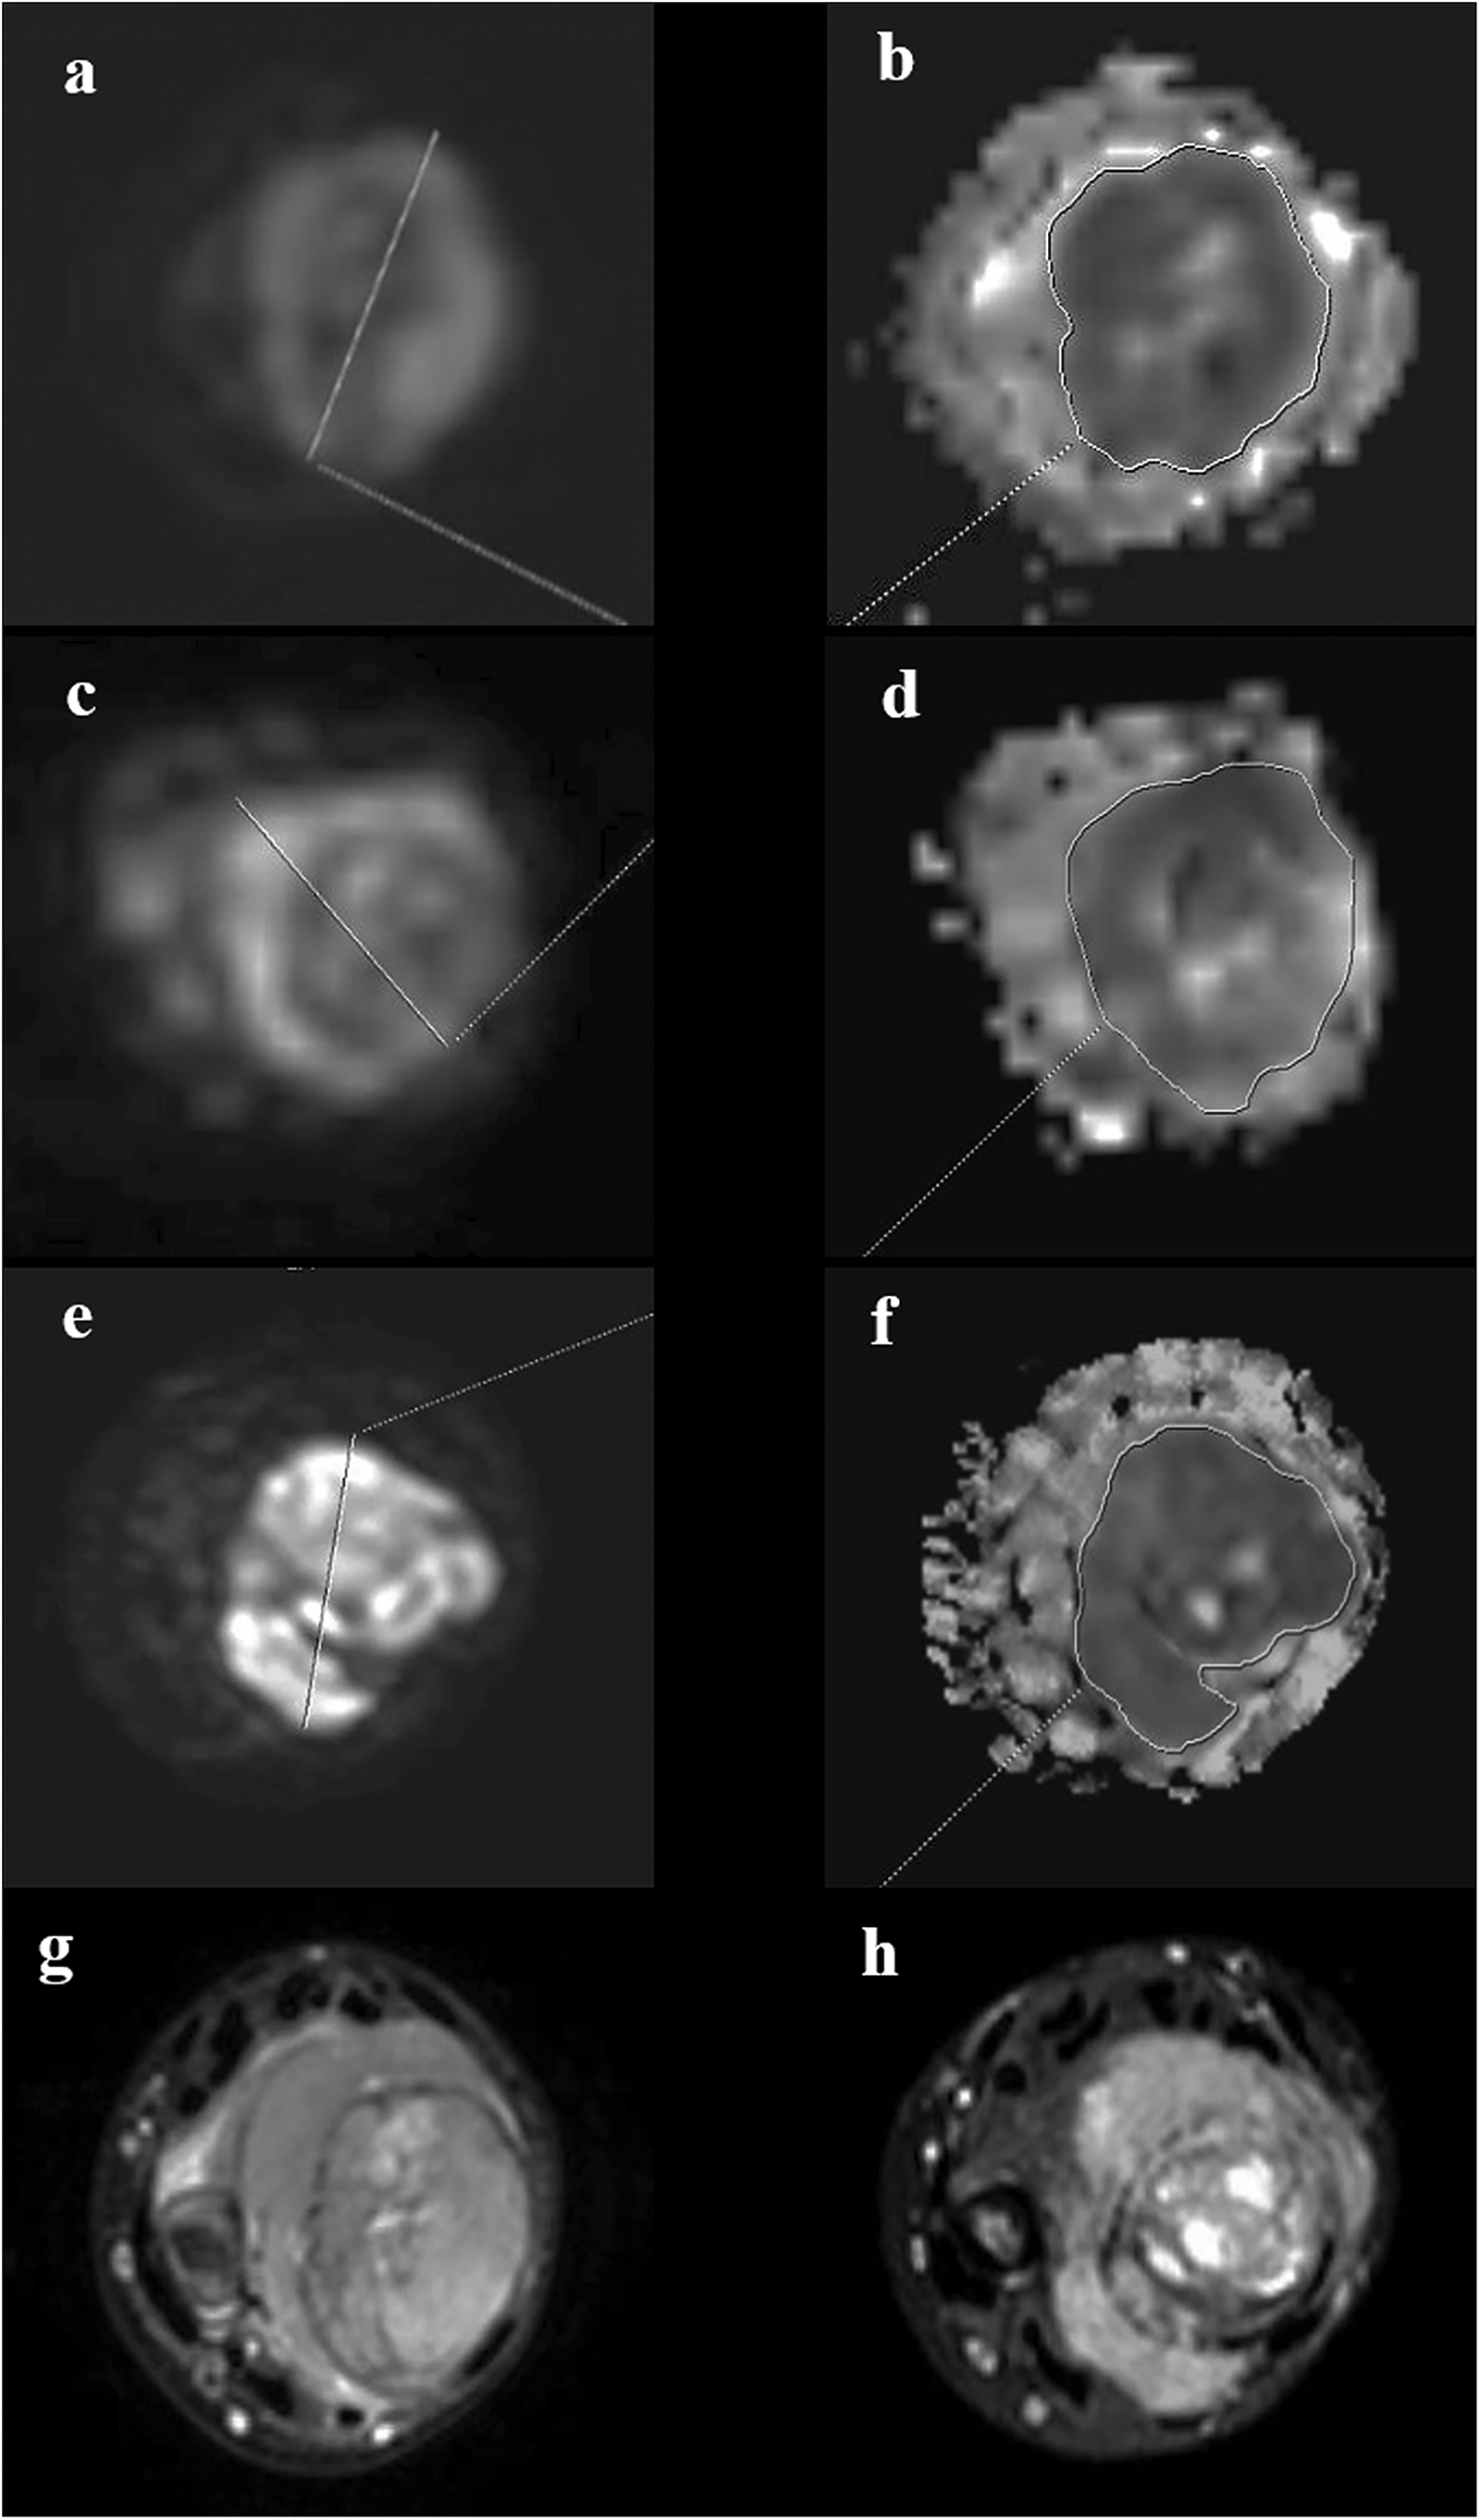
A 13-year-old female patient with right ulnar ESFT, who was a non-responder based on RECIST 1.1 and nADC was not significantly increased. (a, c, e) DW b-1000 images and (b, d, f) corresponding ADC maps show the size measurement and ADC calculation at baseline, early and last time points. Baseline nADC was 0.7 × 10⁻³ mm2/s, which showed an 18% increase at early and 10% decrease at last time point. T2-weighted images at (g) baseline and (h) last time point showed no significant change in the size of the primary mass. In this patient, both baseline nADC and percentage change in nADC were in concordance with the RECIST 1.1 criteria. ADC, apparent diffusion coefficient; DW, diffusion-weighted; ESFT, Ewing sarcoma family of tumors; nADC, normalized apparent diffusion coefficient.
ROC curve analysis of parameters for chemotherapy response
At baseline, the AUC of ADC for predicting responders was moderate (AUC = 0.6), while nADC produced a satisfactory AUC of 0.735 for predicting responders. At the optimal cutoff of 0.699 × 10⁻³mm2/s, the sensitivity and specificity for differentiating responders and non-responders were 61% and 85%, respectively.
At the early time point, ΔADCE produced an AUC of 0.723 (optimal cutoff = 0.3 × 10⁻³mm2/s) with a sensitivity of 88% and specificity of 71%, while ΔnADCE produced an AUC of 0.706 for predicting chemotherapy response at an optimal cutoff of 0.33 × 10⁻³mm2/s with a sensitivity of 88% and specificity of 71%. Δ%ADCE produced an AUC of 0.723 (optimal cutoff = 28%) for predicting responders at the early time point with a sensitivity of 94% and specificity of 57%. Δ%nADCE produced the highest AUC of 0.756 among all the DWI parameters for predicting chemotherapy response with an optimal cutoff of 38%, sensitivity of 100%, and specificity of 71%. At the early time point, Δ%SE had an AUC of 0.89 and an optimal cutoff of ≥13.6%, producing a sensitivity of 82% and specificity of 85% for predicting chemotherapy response.
ROC curve analysis of tumor size and diffusion parameters showing significant correlation (AUC > 0.7) with the chemotherapy response (RECIST1.1) is presented in Table 5.
ROC curve analysis of diffusion and size parameters producing AUC > 0.7 in predicting the chemotherapy response in the study group.

AUC, area under the ROC curve; CI, confidence interval; NPV, negative predictive value; PPV, positive predictive value; ROC, receiver operating characteristics.
Discussion
Neoadjuvant chemotherapy is highly efficient in downsizing tumors and treating micro-metastasis; however, it is associated with multiple side effects, which can further increase the morbidity of the patient (5,6). Early detection of chemotherapy response is necessary so that the non-responders can opt for alternative regimens and reduce the side effects of these drugs. This study evaluated the use of DWI for the early detection of response to chemotherapy in patients with ESFT.
Hayashida et al. (15), Degnan et al. (16), and Asmar et al. (17) performed chemotherapy response evaluation using DWI in a small group of patients with osteosarcoma and ESFT and reported a significant increase of ADC in tumors after chemotherapy. Similar findings were reported by Saleh et al. (18), where a significant increase in minimum ADC and mean ADC values was observed among patients with osteosarcoma and ESFT after chemotherapy and post-chemotherapy percentage change in ADC was an indicator of therapeutic response. However, inter-group comparison of ADC values between responders and non-responders was not performed, and predictability of ADC for chemotherapy response in ESFT was not assessed in these studies (15–18). Therefore, we compared our results with studies involving other primary bone tumors such as osteosarcoma and other carcinoma.
The reproducibility of ADC depends upon the method of ROI placement. Single largest ROI, volume ROI, and multiple small ROIs are different methods described in the literature (24). A comparative study by Lambregts et al. (25) found that ADC measurements of the whole tumor volume provided the best and most reproducible results. Various studies also recommended normalizing the ADC values to avoid fallacious changes in ADC values among different time points due to technical factors and get more reproducible values than absolute ADC of the lesion (26,27). Therefore, we evaluated the use of both normalized and absolute ADC values for predicting chemotherapy response in our study.
It has been hypothesized that tumors with higher pretreatment ADC values are necrotic and may be less sensitive to cytotoxic agents due to decreased perfusion in these areas and less responsive to chemotherapeutic agents (10). In our study, baseline nADC among responders was significantly (P = 0.033) lower than the non-responders similar with earlier studies (15,18) and predicted response to chemotherapy with a satisfactory AUC of 0.735. However, correlation between pretreatment ADC and treatment response is not always consistent in literature (28–30) and may not apply to all types of tumors and treatment methods (24).
Chemotherapy causes cell death and leads to an increase in necrotic areas and increased extracellular volume leading to an increase in ADC. In our study, post-chemotherapy ADC in tumors significantly increased among responders and the mean percentage change in normalized ADC and absolute ADC at the early time point yielded AUC values of 0.756 and 0.723, respectively, for predicting responders. Saleh et al. (18) observed a comparable AUC of 0.807 for the percentage change in ADC values after neoadjuvant treatment for predicting non-progressive disease in patients with osteosarcoma and ESFT. Byun et al. (31) also reported a comparable AUC of 0.728 for the percentage change in ADC for predicting a good response in osteosarcoma. Previous studies also showed a correlation of change in ADC with treatment response in ESFT (15–18) and other sarcomas (19,32) and carcinomas (33,34). In our study, the percentage change in nADC was observed to be a better predictor of response compared to absolute nADC change. It might be due to the fact that tumors may show small absolute change in ADC; however, the percentage change in ADC may be significant. It is worth noting that the cutoff values are highly dependent on the timing of the imaging, study designs, protocols used, and different methods of ADC calculation. Hence cutoff values observed in different studies cannot be compared.
Traditionally, the response assessment in ESFT is performed three months after the initiation of chemotherapy by the size criteria. However, in our study, the percentage size change at the early time point also significantly correlated with the chemotherapy response and produced an AUC of 0.89. Further studies are needed to evaluate the reproducibility of size criteria applied early in the course of treatment than traditionally followed. The timing of image acquisition is of critical importance because changes in ADC may precede the change in the tumor size, and ADC may even start showing a reverse trend after a certain time because of tissue repair mechanisms. Studies reported a significant reduction in tumor size with a corresponding increase in ADC early in the course of chemotherapy in breast carcinoma (35) and liver metastasis (36). However, the precise timing of ADC rise can vary among different tumors and is hard to predict . Hence, further studies are warranted to resolve this conundrum.
Demographic details and tumor characteristics were comparable to previous studies (16–18). In our study, the percentage of patients with metastatic deposits was higher compared to the earlier literature; however, the lung remained the most common site of metastasis as observed (1,37). This study was conducted in a tertiary center and most of the patients come as referrals from peripheral centers, where ESFT at advanced stages could not be managed appropriately. This might explain the high incidence of metastatic disease in the study group.
The present study has some limitations. First, the sample size of this study was small. We recruited 38 patients in this single-center prospective study and the response assessment could be evaluated in only 28 patients. Second, although an experienced radiologist evaluated the tumor size and RECIST 1.1 scoring for chemotherapy response evaluation, there was no inter- and intra-observer validation performed in this study. Third, the histological response to chemotherapy was not assessed in our patients; only four patients underwent surgery after completion of chemotherapy. Fourth, event-free survival and overall survival of patients could not be evaluated in this study due to logistic issues. Finally, the aim of our study was to evaluate the role of DWI in predicting the chemotherapeutic response in ESFT and only the relevant clinical and biochemical data were collected. Therefore, comparison of performance of DWI with other clinical risk stratifying criteria was not possible.
In conclusion, ADC values obtained by DWI showed reasonably good accuracy in differentiating responders and non-responders and they can be used as a surrogate marker of early assessment of response to chemotherapy in patients with ESFT. Baseline ADC also is a potential marker that can be used to predict the chemotherapy response to intervene early in the course of management. However further studies with a large sample size and correlation with histopathological response assessment are required for larger adoption of this metric for clinical use.
Supplemental Material
sj-docx-1-acr-10.1177_02841851221124669 - Supplemental material for Chemotherapy response evaluation using diffusion weighted MRI in Ewing Sarcoma: A single center experience
Supplemental material, sj-docx-1-acr-10.1177_02841851221124669 for Chemotherapy response evaluation using diffusion weighted MRI in Ewing Sarcoma: A single center experience by Esha Baidya Kayal, Jayendra Tiru Alampally, Raju Sharma, Sameer Bakhshi, Amit Mehndiratta, Rakesh Kumar, SH Chandrashekhara, Manisha Jana, Ashu Seith Bhalla, Mehar Chand Sharma, Asit Ranjan Mridha, Sreenivas Vishnubhatla and Devasenathipathy Kandasamy in Acta Radiologica
Footnotes
Declaration of conflicting interests
The author(s) declared no potential conflicts of interest with respect to the research, authorship, and/or publication of this article.
Funding
The author(s) received no financial support for the research, authorship, and/or publication of this article.

Supplemental material
Supplemental material for this article is available online.
References
Supplementary Material
Please find the following supplemental material available below.
For Open Access articles published under a Creative Commons License, all supplemental material carries the same license as the article it is associated with.
For non-Open Access articles published, all supplemental material carries a non-exclusive license, and permission requests for re-use of supplemental material or any part of supplemental material shall be sent directly to the copyright owner as specified in the copyright notice associated with the article.
