



Abstract
Background
More and more pulmonary ground-glass nodules (GGNs) are screened with the extensive usage of low-dose computed tomography (CT). The need of CT-guided percutaneous puncture biopsy of GGN remains controversial.
Purpose
To explore the diagnostic accuracy of CT-guided percutaneous puncture biopsy of GGNs.
Material and Methods
We searched PubMed, EMBASE, the Cochrane Library, and CNKI. Included studies reported the puncture biopsy results of pulmonary GGNs, including the number of true positive (TP), false positive (FP), true negative (TN), and false negative (FN) cases. After evaluating the studies, statistical analysis, and quality assessment, the pooled diagnostic sensitivity (SEN), specificity (SPE), and diagnostic odds ratio (DOR) were calculated. The summary receiver operating characteristic (SROC) curve was constructed and the area under the curve (AUC) was calculated. Subgroup analysis was performed according to whether spiral CT or fluoroscopy-guided CT was used in the study.
Results
This meta-analysis included 14 studies with a total of 759 patients (702 samples). The pooled SEN, SPE, and DOR of CT-guided puncture biopsy of pulmonary GGNs were 0.91 (95% confidence interval [CI] = 0.89–0.94), 0.99 (95% CI = 0.95–1.00), and 138.72 (95% CI = 57.98–331.89), respectively. The AUC was 0.97.
Conclusion
Our results indicated that CT-guided puncture biopsy of GGNs has high SEN, SPE, and DOR, which proved that CT-guided puncture biopsy was a good way to determine the pathological nature of GGN.
Introduction
In recent years, more and more pulmonary ground-glass nodules (GGNs) have been found since thin-slice computed tomography (CT) has become widely used. GGN refers to the lesions that appear as increased density nodules on high-resolution CT images and do not cover the bronchial and vascular structures, which can be caused by inflammatory disease, focal fibrosis, atypical adenomatous hyperplasia, adenocarcinoma in situ, and adenocarcinoma. Therefore, it is crucial to clarify the pathological nature of GGN for treatment selection.
CT-guided percutaneous lung biopsy is an effective diagnostic technique to make certain of the nature of pulmonary lesions (1). Previous studies have reported that the diagnostic accuracy of CT-guided puncture biopsy for GGNs is in the range of 78.6%–100.0%, which fluctuates widely (2–15). In addition, the sample size of each study varies, and the results of studies with small sample sizes were not convincing.
To our knowledge, there are few large sample studies on GGN puncture biopsy, and there have been almost no relevant meta-analyses. The aim of the present study was to enlarge the sample size through meta-analysis to obtain more convincing results, and to determine the clinical value of CT-guided percutaneous puncture biopsy.
Material and Methods
Based on the Preferred Reporting Items for Systematic Reviews and Meta-Analyses (PRISMA) statement, an ethical review of this article was not required. This meta-analysis does not contain any studies with human or animal subjects performed by any of the authors.
Inclusion criteria
Included studies met the following criteria: (i) patients had a pulmonary GGN lesion observed on CT and then underwent CT-guided percutaneous puncture biopsy; (ii) the study was designed to test diagnostic accuracy and could provide the number of true positive (TP), false positive (FP), true negative (TN), or false negative (FN) cases; (iii) specimens obtained by biopsy were cytologically or histologically evaluated; and (iv) the final reference standards were surgical specimen or clinical follow-up.
Studies were excluded for the following criteria: (i) they were reviews, meta-analyses, or case reports; (ii) they used duplicated data; (iii) they provided no data about TP, FP, TN, or FN cases; and (iv) CT-guided percutaneous puncture biopsy results were defined as the final reference standards.
Studies from any country, with any sample size, at any time were allowed. All puncture methods used in the studies, such as fine needle aspiration, core needle biopsy, and coaxial needle biopsy, were allowed. Both spiral CT or fluoroscopy-guided CT studies were allowed.
Search strategy
We searched PubMed, EMBASE, Cochrane Library, and CNKI in July 2021. The following search terms were used: lung, pulmonary, ground glass nodule, ground glass opacity, needle biopsy, aspiration biopsy, puncture biopsy, and core biopsy. To complete the search, search methods towards different databases were adjusted. Without the limitation of language, we finally kept 11 English studies and three Chinese studies through screening.
Data extraction
The following study characteristics were extracted and tabulated by two authors (BCW and FYZ) independently: first author, publication year, scanning machine, puncture methods, sample size, number of men, mean age, and number of TP, FP, TN, and FN cases.
Quality assessment
We used Quality Assessment of Diagnostic Accuracy Studies (QUADAS) to evaluate the quality of included diagnostic studies. In the process of data extraction and quality assessment, ambiguities were confirmed by the third author (WTA).
Statistical analysis
We used the I2 test and Q test to quantify heterogeneity. In the Q test, there existed heterogeneity when P ≤ 0.1 at a level of α = 0.1. When I2 ≤ 25%, there was low heterogeneity. When I2 ≤ 50%, it showed moderate heterogeneity. High heterogeneity existed when I2 > 75%. When I2 > 50%, we could neglect heterogeneity, so we used the random-effects model. In other cases, we selected the fixed-effects model.
The pooled sensitivity (SEN), specificity (SPE), and diagnostic odds ratio (DOR; a single indicator of test accuracy that comprises a combination of SEN and SPE information) were calculated as the main outcome measures with 95% confidence intervals (CIs). The summary receiver operating characteristic (SROC) curve was constructed using a bivariate regression approach and the area under the curve (AUC) was calculated.
Subgroup analysis was determined to figure out whether there was a difference between spiral CT or fluoroscopy-guided CT studies.
P < 0.05 was considered to be statistically significant. The SEN, SPE, and SROC curve were all analyzed by Meta-Disc 1.4 (Unit of Clinical Biostatistics; Ramony 94 Cajal Hospital, Madrid, Spain). Deeks’ funnel plot and subgroup analysis were analyzed by STATA 12.0 (StataCorp, College Station, TX, USA).
Results
Study selection and study characteristics
As a result, 295 relevant articles were retrieved with 36 duplicates, 64 case reports, 7 reviews, 10 conference papers, and 178 original studies. After preliminary screening by reading the title and abstract of 178 original studies, 19 studies that were consistent with our study were selected for full-text reading. Five of them failed to demonstrate complete results to be extracted. We finally included the remaining 14 studies in our meta-analysis, 11 of which were in English and three in Chinese (Fig. 1).
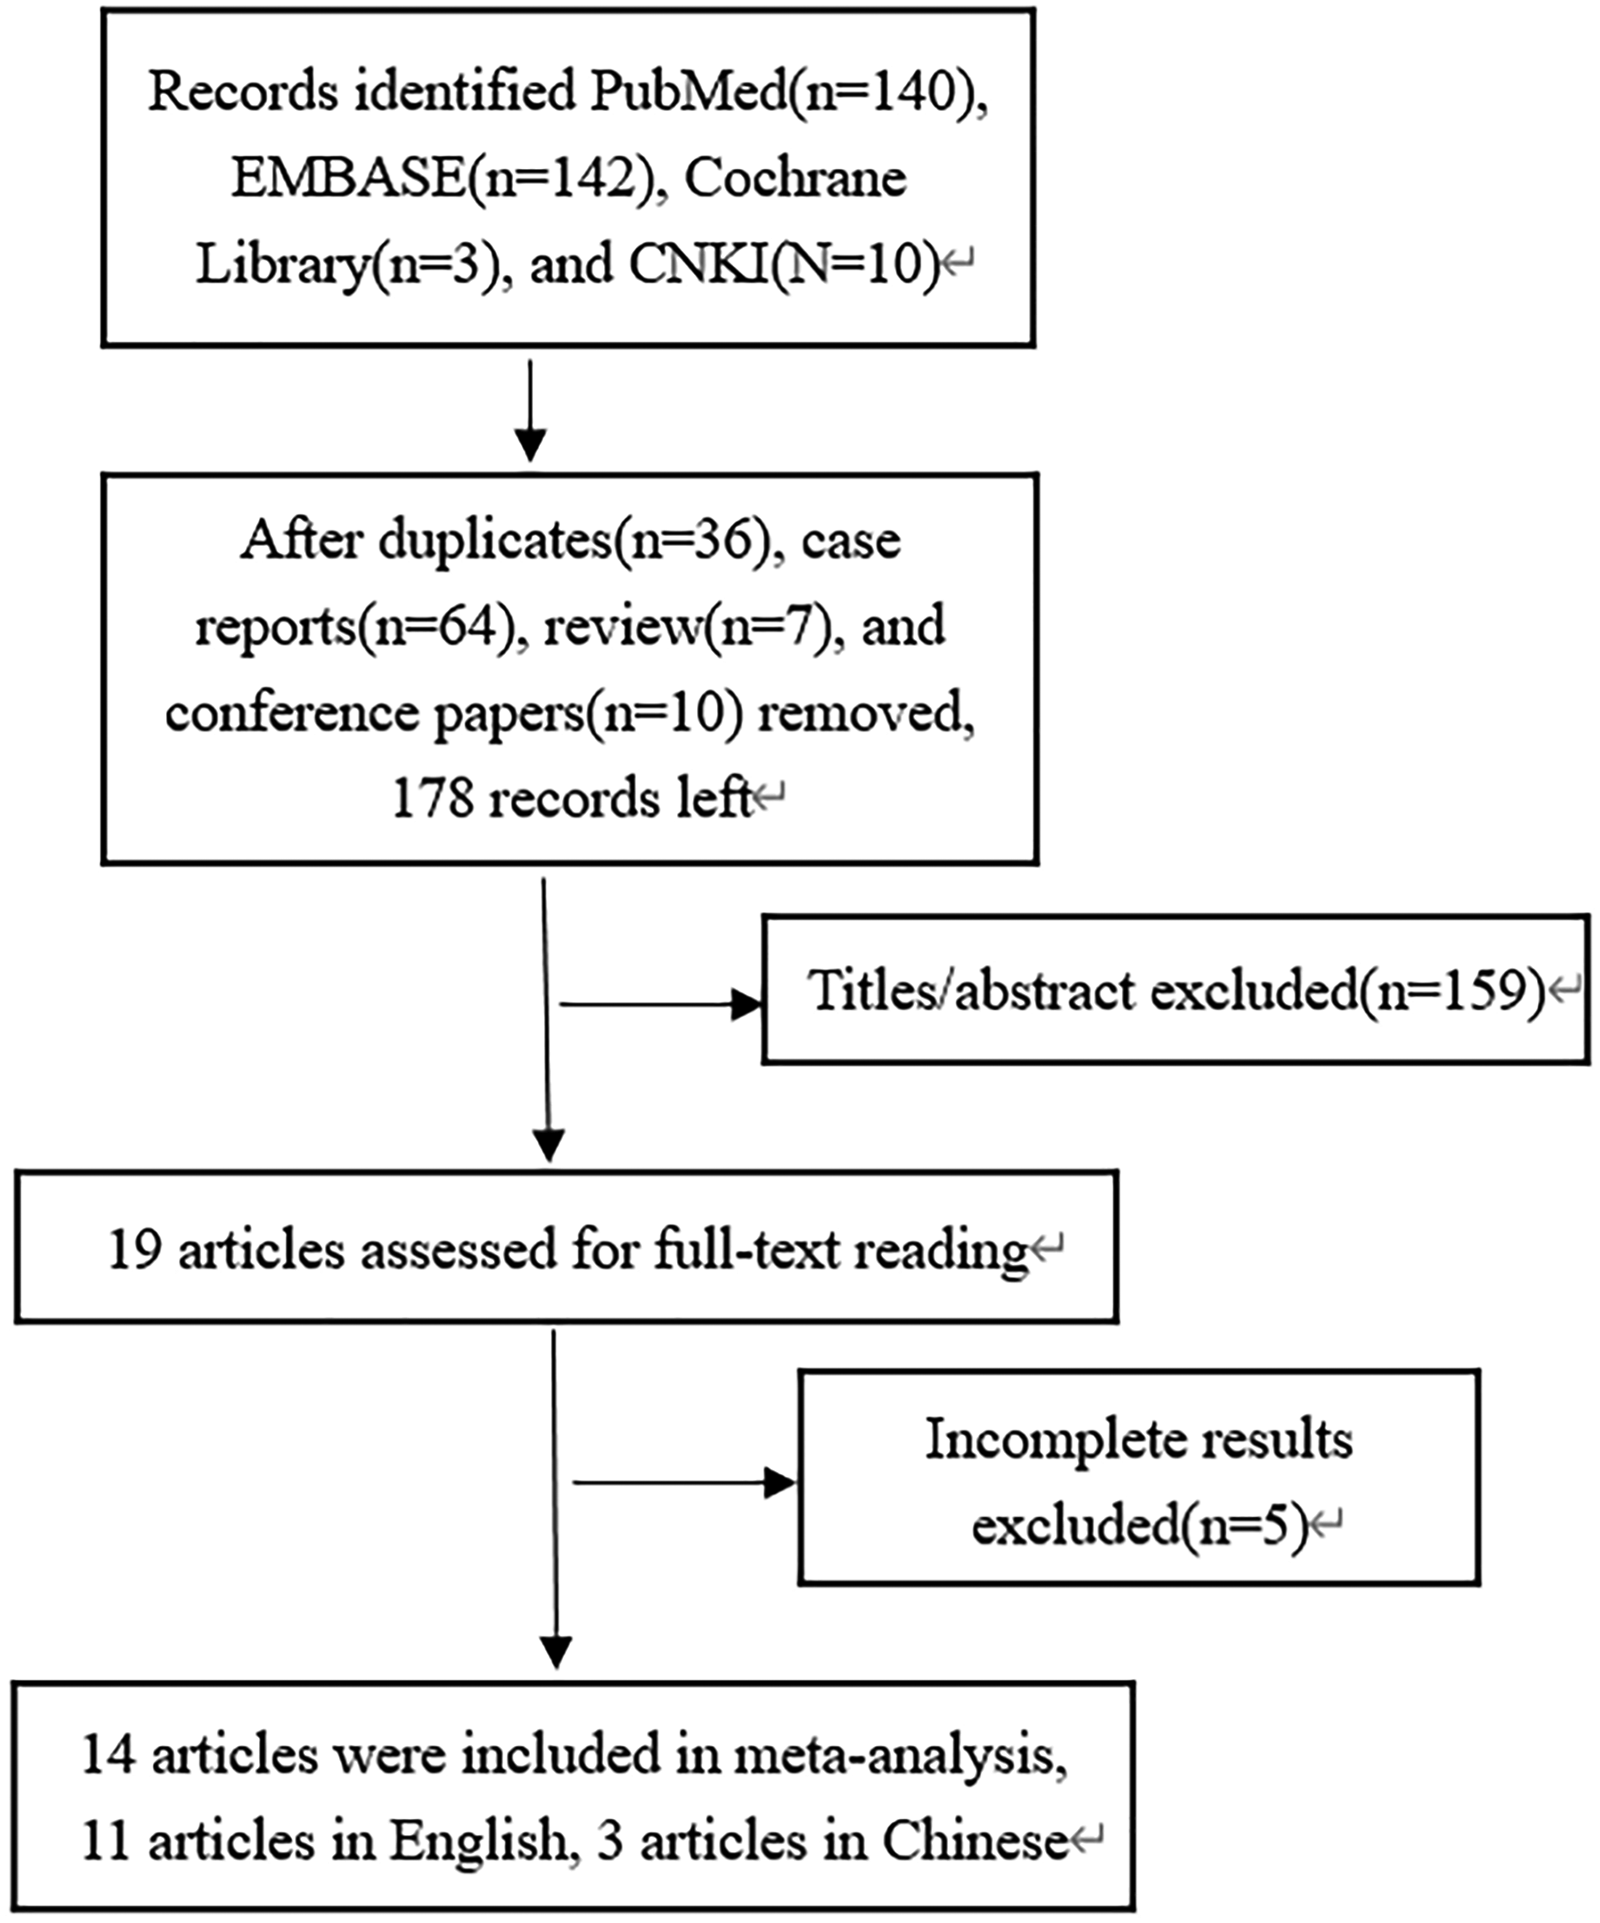
Flow diagram of identification of relevant studies.
We presented the characteristics of included studies in Table 1. Of all the studies included, two of the studies used two kind of puncture methods. Patients in 10 studies received spiral CT guidance, and patients in the other four studies received CT fluoroscopy guidance. The total number of samples for all included studies was 702. The percentage of women was in the range of 40%–80%. The average age range was 55–68 years.
Summary of characteristics of included studies.
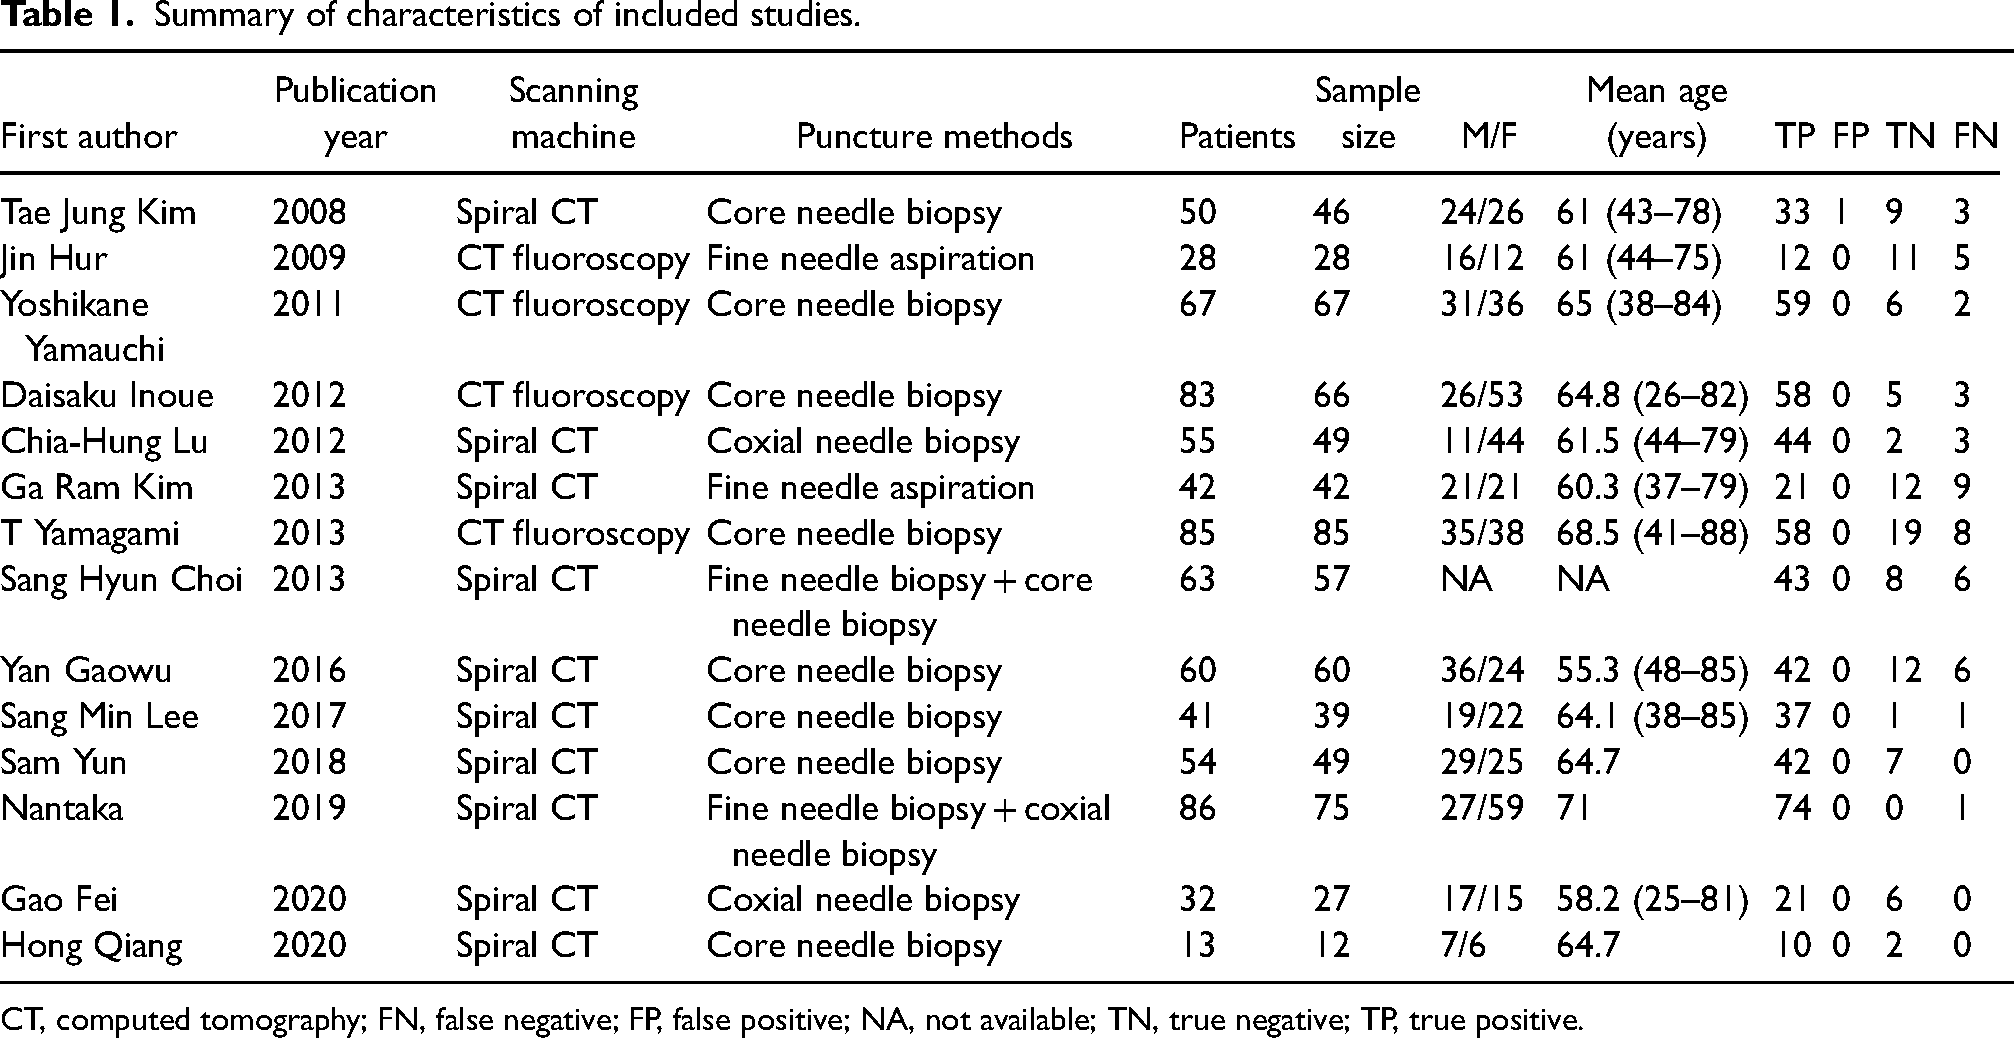
CT, computed tomography; FN, false negative; FP, false positive; NA, not available; TN, true negative; TP, true positive.
Quality assessment
Fig. 2 displayed the risk of bias in all studies according to the QUADAS tool. After full-text reading, all of the patients were chosen retrospectively. Some of the patients were excluded from the studies because of missing follow-up data for the final diagnosis, or the biopsy specimen was inadequate for diagnosis. The reference standards included histopathology and clinical methods. The clinical methods were effective therapies; the histopathology of the lesions was comparable with the known malignancy of the patients or the lesions increased, shrank, or remained stable in size during the clinical course.
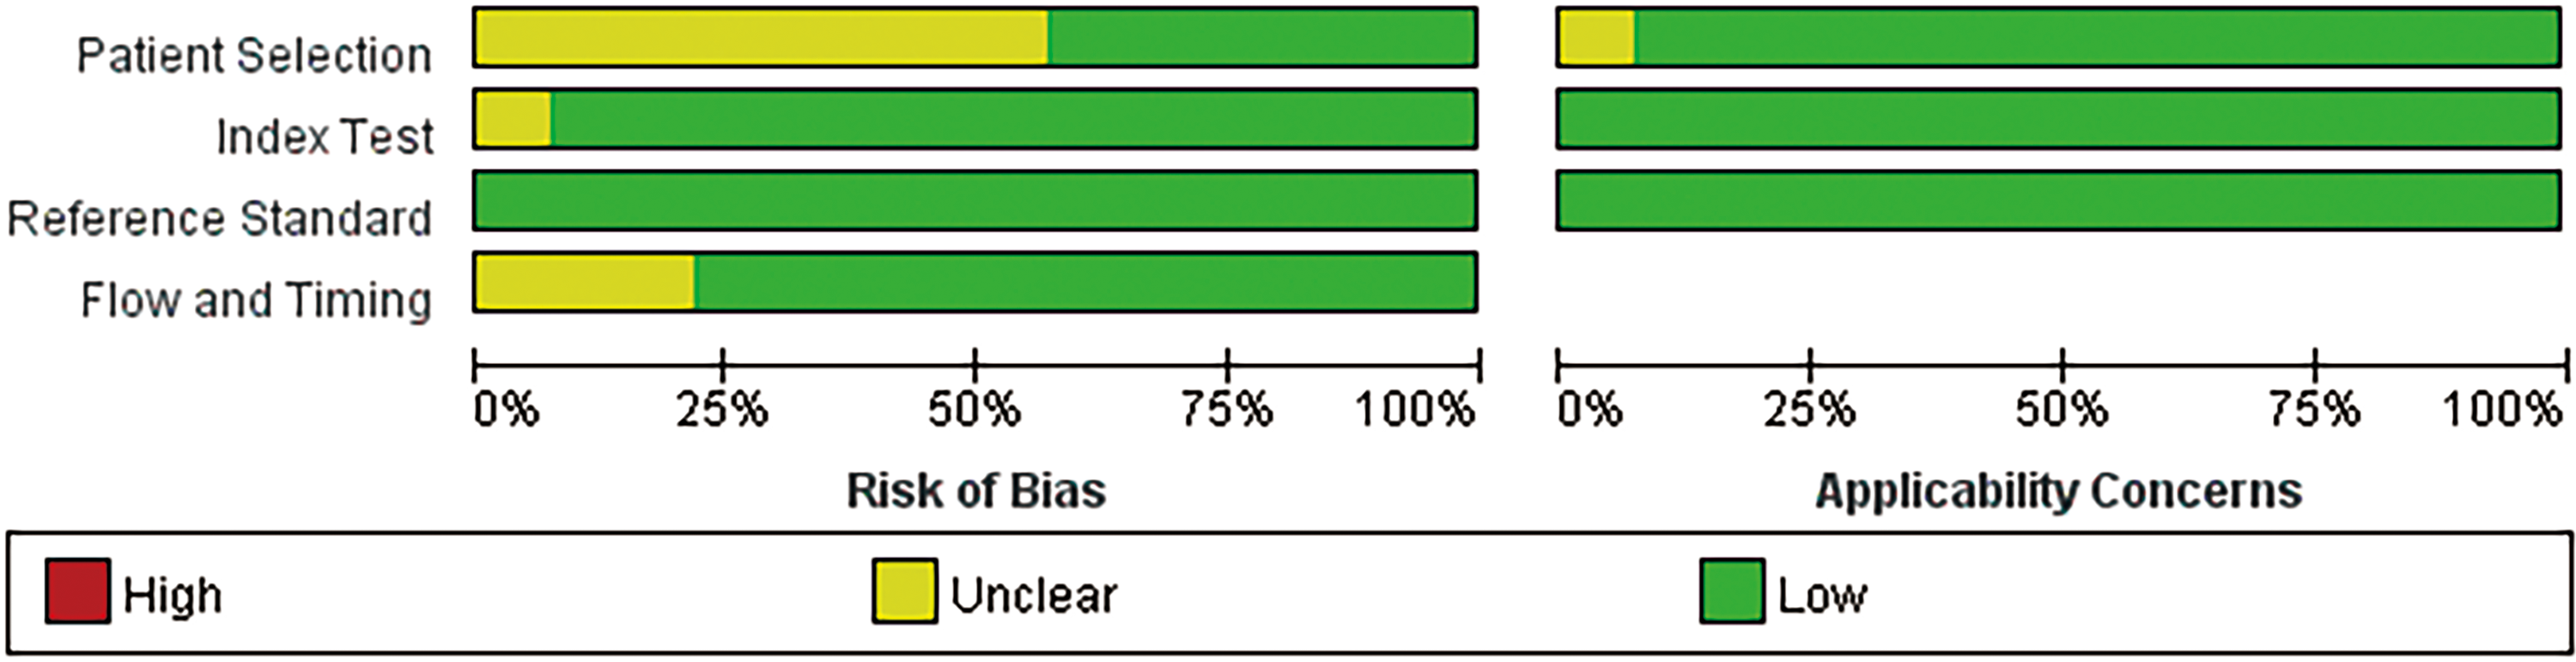
The quality of included studies assessed by QUADAS.
Statistical heterogeneity assessment
The I2 of SEN was 69.8% (P < 0.1), demonstrating a significant heterogeneity, so we used a random-effects model for data pooling (Fig. 3). For SPE, I2 was 0% (P = 0.97), which signified a low heterogeneity; for DOR, I2 was 0% (P = 0.99), which was also identified; therefore, both SPE and DOR used the fixed-effects model (Figs. 4 and 5).
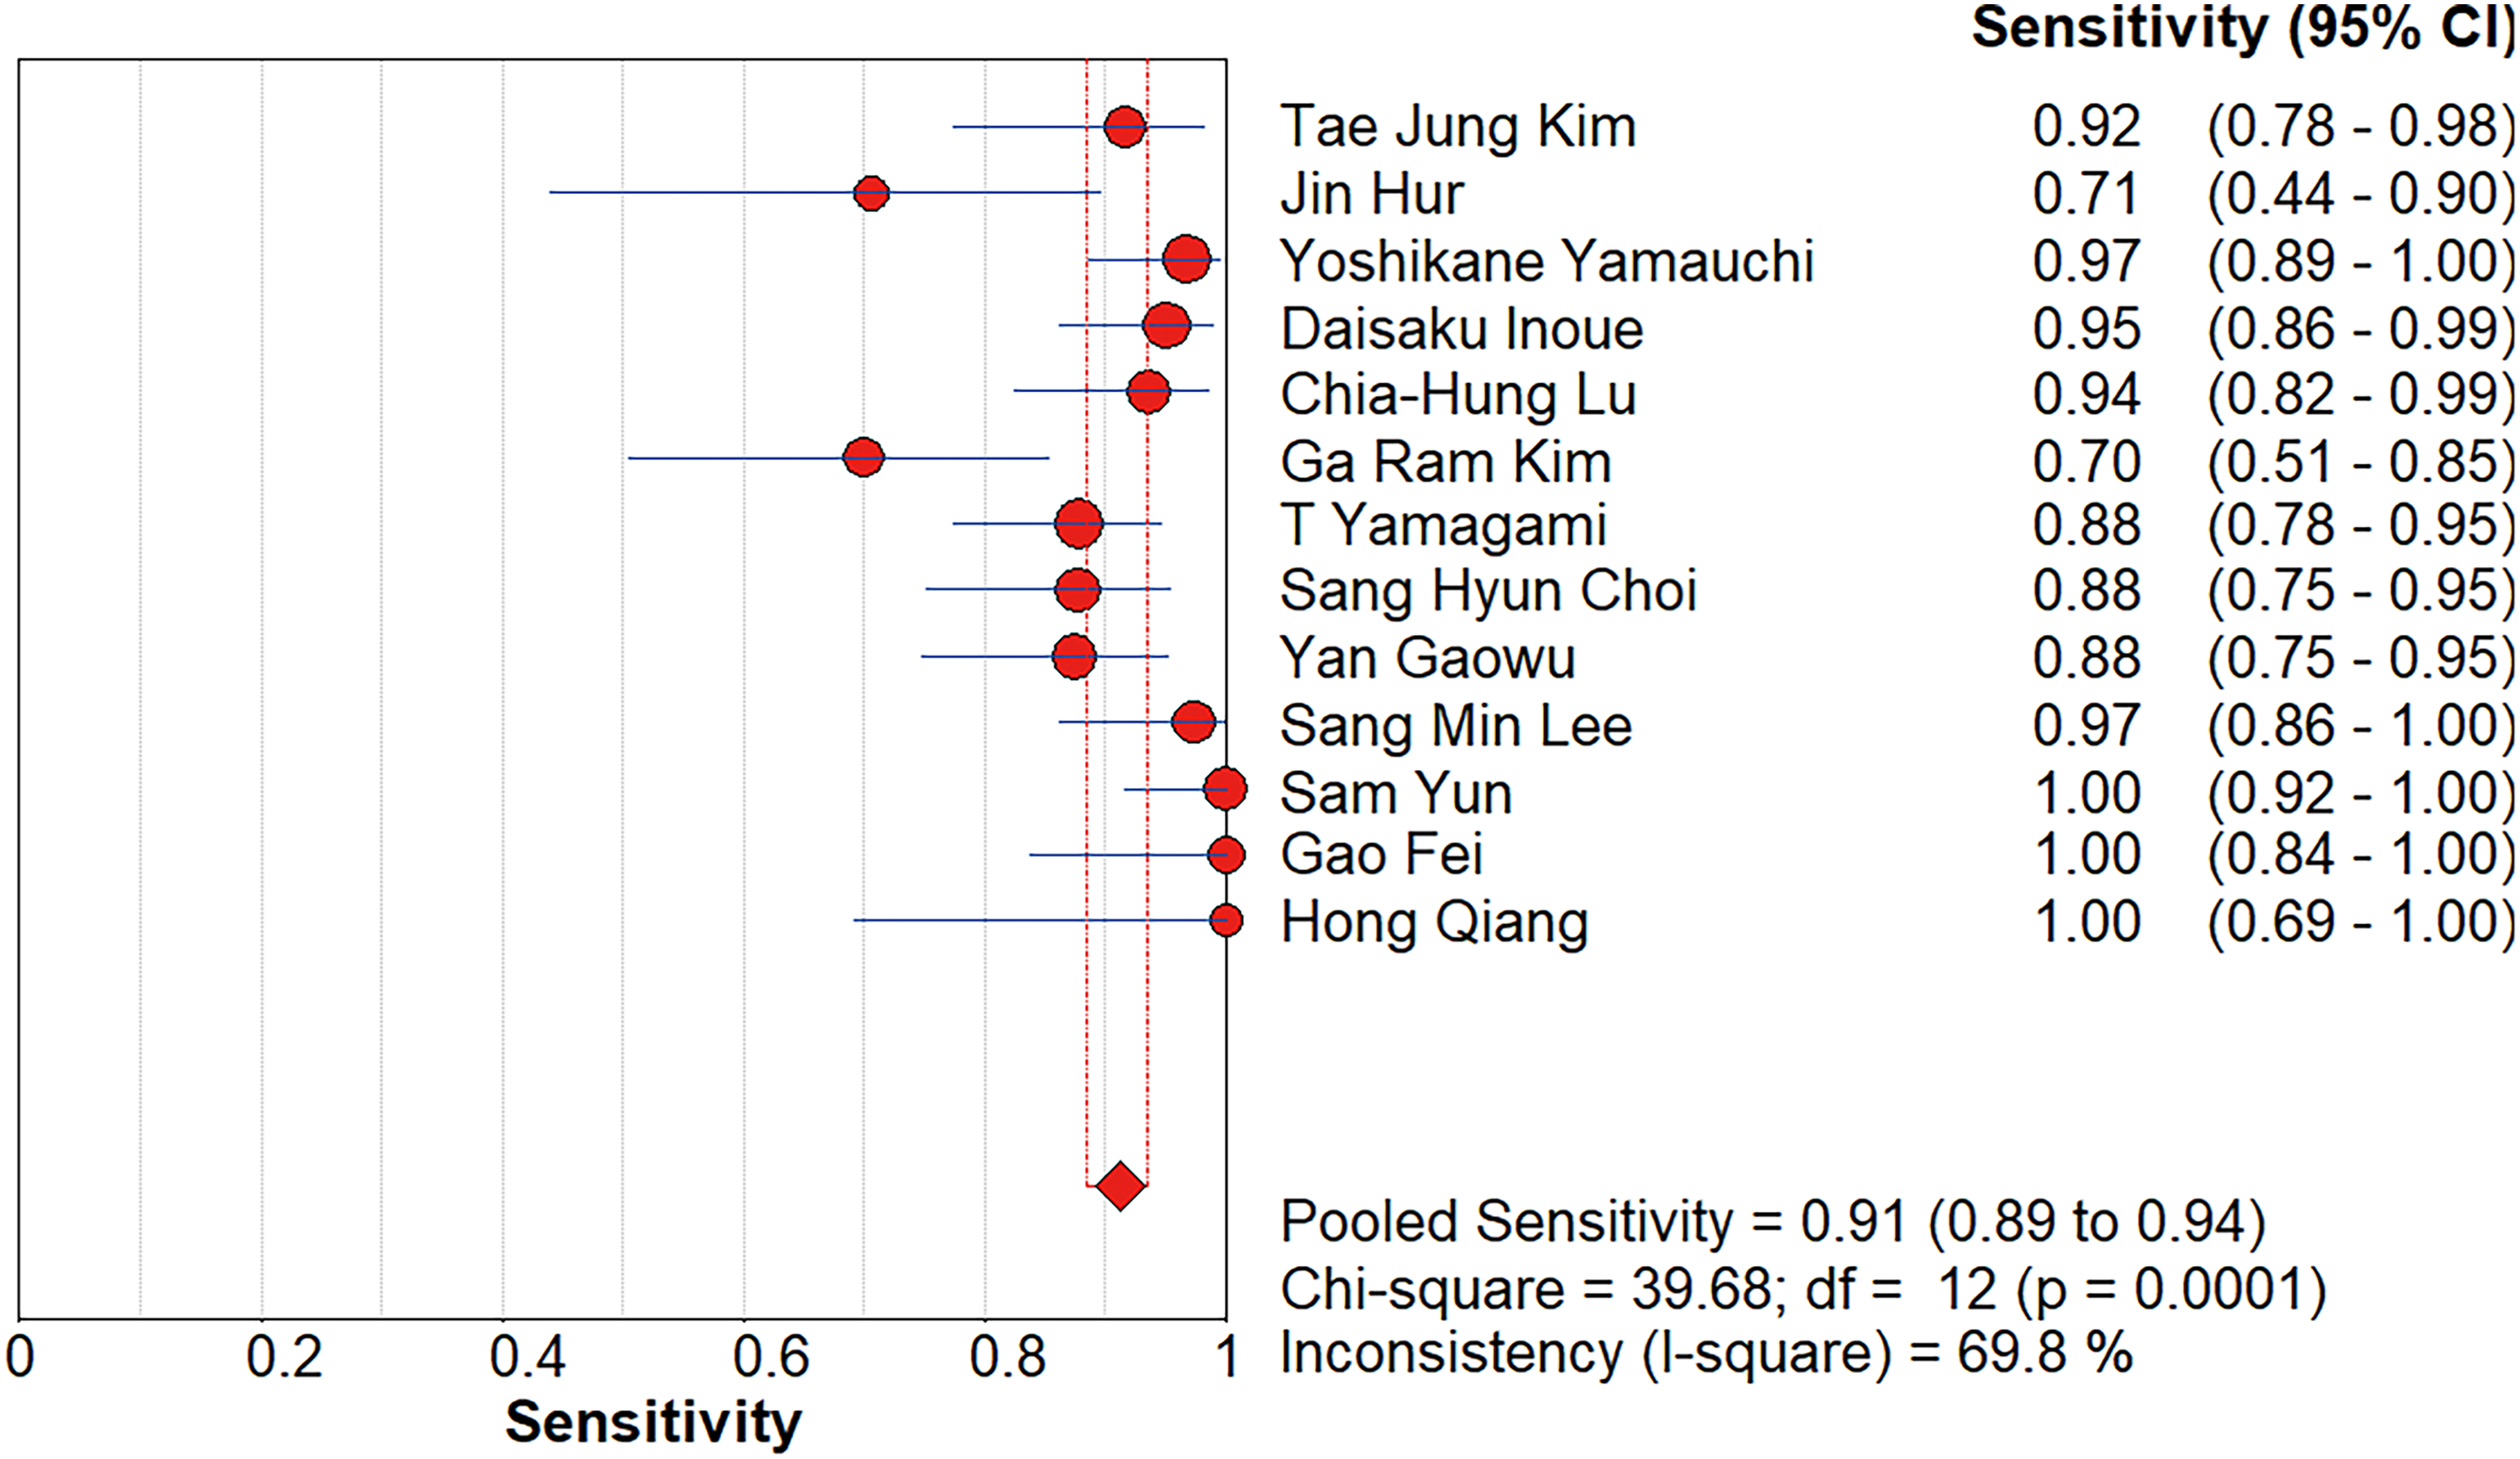
Forest plots of sensitivity, specificity, and diagnostic odds ratio.

Forest plots of sensitivity, specificity, and diagnostic odds ratio.
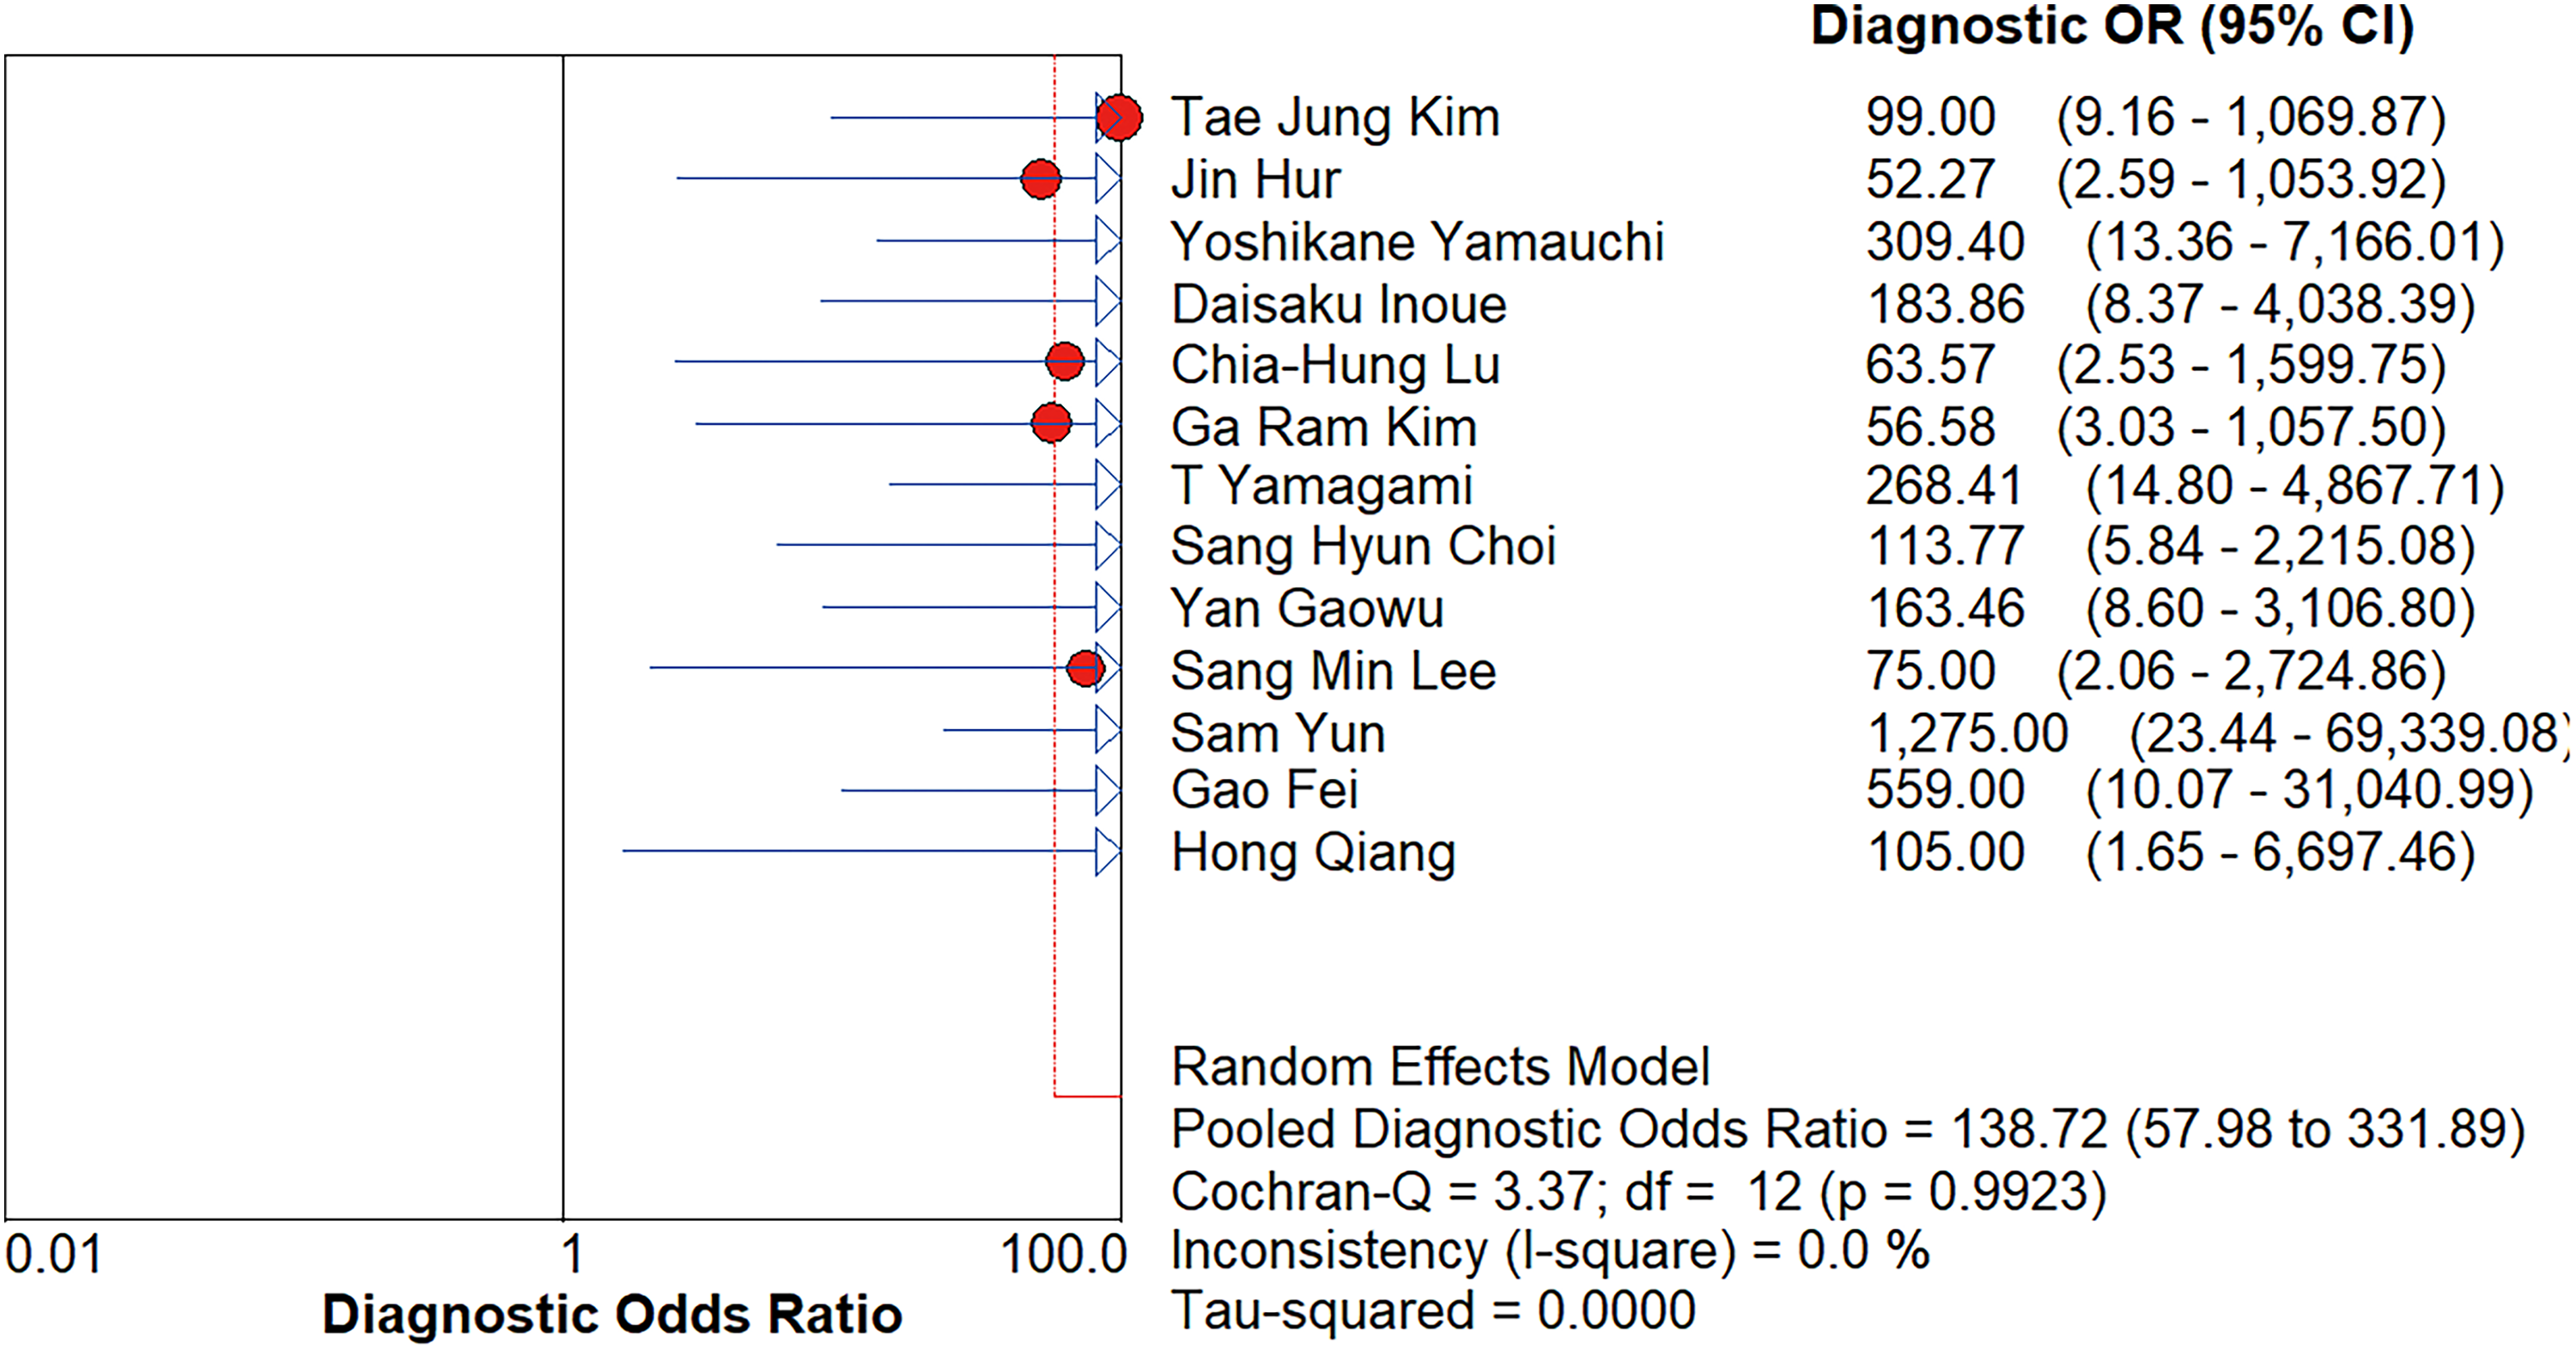
Forest plots of sensitivity, specificity, and diagnostic odds ratio.
Assessment of the threshold effect
Analysis of the diagnostic threshold showed that the Spearman correlation coefficient was 0.596 (P = 0.032). In addition, the representation in the SROC curve showed that the pattern of the points in the plot was not a shoulder-arm shape. Both results indicated that the diagnostic threshold effects were not observed in the included studies (Fig. 5).
Results of the meta-analysis on the clinical value of puncture biopsy
In this meta-analysis of 14 studies, pooled SEN, SPE, and DOR were counted as the primary results. The result of pooled SEN and SPE were 0.91 (95% CI = 0.89–0.94) and 0.99 (95% CI = 0.95–1.00), respectively (Figs. 3 and 4). Fig. 5 showed the DOR was 138.72 (95% CI = 57.98–331.89) and the AUC was 0.97 (Fig. 6).

Summary receiver operating characteristic curve of meta-analysis.
Publication bias assessment
Publication bias was evaluated by Deeks’ funnel plots, which was displayed in Fig. 7. The results showed that P = 0.50, indicating that the funnel plot was basically symmetrical and there was no significant publication bias in the study.
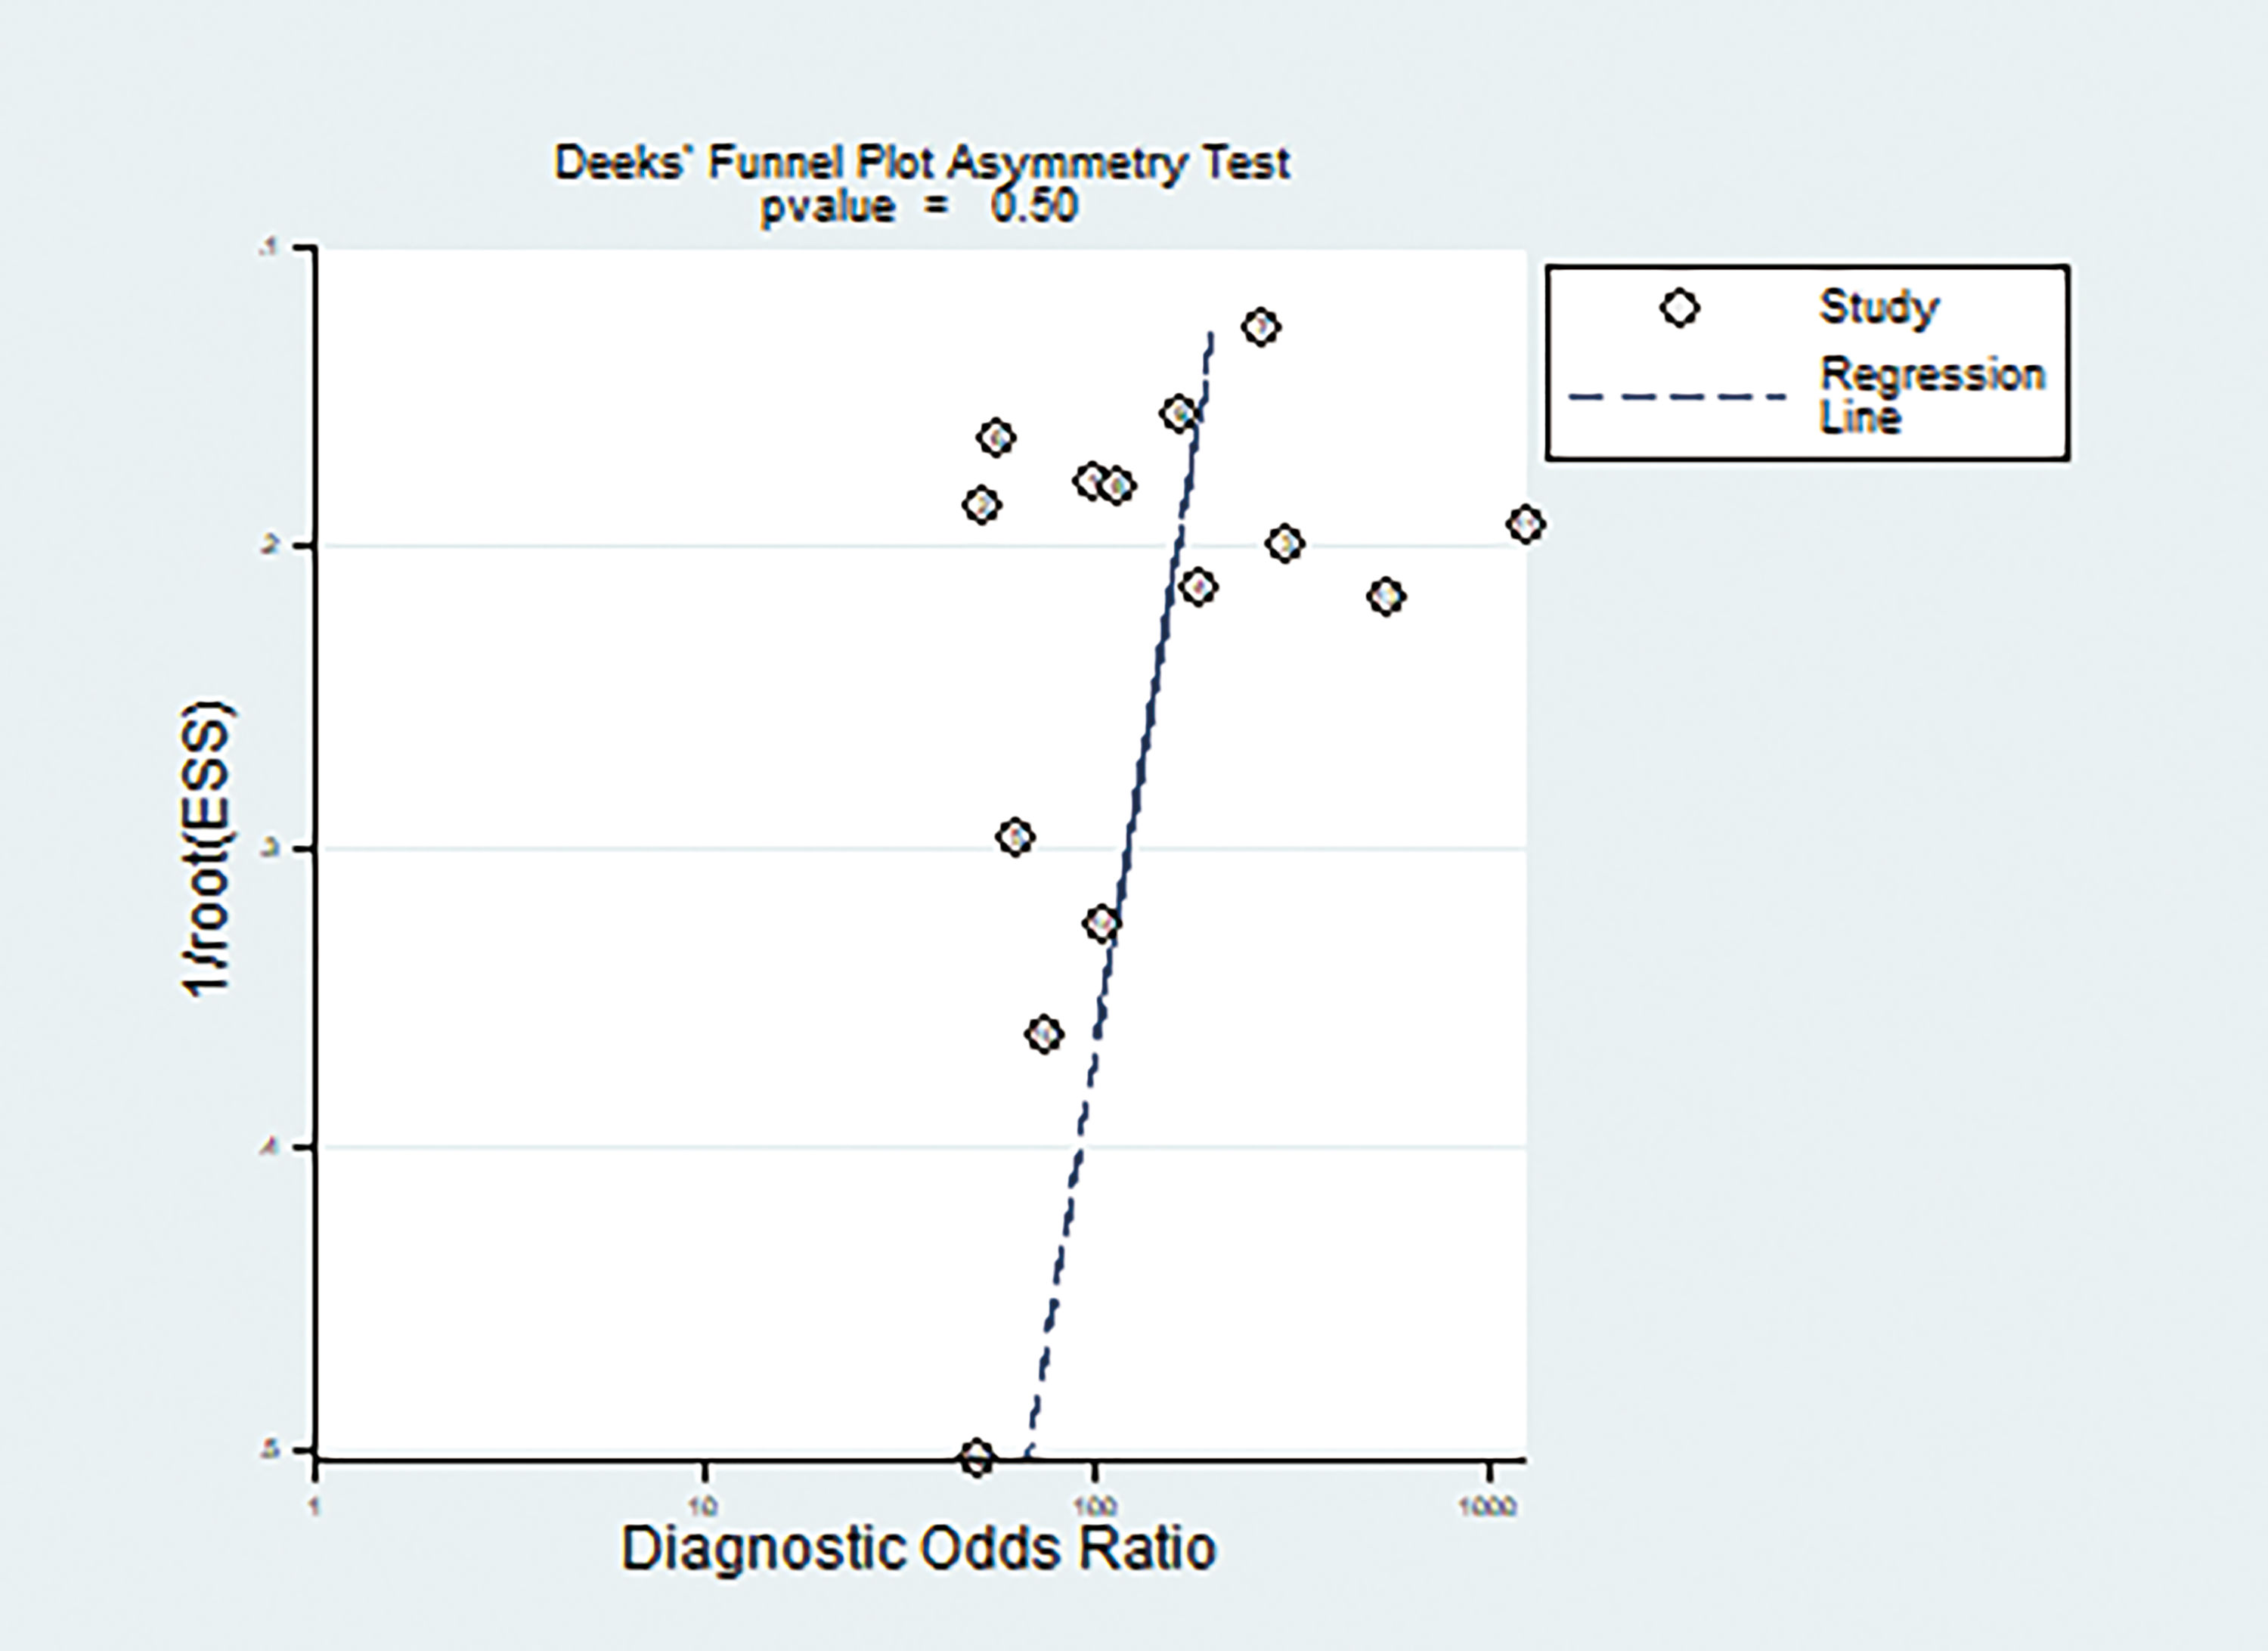
Deeks’ funnel plot of meta-analysis.
Subgroup analysis
We divided the included studies into two groups according to whether they used spiral CT guidance or CT fluoroscopy guidance biopsy. The pooled SEN, SPE, and DOR of the two subgroups are shown in Table 2, which demonstrates that the different operation methods did not bring much heterogeneity. A forest plot was shown in Fig. 8.
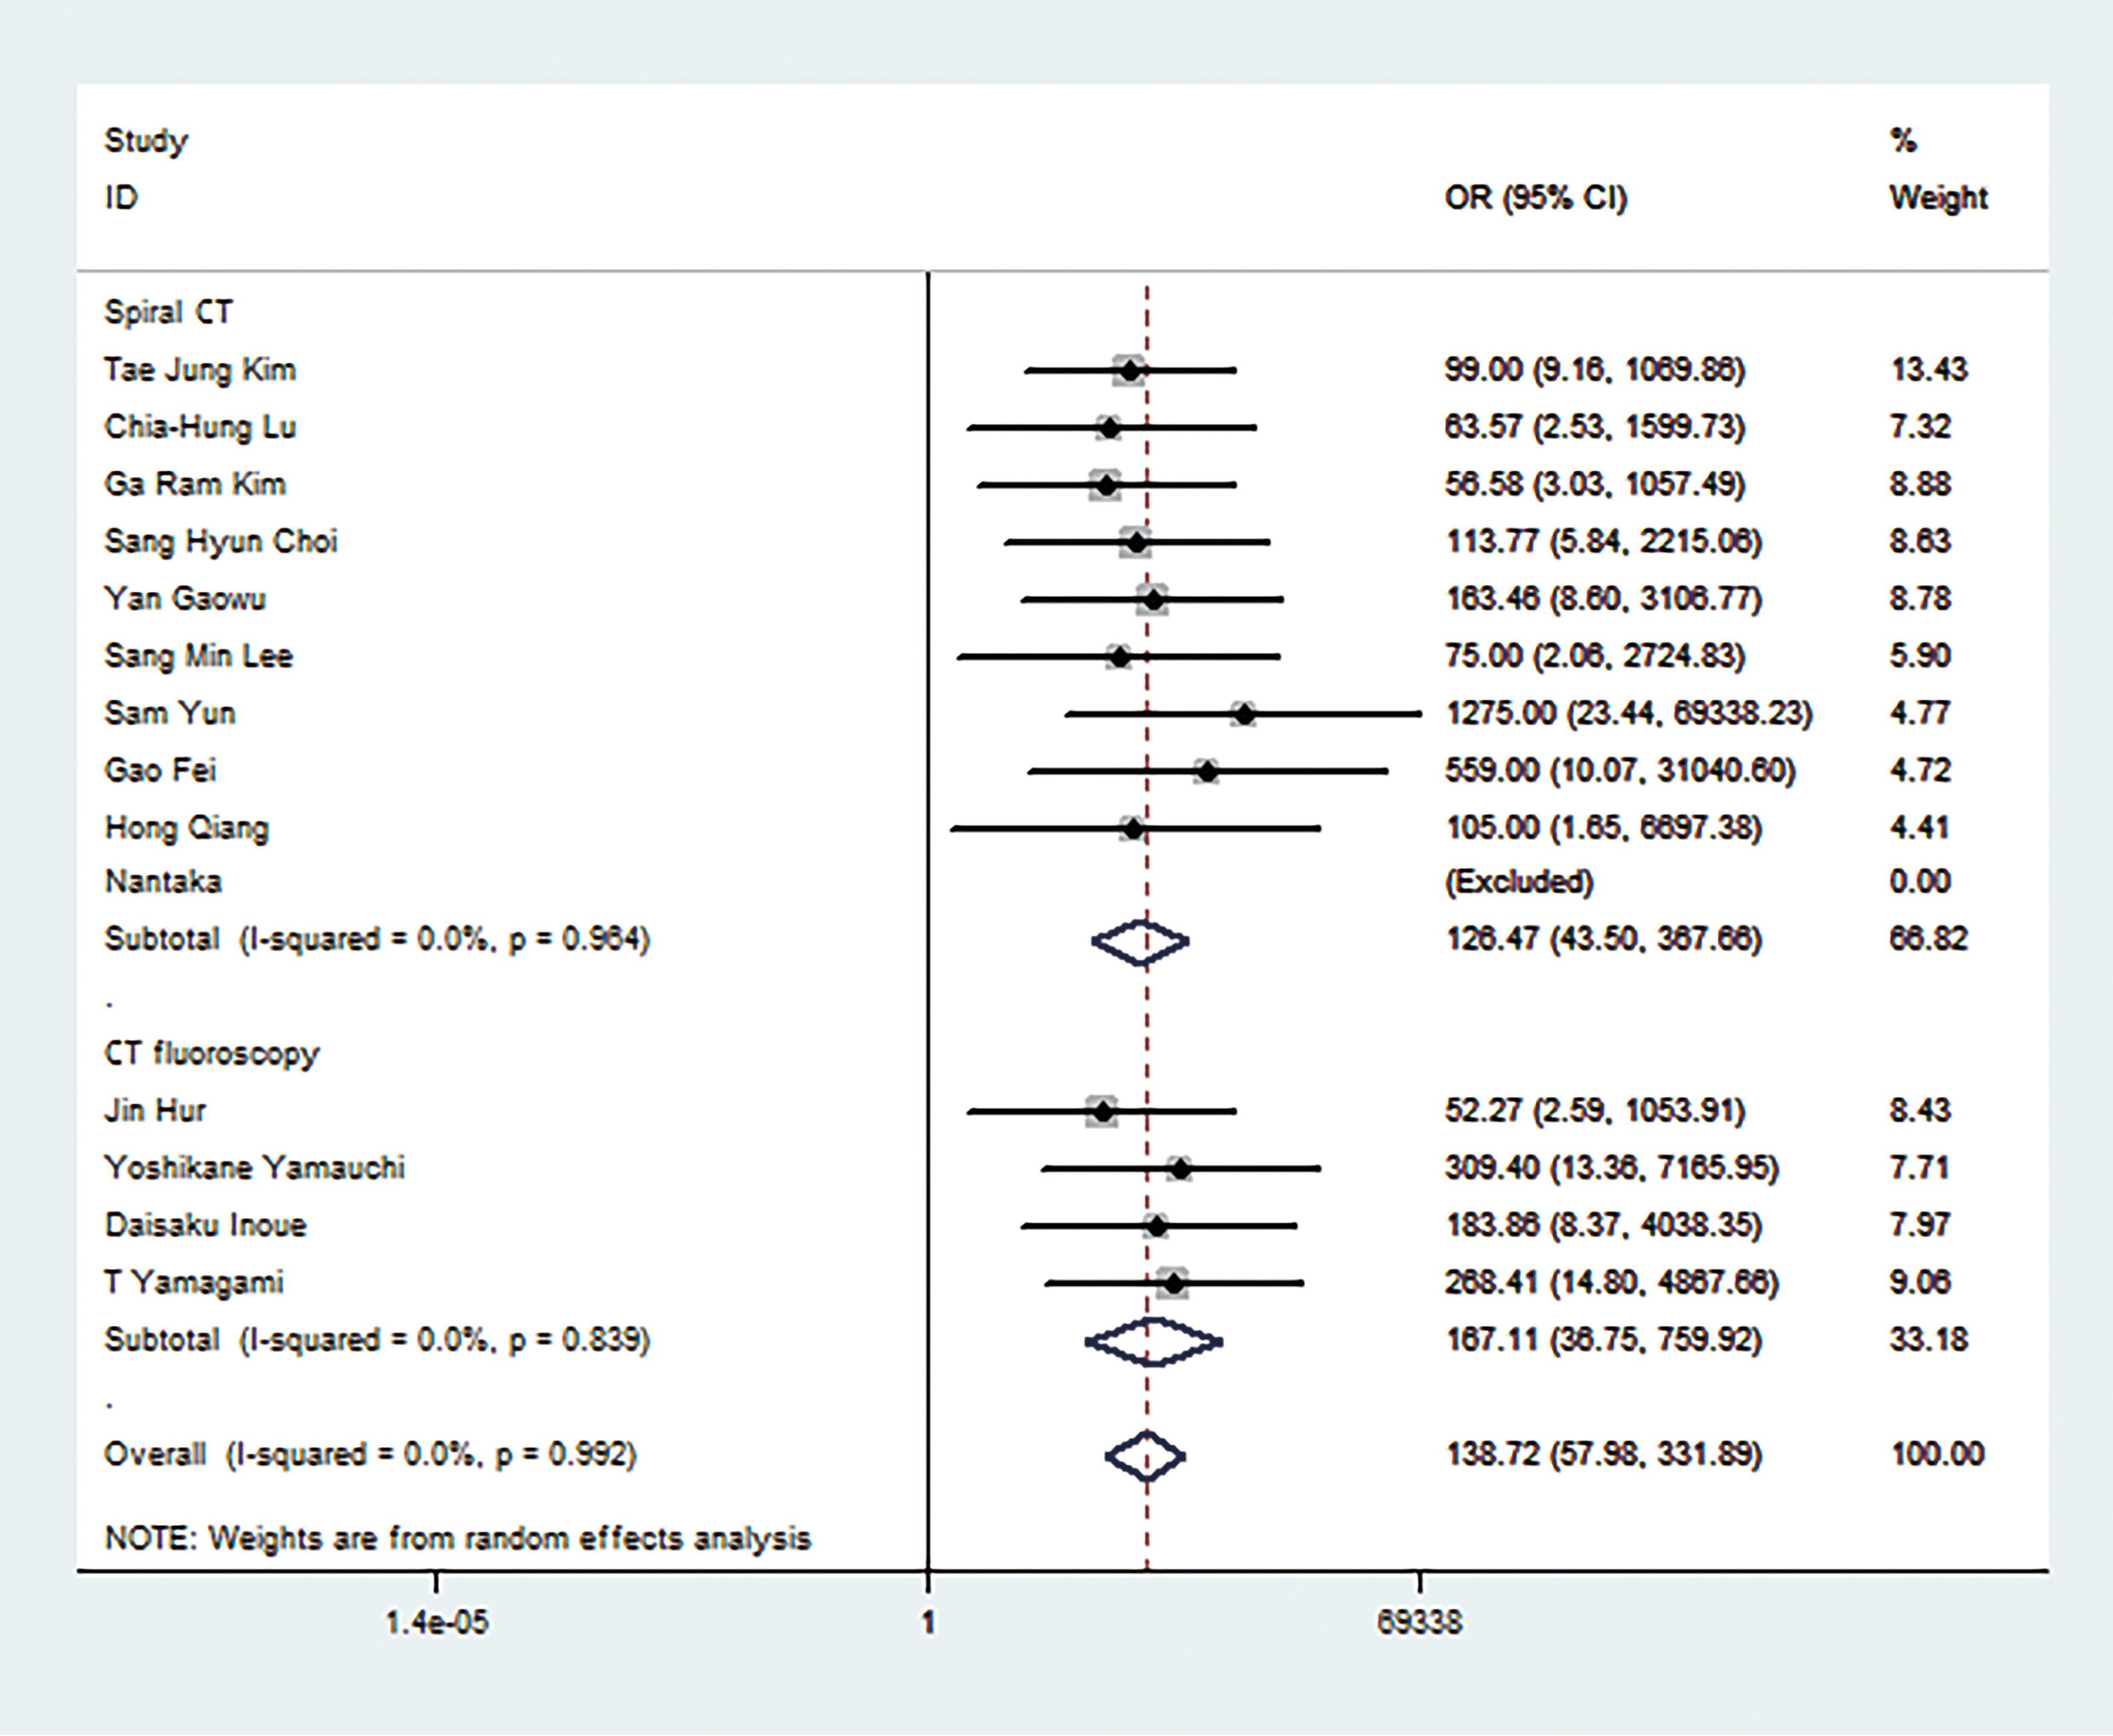
Forest plots of subgroup analysis. AUC, area under the curve; CI, confidence intervel; OR, odds ratio; SE, standard error.
Subgroup analysis of diagnostic accuracies.

CI, confidence interval; CT, computed tomography; DOR, diagnostic odds ratio; SEN, sensitivity; SPE, specificity.
Discussion
This meta-analysis contains 14 studies among which heterogeneity is inevitable. Diverse sample sizes, different scanning machine, and different puncture methods in each study may contribute to heterogeneity. To reduce heterogeneity, we performed a subgroup analysis on a scanning machine, and the heterogeneity was acceptable overall. The heterogeneity caused by different puncture methods made it difficult to perform a subgroup analysis , because there were two studies using two puncture methods at the same time, and the specific data of each puncture method could not be extracted from the original study (9,13). The Deeks’ funnel plots showed that no significant publication bias exists in these studies.
In the end, the main result of the present study is that the pooled SEN, SPE, and DOR of CT-guided percutaneous puncture biopsy is 0.91 (95% CI = 0.89–0.94), 0.99 (95% CI = 0.95–1.00), and 138.72 (95% CI = 57.98–331.89), respectively, which signified high diagnostic accuracy for patients with pulmonary GGNs. The SROC curve presented an overall summary of SEN and SPE, with an AUC of 0.97, also indicating a high overall accuracy. This result was similar to the article published in 2014, in which the SEN was in the range of 0.71–0.97 (pooled 0.92; 95% CI = 0.88–0.95), while SPE was in the range of 0.80–0.97 (pooled 0.94; 95% CI = 0.84–0.98) (16), and more related original studies that expanded the sample size have been included in our study (7,9–15).
Radiological “GGN-like” lung adenocarcinoma is a relatively inert subtype of tumor, although it has the histological and morphological features of “lung adenocarcinoma” (17). Most malignant pulmonary GGNs are in the early stage of lung cancer, with small lesion size and low malignant degree. Surgery is the standard treatment for early-stage lung cancer. According to different histopathologic subtypes, different surgical methods were selected. The five-year disease-free survival rate of sub-lobectomy for atypical adenomatoid hyperplasia, adenocarcinoma in situ, and microinvasive adenocarcinoma was 100% (18,19). CT-guided percutaneous puncture biopsy can not only diagnose whether GGN is malignant, but also further identify the pathological subtypes of the diseased tissues (20). Therefore, CT-guided percutaneous puncture biopsy has high clinical application value for treatment selection.
In Lung-RADS (Lung CT Screening Reporting and Data System) version 1.1 released in 2019 (21), the risk of malignancy of pure GGNs was <2% even though the length of GGN >30 mm, which was possibly underestimated based on current evidence (22,23), and the management it recommended was a six-month low-dose chest CT follow-up. Due to the high possibility of malignancy of GGN >30 mm, patients with regular follow-up are prone to anxiety. Puncture is a means to make a clear diagnosis and treatment more quickly.
Complications may occur after a puncture biopsy, and the two most common complications are pneumothorax and hemorrhage. In the 14 included studies with 759 patients in this meta-analysis, only 1 (0.13%) asymptomatic air embolism occurred, which may progress to a serious complication. According to a published study, compared to solid lesions, the occurrence of major hemorrhage, pneumothorax, and major pneumothorax was not significantly different between GGNs and solid lesions, which signified that the safety of puncture biopsy on solid lesions or GGN lesions is roughly the same (12).
The present study has some limitations. First, although there were 14 included studies, the total sample size was still not large enough. Second, differences in scanning machine and puncture methods may lead to heterogeneity, which was inevitable. Third, puncture complications and diagnostic accuracy of pathological subtypes were not included in the results due to incomplete data from original studies. Therefore, our conclusions need to be verified by studies with a larger sample size in the future.
In conclusion, limited to current research, the diagnostic accuracy of CT-guided percutaneous puncture biopsy of pulmonary GGNs is high, and the operation is relatively safe. The study can provide information for further patient management.
Footnotes
Acknowledgements
We thank Wuhan University for providing the platform for literature search and Zhongnan Hospital for administrative support.
Declaration of conflicting interests
The author(s) declared no potential conflicts of interest with respect to the research, authorship, and/or publication of this article.
Funding
The author(s) received no financial support for the research, authorship, and/or publication of this article.
