
Abstract
Background
Medulloblastomas are a major cause of cancer-related mortality in the pediatric population. Four molecular groups have been identified, and these molecular groups drive risk stratification, prognostic modeling, and the development of novel treatment modalities. It has been demonstrated that radiomics-based machine learning (ML) models are effective at predicting the diagnosis, molecular class, and grades of CNS tumors.
Purpose
To assess radiomics-based ML models’ diagnostic performance in predicting medulloblastoma subgroups and the methodological quality of the studies.
Material and Methods
A comprehensive literature search was performed on PubMed; the last search was conducted on 1 May 2022. Studies that predicted all four medulloblastoma subgroups in patients with histopathologically confirmed medulloblastoma and reporting area under the curve (AUC) values were included in the study. The quality assessments were conducted according to the Quality Assessment of Diagnostic Accuracy Studies-2 (QUADAS-2) and Checklist for Artificial Intelligence in Medical Imaging (CLAIM). A meta-analysis of radiomics-based ML studies’ diagnostic performance for the preoperative evaluation of medulloblastoma subgrouping was performed.
Results
Five studies were included in this meta-analysis. Regarding patient selection, two studies indicated an unclear risk of bias according to the QUADAS-2. The five studies had an average CLAIM score and compliance score of 23.2 and 0.57, respectively. The meta-analysis showed pooled AUCs of 0.88, 0.82, 0.83, and 0.88 for WNT, SHH, group 3, and group 4 for classification, respectively.
Conclusion
Radiomics-based ML studies have good classification performance in predicting medulloblastoma subgroups, with AUCs >0.80 in every subgroup. To be applied to clinical practice, they need methodological quality improvement and stability.
Introduction
Medulloblastoma (MB) is a small blue cell malignancy of the cerebellum, and about 40% are located in the posterior cranial fossa (1,2). MBs constitute approximately 25% of all pediatric tumors (1) and are the leading cause of cancer-related death in children aged under 15–16 years (3). Despite the increase in survival rates in recent years, the five-year survival rate remains at 65%–70%, with surgical resection plus chemoradiotherapy (4). The heterogeneity in clinical outcomes is due to the unique biological properties of tumors (5). Four molecular subgroups—wingless (WNT), sonic hedgehog (SHH), group 3, and group 4—have been discovered in recent years. These four molecular subgroups have been incorporated into the World Health Organization (WHO) classification of central nervous system (CNS) tumors since 2016 (6). Today, risk stratification, prognostic modeling, and the development of novel treatment modalities are all driven by these molecular subgroups (7–10).
Several molecular analysis techniques using tumor specimens from surgical resection have been developed to perform the molecular subgrouping of MBs. These techniques might not be adopted for routine clinical practice in many medical centers, particularly those with limited resources, due to technical complexity and high costs (11). Intratumor heterogeneity of tumors may result in sampling errors and, thus, misclassification (12,13). Likewise, tumor samples obtained during surgery and later analyzed in the laboratory do not allow clinicians to tailor their treatment strategies preoperatively.
Magnetic resonance imaging (MRI) is more widely available than complex molecular analysis methods and can produce high-resolution medical images. Despite not being a substitute for the molecular analysis of the tumor specimen, predicting MB subgroups with MRI offers a non-invasive, preoperative, and cheaper route to MB subgrouping. A few studies attempted to correlate MB subgroups with semantic radiologic features such as contrast enhancement, hemorrhage, cystic change, and so on (14–18). However, these human-recognized qualitative features do not account for all the multidimensional data acquired by MRI and are susceptible to inter-observer variability.
In the past decade, radiomics has emerged as a general term to describe the technologies used to analyze medical images and the imaging features obtained during the process. With the high-throughput extraction of quantitative imaging features from radiologic images, radiomics enables the characterization of imaging phenotypes (19,20). Radiogenomics, in particular, is the study of the association between the genome and radiologic images (21). Radiomics-based machine learning (ML) models have been shown to be successful in predicting diagnosis, molecular class, and grades of other CNS tumors, including gliomas (22) and meningiomas (23,24). More recently, deep learning (DL) models have been utilized in similar classification tasks without using pre-engineered radiomic features (25,26).
The aim of the present study was to perform a systematic review and meta-analysis of radiomics-based ML models’ diagnostic performance in predicting MB subgroups. In addition, we analyzed the methodological quality of the included studies. We present the following article in accordance with the Preferred Reporting Items for Systematic Reviews and Meta-analysis for Diagnostic Test Accuracy (PRISMA-DTA) reporting checklist (27).
Material and Methods
Literature search
A comprehensive literature search was performed based on the following combination of Medical Subject Headings (MeSH) terms and keywords for a PubMed database search: “radiomic*”(tiab) OR “radiogenom*”(tiab) OR “machine learning”(MeSH) OR “machine learning*”(tiab) OR “deep learning*” OR “artificial intelligence*”) AND “medulloblastoma”(MeSH) OR “medulloblastoma*”(tiab) OR “posterior fossa tumor*”(tiab) OR (“posterior”(tiab) AND “fossa*”(tiab) AND “tumor*”(tiab)) OR “astrocytoma”(MeSH) OR “astrocytoma*”(tiab) OR “pilocytic astrocytoma”(tiab) OR “ependymoma”(MeSH) OR “ependymoma*”(tiab)). The last search was conducted on 1 May 2022.
Study selection
Two authors (AO and BK) determined the eligibility of the articles through title and abstract screening. The full text of articles thought to involve a radiomics-based ML model in patients with MB were obtained for further evaluation. The reference lists of the included studies were manually searched to identify other relevant studies.
Articles were included based on the fulfillment of all the following criteria: (i) patients with histopathologically confirmed MBs; (ii) available molecular subgroup information; (iii) molecular subgroup was predicted with a radiomics-based ML model; (iv) area under the curve (AUC) values were reported separately for four molecular subgroups (SHH, WNT, group 3, and group 4); and (v) original research articles.
The exclusion criteria were as follows: (i) MB molecular subgroups were not predicted; (ii) a radiomics-based ML model was not utilized to predict molecular subgroups; (iii) AUC values were not separately reported for four molecular subgroups; and (iv) reviews, letters, commentaries, or errata.
Data extraction
Data were collected by the two authors (AO and BK) for the following variables: (i) study characteristics (author, year, country, number of patients, age, sex, and distribution of molecular subgroups); (ii) MRI sequences used in models; (iii) type of data used in models; (iv) classification algorithm used for subgroup prediction; (v) validation method; and (vi) AUC values for each molecular subgroup classification. The data used in the meta-analysis were obtained from the validation sets in each study. When multiple validation sets were present in a study, higher AUC values for the subgroup classification were included in the meta-analysis.
Quality assessment
The quality assessments were conducted by two authors (MK and BBO) independently according to the Quality Assessment of Diagnostic Accuracy Studies-2 (QUADAS-2) and Checklist for Artificial Intelligence in Medical Imaging (CLAIM) (28,29). Any disagreements were resolved through discussion or with the assistance of a third author (AO).
Four domains were evaluated with QUADAS-2: (i) patient selection; (ii) index test; (iii) reference standard; and (iv) flow and timing. The patient selection domain includes questions about patient selection methods. The index test domain provides questions concerning the index test and how it was performed and analyzed. The reference standard domain provides questions about the reference standard and how it was conducted and interpreted. The flow and timing domain questions whether patients did not get an index test or reference standard or were excluded from the confusion matrices. Concerns about the risk of bias and applicability were rated as low, high, or unclear on a 3-point scale.
The 42-item checklist, CLAIM, is used to assess the quality of artificial intelligence (AI) studies in medical imaging. Studies were scored on a 2-point scale of 0 or 1. The scores of each item were summed to calculate the CLAIM score for a study. The ratio of fulfilled items among the applicable items for each study was defined as the CLAIM compliance score.
Meta-analysis
In the meta-analysis, the AUC standard errors were calculated using the total number of patients in the related subgroup and the total number of patients. The inverse variance method was used to calculate the weight of each study. The results from all included studies were pooled for each subgroup, and an overall estimate of effect size was evaluated using a random-effects model. Heterogeneity across all included studies’ subgroups was estimated using Q-test, with P < 0.05 indicating the presence of study heterogeneity and I2 statistics. I2 values were defined as follows: heterogeneity that might not be important (0%–25%); low heterogeneity (26%–50%); moderate heterogeneity (51%–75%); and high heterogeneity (76%–100%) (30). Publication bias was not assessed in our analysis, as the small number of studies included in our meta-analysis (n = 5) may lead to inconclusive funnel plots and regression tests for detecting publication bias (31). Two-sided P values ≤0.05 were considered statistically significant.
All statistical analyses were conducted using R version 3.4.1 (R Foundation for Statistical Computing), implementing R package auctestr, and MedCalc Statistical Software version 20.110 (Ostend, Belgium) (32,33).
Results
Literature search
The study selection process is illustrated in Fig. 1. The initial literature search yielded 500 articles. These 500 articles were screened based on their title and abstract, and 474 were excluded. Full texts of the remaining 26 articles were obtained and reviewed.
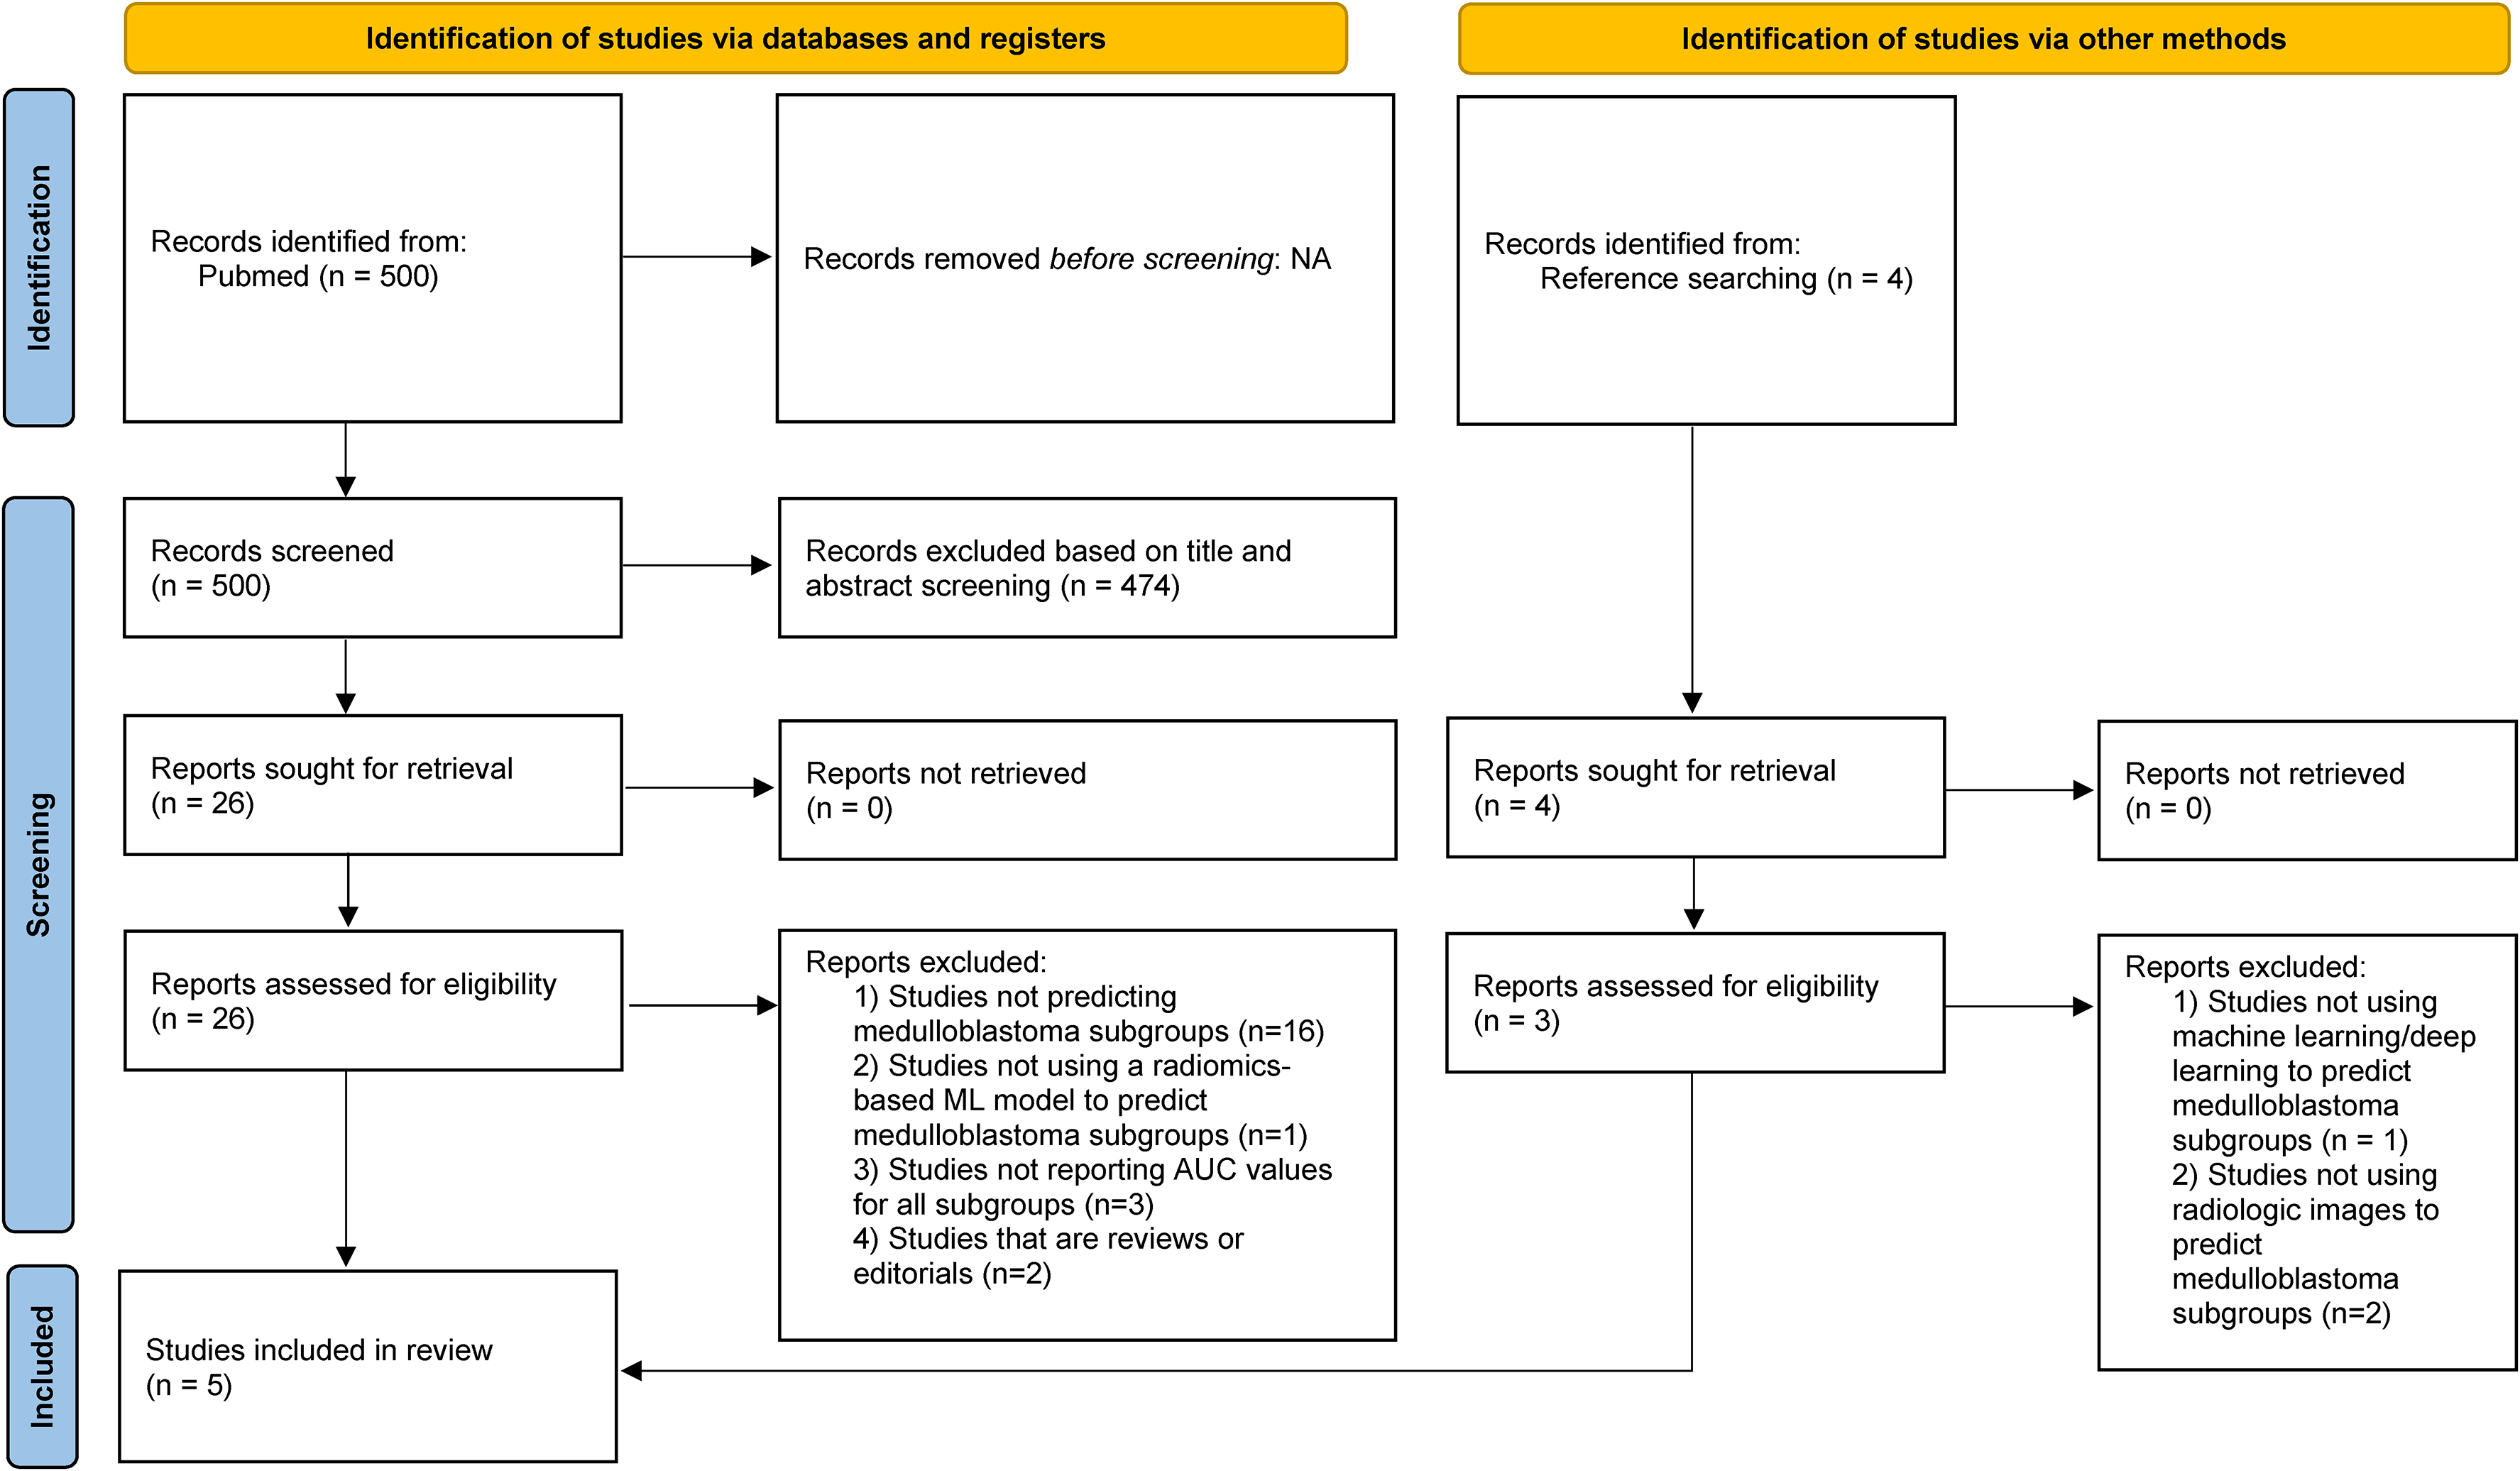
The study selection process.
A total of 22 articles were excluded because they did not predict MB subgroups (n = 16), did not use a radiomics-based ML model to predict MB subgroups (n = 1), did not report AUC values for all subgroups (n = 3), or were reviews, letters, commentaries, or errata (n = 2).
Four articles were obtained and reviewed when the references provided in the included studies were also screened. One article was again excluded because it did not involve a radiomics-based ML model to predict MB subgroups. Two articles were excluded because they did not use radiologic imaging data to predict MB subgroups.
Finally, five original articles that included 420 patients with MBs were eventually included in the study (34–38). Among these 420 patients, 289 were in the validation sets and analyzed in the present study.
Quality assessment
A quality assessment summary of the included studies using the QUADAS-2 tool is shown in Fig. 2. With regard to patient selection, two studies indicated an unclear risk of bias as they failed to mention the inclusion criteria of patient enrollment (37,38). Regarding the reference test, one study was considered to have a high risk of bias, as it used both formalin-fixed and fresh frozen tissue for tissue preservation (34).

Methodological quality of the studies included in the meta-analysis according to the QUADAS-2 tool for risk of bias and applicability concerns.
A quality assessment summary of the included studies using the CLAIM is shown in Table 1. All studies had an item marked as “not applicable” in the methods domain. The mean CLAIM score of the five studies was 23.2 ± 1.92 (range = 20–25). The mean CLAIM compliance score of the five studies was 0.57 ± 0.05 (range = 0.49–0.61).
CLAIM assessment.
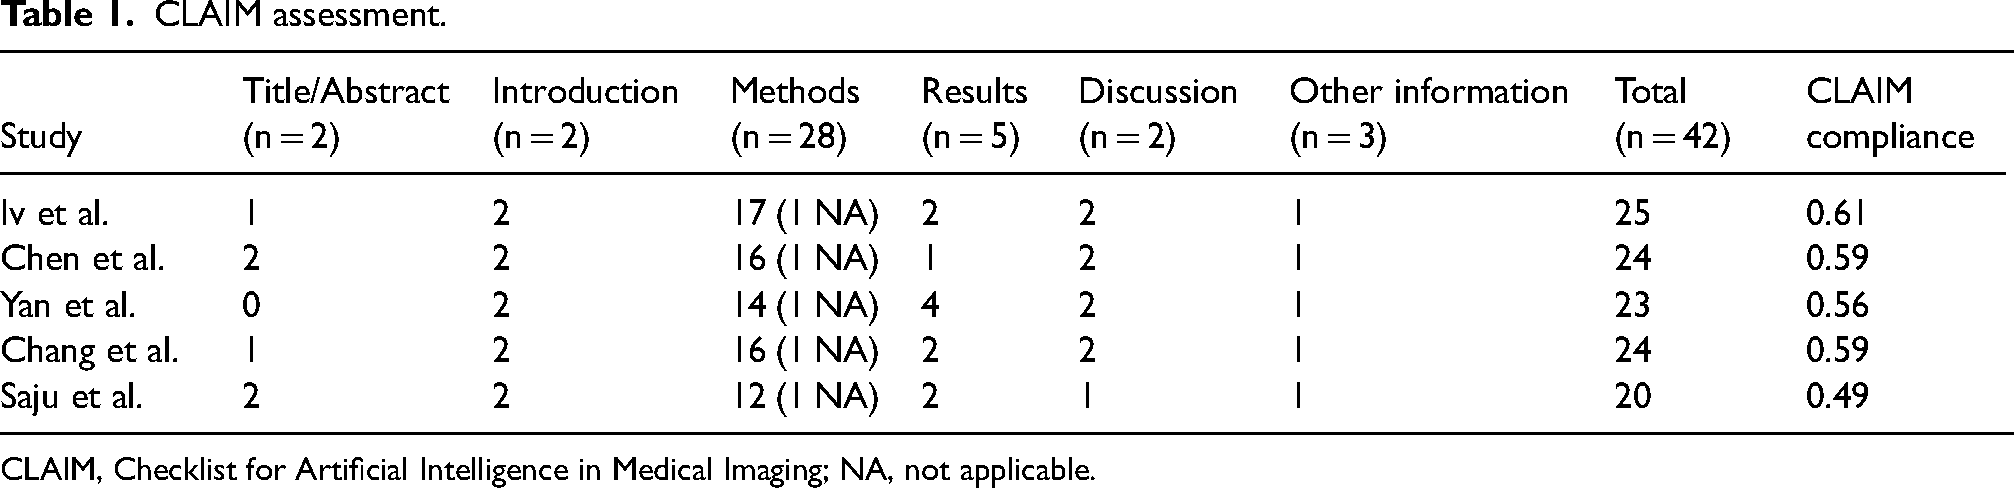
CLAIM, Checklist for Artificial Intelligence in Medical Imaging; NA, not applicable.
Characteristics of included studies
The patient and study characteristics are described in Table 2. Regarding applied MRI sequences, Iv et al. used T1-weighted (T1W) and T2-weighted (T2W) sequences together for radiomic feature extraction (34). Chen et al. and Saju et al. used T1W contrast-enhanced and T2W sequences together (35,38). Yan et al. combined T1W, T2W, fluid-attenuated inversion recovery (FLAIR) sequences, and apparent diffusion coefficient (ADC) values (36). Chang et al. utilized T1W, T2W, FLAIR sequences, and diffusion-weighted imaging (DWI) (37). Three studies used support vector machines as classification algorithms (34,37,38). Yan et al. used random forest algorithm (36), while the study by Chen et al. was the only study that used DL for classification (35). For classification, four studies utilized radiomic features in their algorithm as input (34,35,37,38). Yan et al. included clinical and semantic features along with radiomic features. Chen et al. did not use handcrafted radiomic features, instead applied a convolutional neural network (CNN) model for feature extraction (35). Four of the included studies used various cross-validation methods for validation (37, 38, 40, 41), while Yan et al. used a separate test set (36).
Study characteristics.
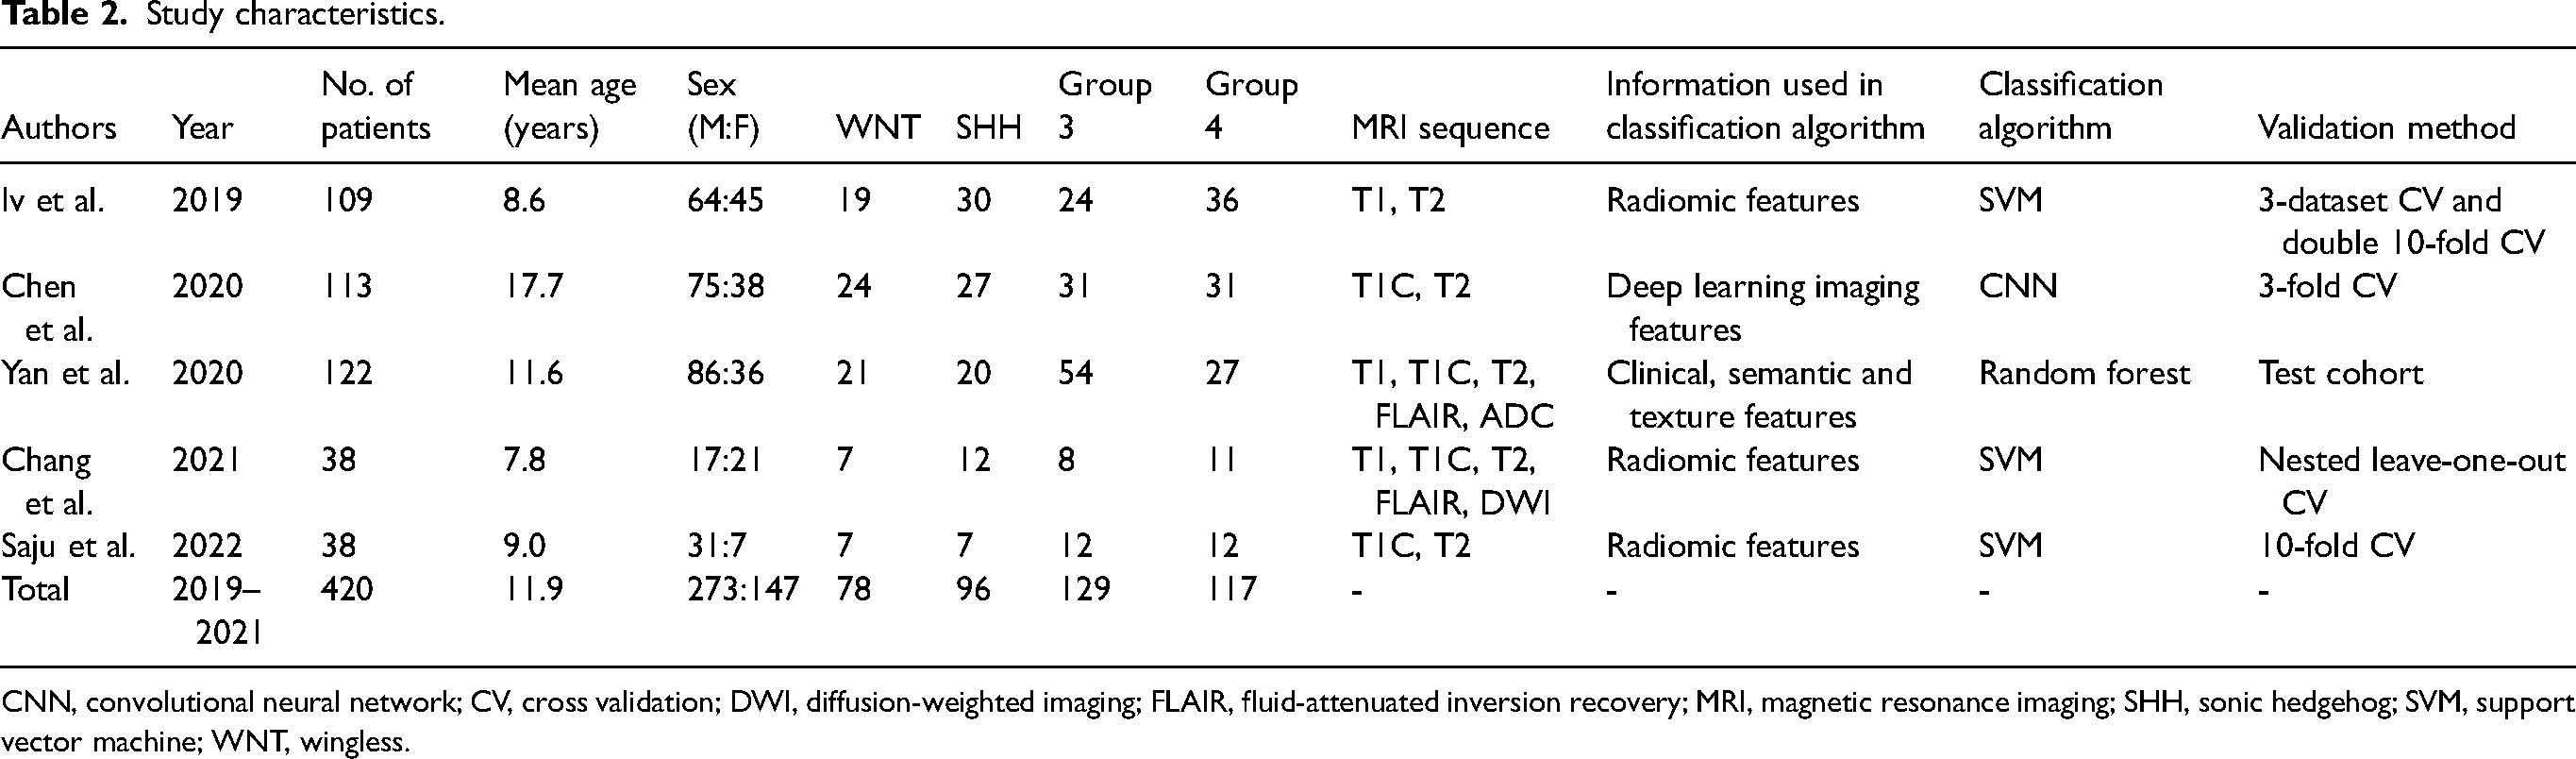
CNN, convolutional neural network; CV, cross validation; DWI, diffusion-weighted imaging; FLAIR, fluid-attenuated inversion recovery; MRI, magnetic resonance imaging; SHH, sonic hedgehog; SVM, support vector machine; WNT, wingless.
Meta-analysis
The studies included in the meta-analysis and AUC and standard error of AUC values for each subgroup classification are reported in Table 3.
Diagnostic performance of the classification algorithms for the subgroups.

AUC, area under the curve; SE, standard error; SHH, sonic hedgehog; WNT, wingless.
The models for the WNT subgroup classification showed an overall pooled AUC of 0.88 (95% confidence interval [CI] = 0.86–0.96) with a standard error of 0.04 (Fig. 3a). The Q-test demonstrated heterogeneity across the studies (Q = 10.28; P = 0.036), and the Higgins I2 statistic demonstrated the presence of moderate heterogeneity in the WNT subgroup classification (61.11%).
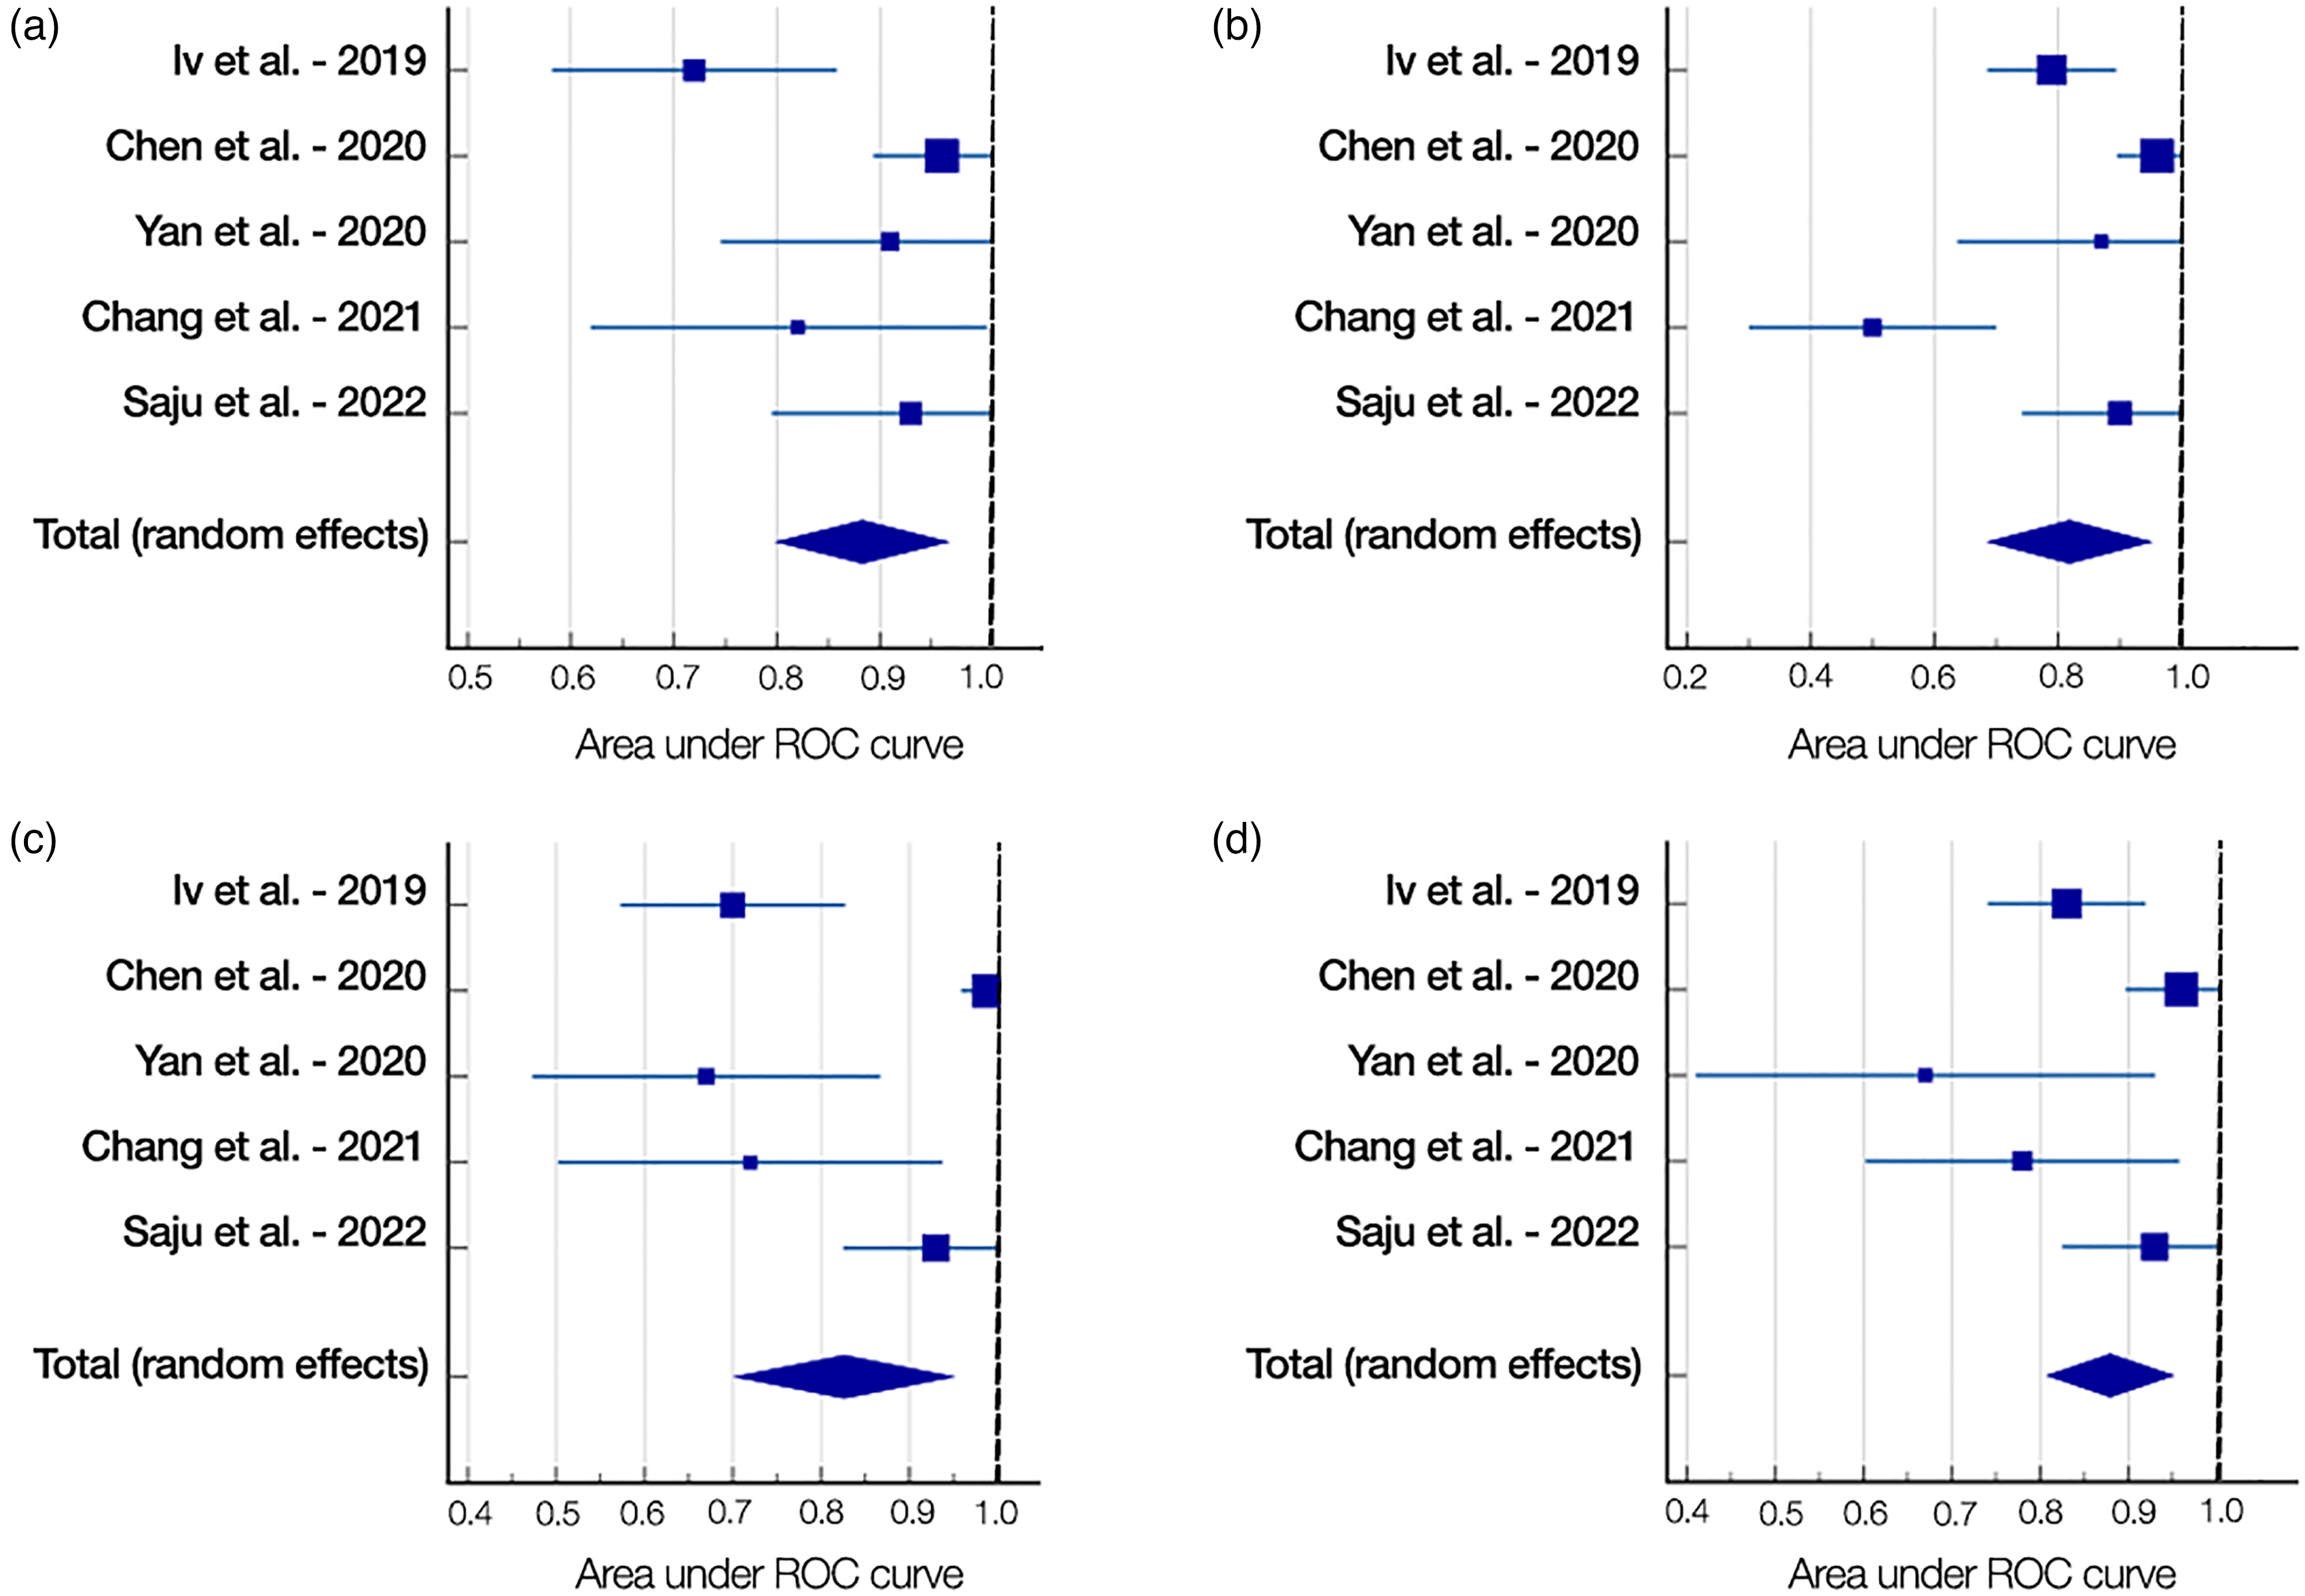
Forest plots of the medulloblastoma subgroup classifications: (a) WNT, (b) SHH, (c) Group 3, and (d) Group 4.
The models for the SHH subgroup classification showed an overall pooled AUC of 0.82 (95% CI = 0.69–0.95) with a standard error of 0.07 (Fig. 3b). The Q-test demonstrated that heterogeneity was present across the studies (Q = 22.63; P < 0.001), and the Higgins I2 statistic demonstrated the presence of high heterogeneity in the SHH subgroup classification (82.32%).
The models for the group 3 subgroup classification showed an overall pooled AUC of 0.83 (95% CI = 0.70–0.95) with a standard error of 0.06 (Fig. 3c). The Q-test demonstrated that heterogeneity was present across the studies (Q = 32.93; P < 0.001), and the Higgins I2 statistic demonstrated the presence of high heterogeneity in the group 3 subgroup classification (87.85%).
The models for the group 4 subgroup classification showed an overall pooled AUC of 0.88 (95% CI = 0.81–0.95) with a standard error of 0.04 (Fig. 3d). The Q-test demonstrated that heterogeneity was present across the studies (Q = 10.88; P = 0.028), and the Higgins I2 statistic demonstrated the presence of moderate heterogeneity in the group 4 subgroup classification (63.25%).
Discussion
Radiomics-based ML models, including the more novel DL approaches, offer a captivating way to get around current obstacles and quicken the transition to personalized medicine. In order to integrate patient-tailored predictions into routine clinical care, new algorithms combine data from imaging studies, molecular markers, and clinical information. Although efforts are being made to standardize the methodological approach, their application outside academic research has not yet been proven appropriate (39–41). The only framework specifically designed for AI and capable of capturing the specifics of model reporting for prediction model studies involving applications of AI to medical imaging is CLAIM (29). Therefore, we used CLAIM to evaluate how the ML/DL models for the prediction of MB subgroups were presented in the included studies. The average CLAIM score and compliance score of the five studies were 23.2 and 0.57, respectively. The compliance score, which measures the ratio of fulfilled items to applicable items, is just above 0.5, which indicates a general lack of methodological quality. It is not known yet if this is valid for all the ML/DL studies or just for the studies included in this meta-analysis. CLAIM is a relatively new checklist, and there have not been many meta-analyses or systematic reviews investigating AI studies with this checklist. A meta-analysis of DL algorithms’ performance in predicting the isocitrate dehydrogenase mutation status of gliomas found that the mean CLAIM compliance score was 0.61 (42). Hence, it might be reasonable to assume that the lack of methodology is a general issue rather than being restricted to this specific field of study.
The QUADAS-2 evaluation of the studies included in the meta-analysis showed an overall low risk of bias but also brought to light some issues. Two studies that did not include the inclusion criteria for patient enrollment indicated an unclear risk of bias with regard to patient selection (37,38). One study that used both formalin-fixed and freshly frozen tissue for tissue preservation was thought to have a high risk of bias with regard to the reference test (34). It is shown in the literature that different techniques of tissue preservation may result in different genetic analyses (43).
Overall, with pooled AUC values >0.80 for all MB subgroups, radiomics-based ML/DL approaches offer great potential for MB subgrouping. All the studies, except for Chen et al. who employed a CNN model, used handcrafted radiomic features. Given that the DL approach is more “data hungry” compared with ML algorithms, which is not feasible in many research settings, this is reasonable (44). Federated learning has been identified as a promising field of research to overcome this need of data-driven models without breaking privacy regulations (45). Only Yan et al. trained a model using semantic radiological features, clinical parameters, and texture features together (36). Though it may be counter-intuitive, AUC values for the group 3 (0.67) and group 4 (0.67) classifications are the lowest, suggesting that this multimodal approach may not essentially increase model accuracy.
The accuracy metrics in selected studies were non-uniform and inconsistent. Not every study reported confusion matrices, which help obtain metrics like sensitivity, specificity, and accuracy while allowing for comprehensive meta-analyses. Authors of the included studies were approached via email to inquire about these metrics, but just one author supplied them. This lack of incomplete reporting in radiomics-based ML studies was previously reported in meta-analyses (23,46). Due to the unavailability of confusion matrices, our meta-analysis employed the most commonly reported metric, AUC values.
The confusion matrices at all threshold values are used to create the receiver operating characteristic (ROC) curve, which summarizes performance. AUC converts the ROC curve into a numerical gauge of a binary classifier's effectiveness. It measures how well a model can distinguish between positive and negative classifications. In general, AUC values in the range of 0.9–1 were considered excellent, 0.8–0.9 were considered good, 0.7–0.8 were considered fair, 0.6–0.7 were considered poor, and 0.5–0.6 were considered failed (47). Thus, pooled AUC values for all subgroups in our study fall within good AUC values. Although AUC values provide a good overall sense of classification performance, there are a few disadvantages. Its clinical interpretability is limited since it does not account for misclassification costs associated with false-negative and false-positive findings (48). It does, however, presume that specificity and sensitivity are equally important to the decision-maker, which may not always be the case for clinicians (49).
The capacity to differentiate MB subgroups using preoperative MRI may affect individualized treatment decisions. Treatments for MB are currently individualized and include surgery, radiation, and chemotherapy (50). When molecular subgroup affiliation is considered, the prognostic benefit of increased extent of resection for patients with MB is decreased, although the first-line treatment for MB is maximal safe resection (4,51). The extent of resection was not associated with overall survival in patients with group 4 MBs, but progression-free survival was improved with gross total resection compared to partial resection, especially in the context of disease spread (OS) in a retrospective study (4). There was no evidence of this effect in WNT, SHH, or group 3 MBs, and there was no overall survival gain from gross total versus subtotal resection in any MB subgroups.
On the other hand, neurological deficits, particularly posterior fossa syndrome (cerebellar mutism), which affects around 25% of patients and is characterized by emotional lability and trouble producing words, can complicate resection (52). In younger children, radiotherapy and cytotoxic chemotherapy are linked to secondary cancers, cerebrovascular disease, cataracts, hearing loss, low stature, pituitary hormone insufficiency, and neurocognitive impairment (53,54). These factors serve to enhance the urgency of developing more effective treatments to raise stagnant survival rates and lessen the long-term side effects of existing treatments (55). Establishing the effectiveness of treatment de-escalation for WNT MB and incorporating alternative radiation technologies, like proton beam therapy in place of photon-based radiation, are current research areas of particular interest (56).
The present study has some limitations. First, a relatively low number of papers met the inclusion criteria, resulting in a relatively low number of patients. We used only PubMed as a literature search source; however, it should be noted that the benefits of searching sites other than PubMed, specifically searching EMBASE, are not significant (57). Studies using the proper methodology but not reporting for all four subgroups were not included. Study heterogeneity was high, but it is commonly observed in meta-analyses on radiomics-based ML studies (23,46,58,59). AUC values were used as the common classification performance metric, which comes with disadvantages, as mentioned earlier. The QUADAS-2 analysis presented one high-risk source of bias along with two unclear items. Although CLAIM is a relatively recent checklist, it was observed that compliance was not high.
In conclusion, this study revealed that radiomics-based ML studies demonstrate good classification performance in predicting subgroups in MBs, with AUC values >0.80 in all subgroups. These results are promising for improving the management of MB through preoperative molecular subgrouping. They require methodological quality improvement and stability to be adapted to clinical practice. To prove their validity, well-designed prospective trials are required, and the reporting of methods and results must be standardized.
Footnotes
Declaration of conflicting interests
The author(s) declared no potential conflicts of interest with respect to the research, authorship, and/or publication of this article.
Funding
The author(s) received no financial support for the research, authorship, and/or publication of this article.