



Abstract
Background
The appearance of renal swelling during an acute obstruction of the urinary tract could be caused by hydronephrosis or an increase of the parenchymal volume. To the best of our knowledge no studies have been performed regarding renal parenchymal volume change during an acute urinary tract obstruction.
Purpose
To investigate the change in renal parenchymal volume during an acute urinary tract obstruction and to correlate any such volume change to the degree of secondary signs of obstruction.
Material and Methods
In total, 20 patients with obstructive ureterolithiasis were retrospectively and randomly included. Two observers measured the parenchymal volume of the obstructed and the contralateral kidney in CT examinations before, during, and after obstruction. Hydronephrosis, hydroureter, perirenal stranding, and thickening of the renal fascia were graded and correlated to volume change.
Results
A decreased volume was noted after obstruction in the obstructed kidneys (−24%) (P < 0.0001) and in the contralateral kidneys (−5%) (P = 0.0110) with a positive correlation of change in volume (P = 0.011). The volume of the obstructed kidneys was larger than the contralateral kidneys during obstruction (P < 0.0001) but not after obstruction (P = 0.559). No significant difference in volume was found before compared to after obstruction. Secondary signs of obstruction did not correlate to volume change.
Conclusion
The parenchymal volume increases in the obstructed kidneys as well as in the contralateral kidneys during obstruction. The increase in volume was larger in the obstructed kidneys compared to the contralateral kidneys. After obstruction the kidneys regained their original volume. Secondary signs did not correlate to volume change.
Introduction
In Sweden, the lifetime risk of urolithiasis is 15% for men and 5% for women, with a recurrency rate of 50% in 10 years. The typical patient with an acute obstructive ureteral stone presents with flank pain (1). Computed tomography (CT) is the imaging technique of choice in the evaluation of patients presenting with acute flank pain and suspected ureterolithiasis due to its high sensitivity and specificity for calcifications (2–6). Hydronephrosis (dilatation of the renal pelvis and calyces), hydroureter (dilatation of the ureter proximal to the obstruction), perirenal stranding (edema in the perirenal fatty tissue), thickening of the renal fascia, and unilateral renal swelling are radiological features and secondary signs corresponding to the acute obstruction and increased pressure proximal to the ureteral obstruction (7). Secondary signs of obstruction have been shown to be predictive of ureteral obstruction and support the diagnosis if a ureteral stone is present or suspected (8,9). To the best of our knowledge, no previous quantitative evaluation of change in renal parenchymal volume during an acute urinary tract obstruction has been performed. Investigating the change in renal parenchymal volume during an acute urinary tract obstruction could give objective support to the subjective observation of renal swelling as a secondary sign of obstruction.
The primary aim of this study was to investigate if there is a change in renal parenchymal volume during an acute urinary tract obstruction by measuring the renal parenchymal volume before, during, and after an acute obstruction of the urinary tract. A further aim was to correlate the degree of other secondary signs of obstruction to renal parenchymal volume change during obstruction.
Material and Methods
Ethical approval
Approval of the study was granted by the regional ethical board (Dnr 2016/473). Written informed consent was obtained from the patients included in the study as demanded by the ethical board.
Study population
A total of 20 patients (12 men, 8 women; median age = 54 years; age range = 23–81 years) were retrospectively and randomly included during two separate time periods: in 2016 and 2019 from clinical conferences. To be included in the study, the patient had to have a unilateral ureteral stone causing acute obstruction, no other known kidney condition detected in the CT images or included in the referral information, a CT scan of the urinary tract performed during an acute obstruction (n = 20), and a scan performed before (n = 10) or after the obstruction (n = 19) to compare renal volumes (both before and after if available [n = 9]). Selection bias was avoided as the only information at inclusion was the presence of a ureteral stone causing obstruction; there was no knowledge of renal volume.
CT settings
The CT scanners used were Somatom Definition Edge and Somatom Definition Flash (both Siemens Medical Solutions, Forchheim, Germany) with a collimation of 128 × 0.6 mm.
The scans were performed with an automatic tube current modulation CARE Dose 4D, with Quality Reference 40 mAs and Care kV with a reference of 120 kV. The parameters were as follows: rotation time = 0.5 s; collimation = 128 × 0.6 mm; pitch = 0.6, kernel B37 with Admire 2. In the acute CT scans, 17/20 were unenhanced; in scans after obstruction, 18/19 were unenhanced. In the scans performed before obstruction the protocol varied. In cases where only enhanced examinations were available, the volume measurements were carried out in these.
Volume measurements
Renal parenchymal volume (in mL) was measured using Philips Vue PACS (Philips Medical Systems, Best, The Netherlands), formerly known as CARESTREAM Vue PACS, using the “Lesion” tool. The border of each kidney was outlined manually in 3-mm reconstructions in the axial plane (Fig. 1), from the upper to the lower pole of the kidney. In order to include only the parenchyma of the kidney, the collecting system and other structures in the renal sinus were excluded. The total volume was automatically generated from the segmentation. Two observers (a radiology resident with experience in uroradiology since 2016 (K.S) and a medical intern (O.L)) independently measured the volumes of both kidneys in each scan. No observer had previous knowledge in volumetric measurements. The measurements were retrospectively validated by a specialist in uroradiology (A.M) with many years of experience in volume measurements through 3D segmentation. Fig. 2 illustrates an example of 3D reconstructed volume measurements in a patient with CT scans performed before, during, and after obstruction.
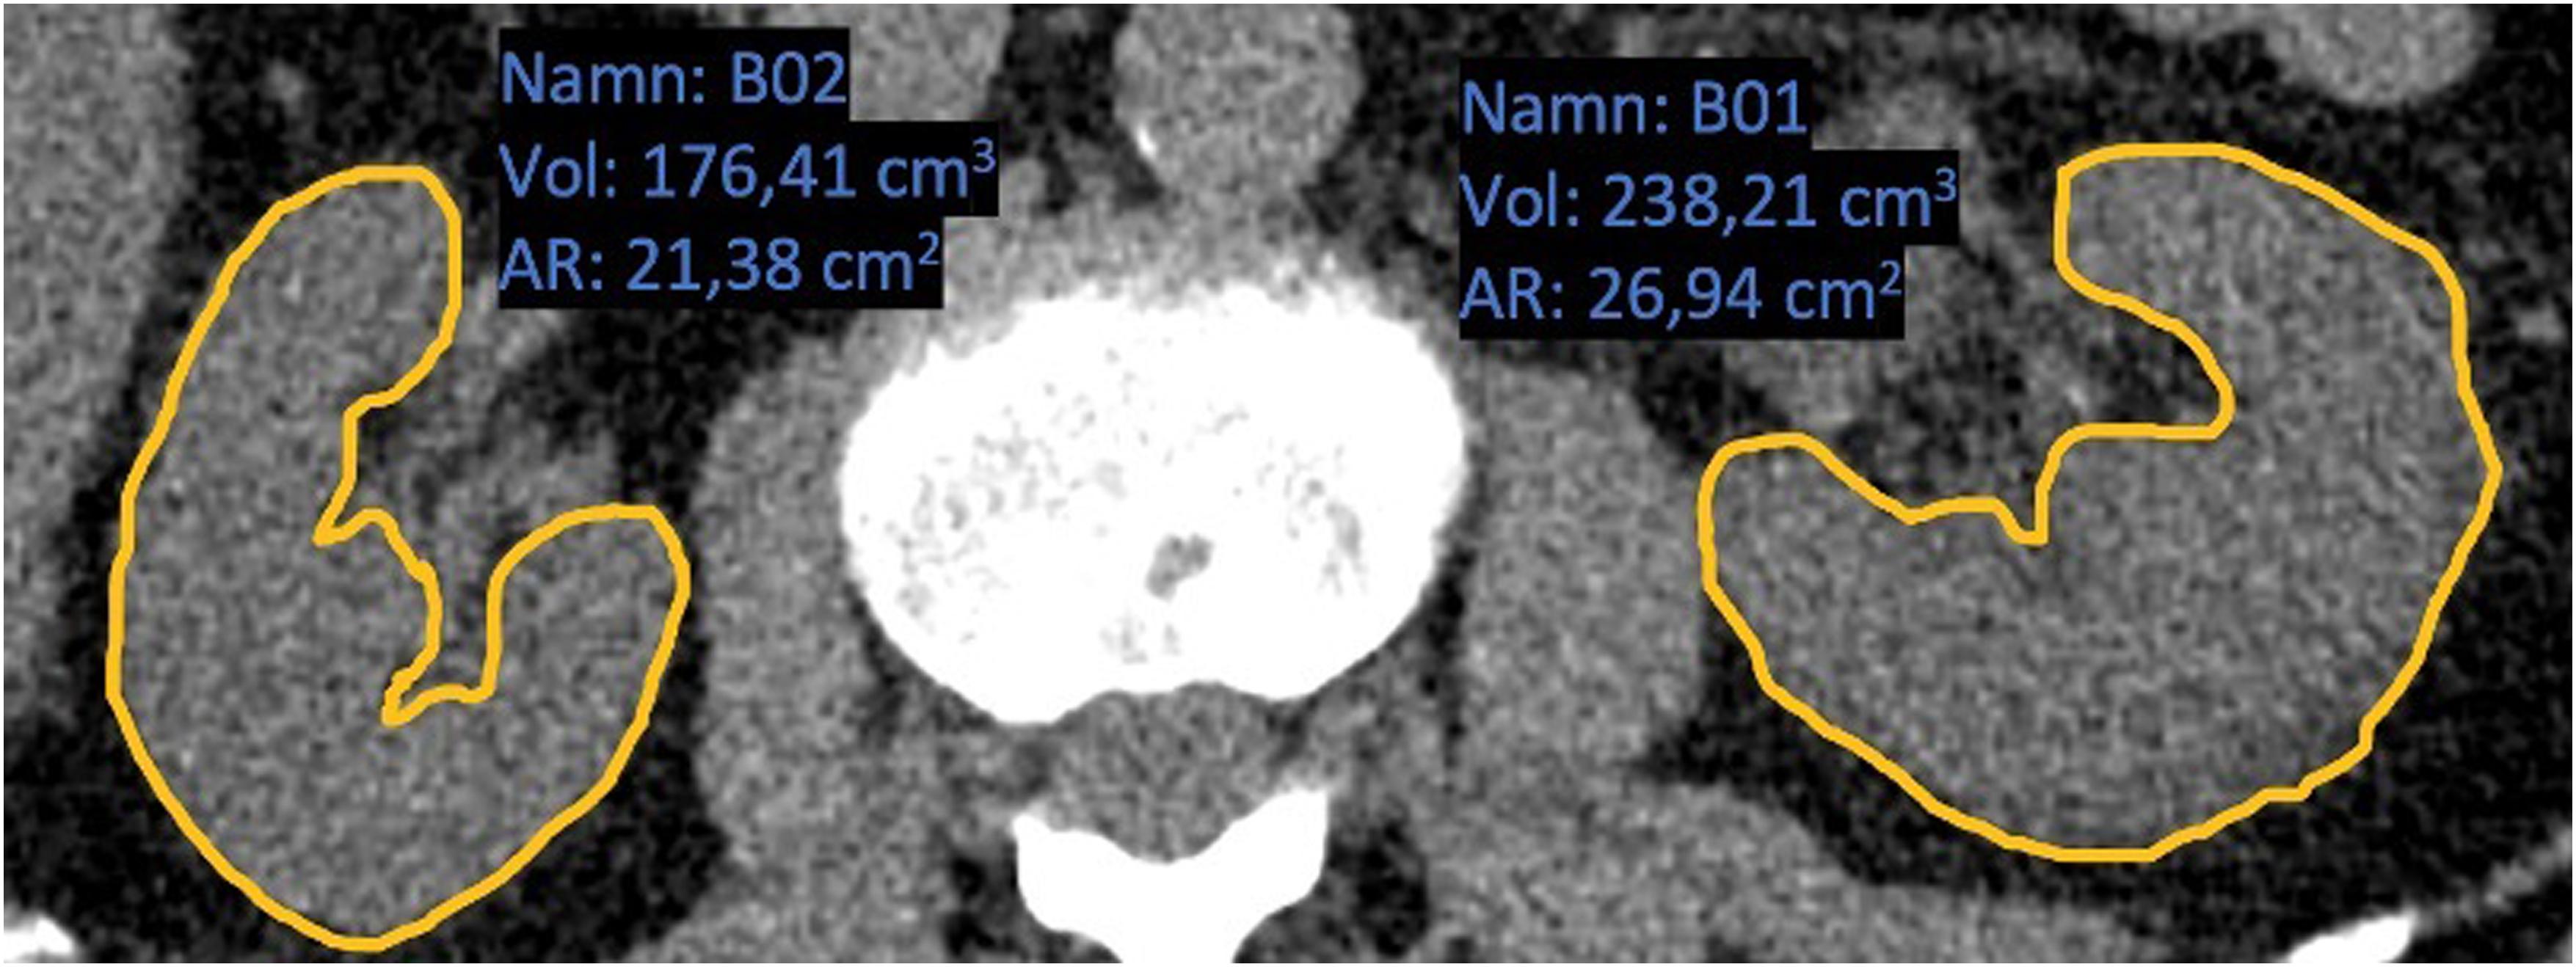
An example of renal volume measurement in a CT scan: the obstructed (left kidney) and its contralateral healthy kidney (right kidney).

3D reconstructions of one patient's kidneys before, during, and after obstruction. Before obstruction, the right kidney had a volume of 264 mL, which increased to 410 mL during obstruction, and decreased after obstruction to 273 mL. The non-obstructed left kidney had a volume of 216 mL before obstruction, 286 mL during obstruction, and 228 mL after obstruction. The proximal ureteral stone on the right side is indicated by an arrow.

Renal parenchymal volumes in all patients before, during, and after obstruction, the mean values of two observers. The mean values for all patients are shown as a bold line. An increase in volume during obstruction is seen in both groups, to a greater extent in the obstructed kidneys.
Grading secondary signs of urinary obstruction
A scale of 0–3 was used when grading hydronephrosis, hydroureter, perirenal stranding, and thickening of the renal fascia as follows: 0 = normal; 1 = mild; 2 = moderate; and 3 = severe. Hydronephrosis was graded based on the width of the calyces, with no measurement specification, as is done in clinical practice, since there is no consensus on grading hydronephrosis in CT. The secondary signs were correlated as sums and separately to volume change (minimum 0, maximum 12 points). Two observers (K.S and A.M) independently evaluated the degree of the secondary signs and then later in consensus, blinded to the volume results. The evaluation based on consensus was used in the statistical analysis.
Statistical analysis
Agreement between the two observers’ volume measurements was assessed using Bland–Altman plots. As the differences were related to magnitude the volumes were natural log-transformed, and the bias and limits of agreement were expressed as percentages. In order to take into account the correlation between measurements on the same patient, a mixed model was used to generate the limits of agreement (10). The mean value of the observers' volume measurements was calculated for each CT scan and was used in the analyses described below.
To assess differences in kidney volume, between time points, and between obstructed and non-obstructed kidneys, paired t-tests based on natural log-transformed volumes were calculated. The geometric mean ratios with 95% confidence intervals were reported. Spearman rank correlation was used to investigate the association, in renal volume change over time, between the obstructed and non-obstructed kidney. Furthermore, Spearman rank correlation was calculated between renal volume changes and secondary signs.
A P value <0.05 was considered statistically significant. All statistical analyses were performed with SAS version 9.4 software (SAS Institute Inc., Cary, NC, USA).
Nomenclature
The kidneys with an obstruction will henceforth be referred to as the “obstructed kidneys” even if the kidneys were not obstructed in the CT scans before or after the obstruction. The contralateral healthy kidneys are referred to as the “non-obstructed kidneys,” since this is the status of the kidneys in all performed CT scans.
Results
Renal parenchymal volumes
The renal parenchymal volumes pre, during, and post obstruction scans are presented in Fig. 3. An increase in volume is seen in all obstructed kidneys during obstruction and a decrease in volume is seen after obstruction. During obstruction, there is also an overall increase in volume in the non-obstructed kidneys, however not as evident, and a decrease in volume after obstruction.
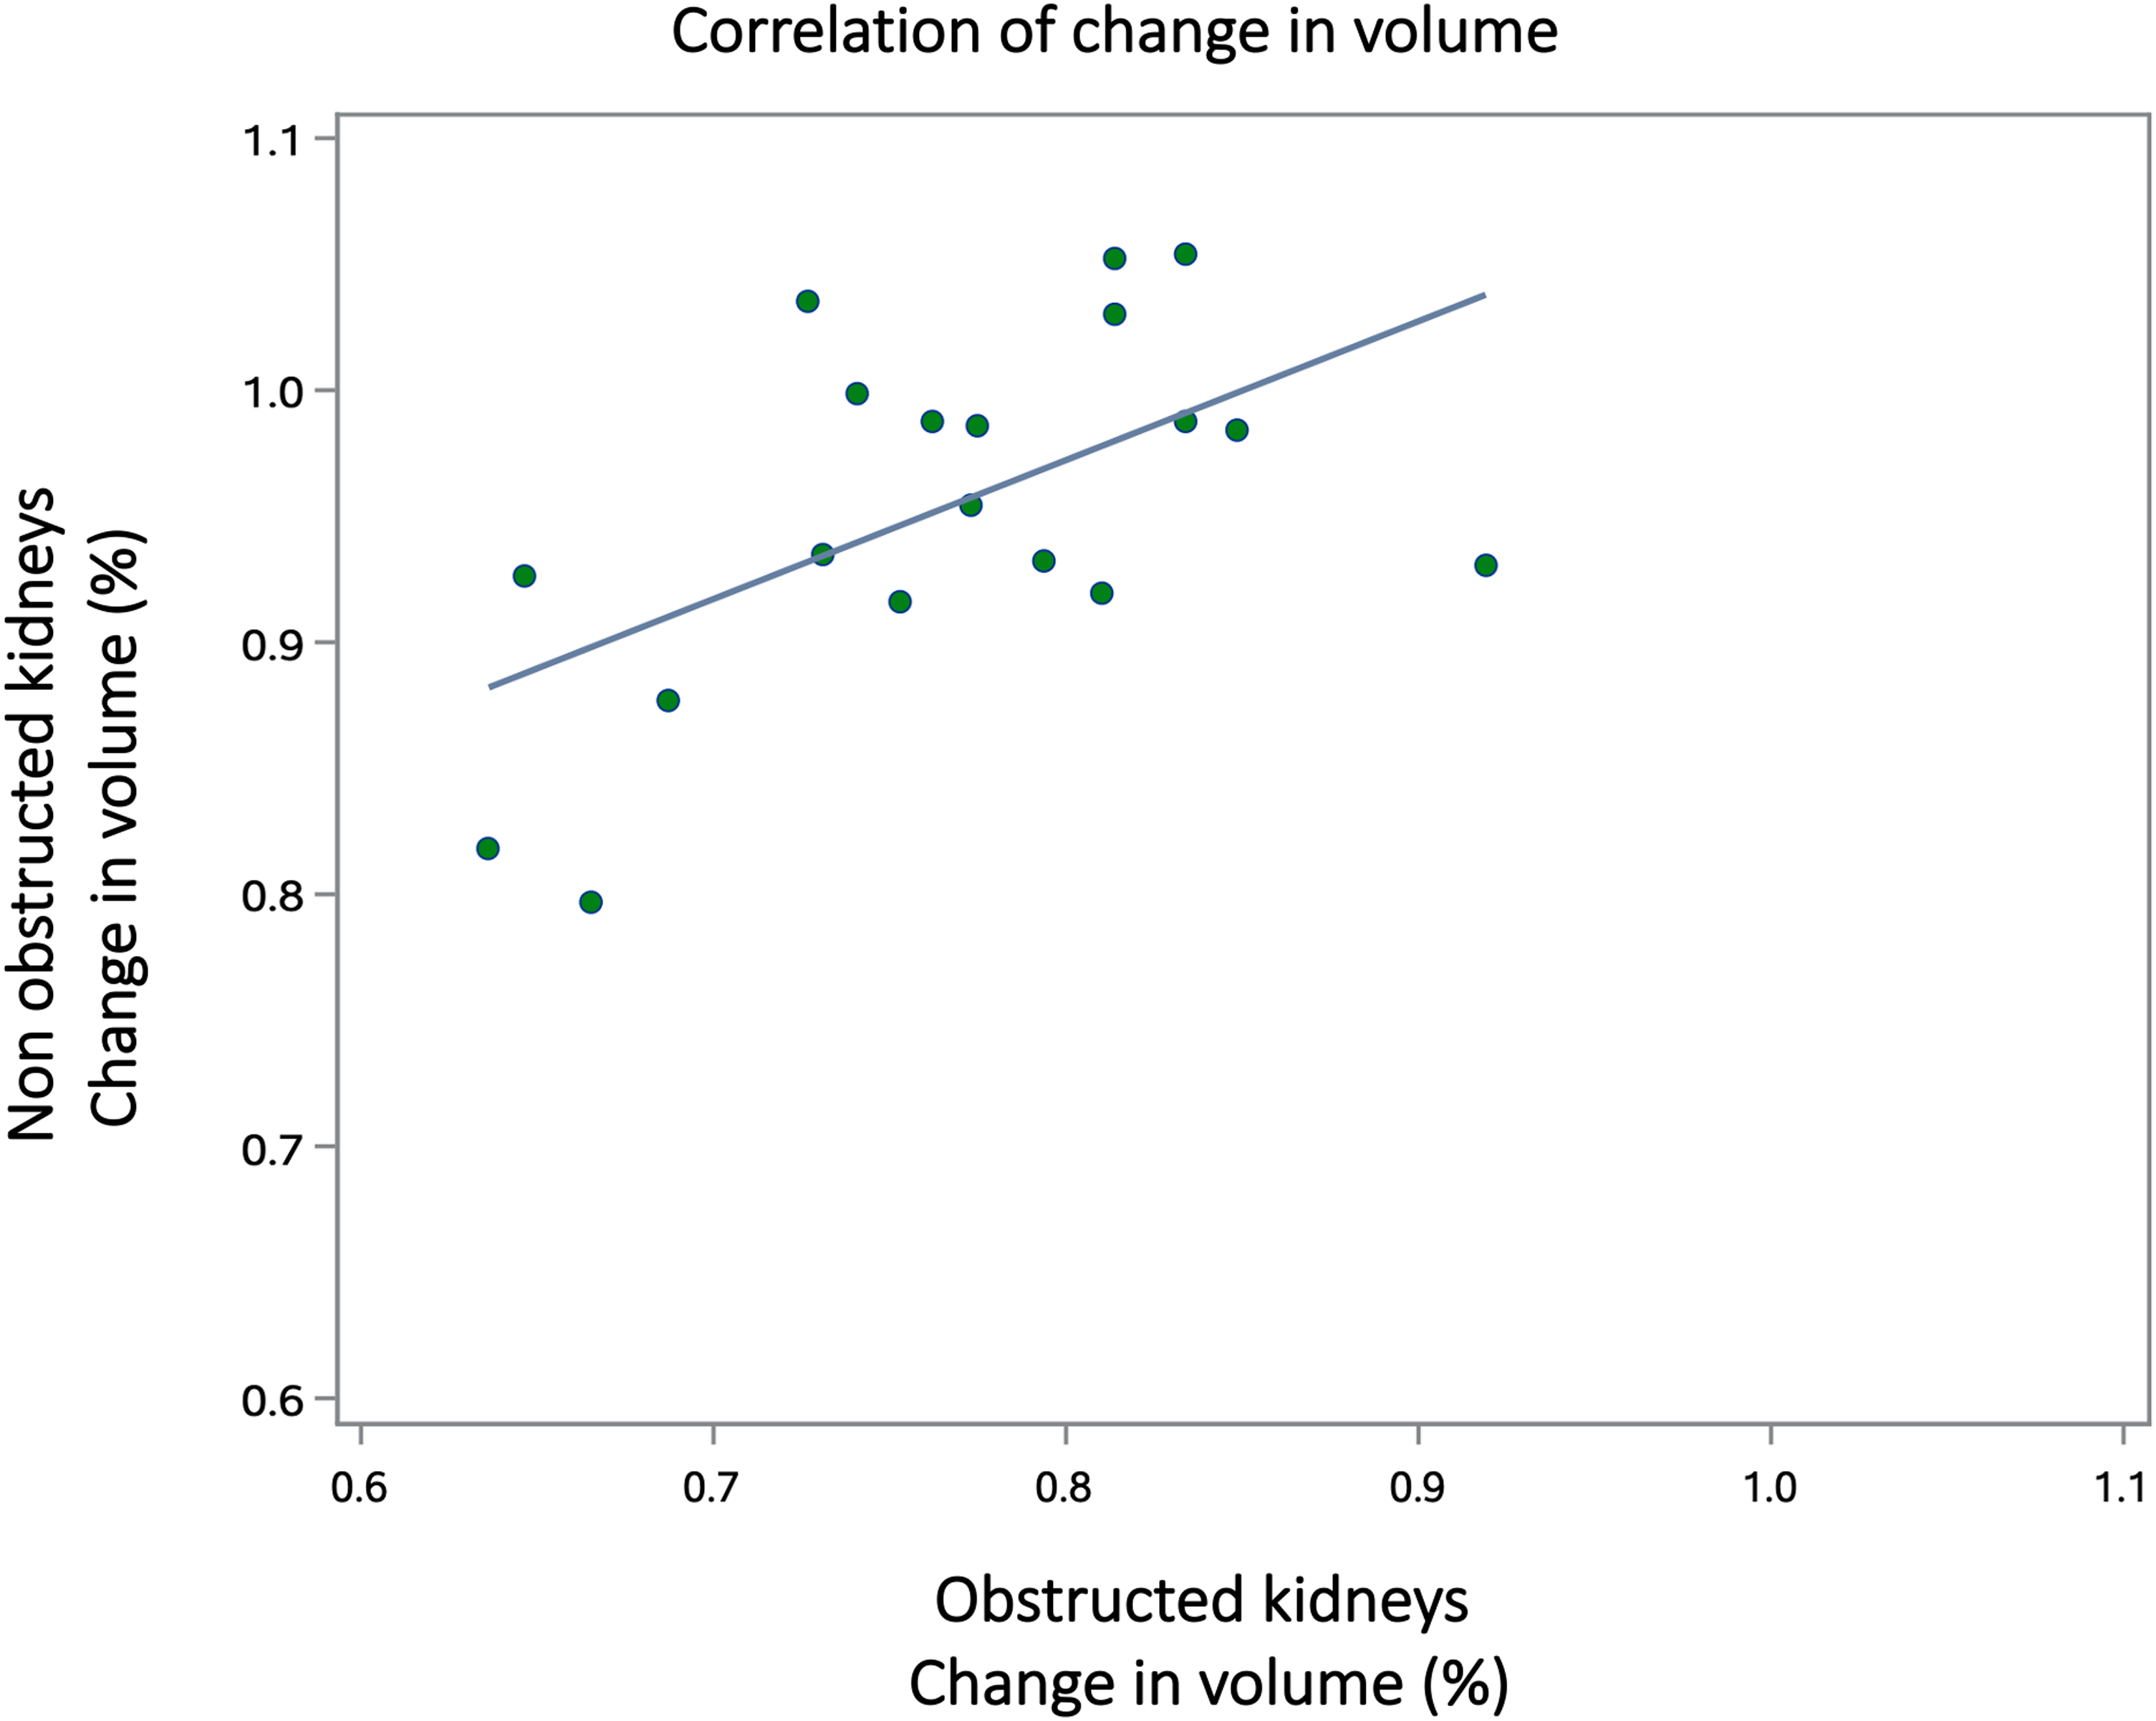
The percentage volume change of the obstructed and non-obstructed kidneys during and after obstruction. There is a positive correlation between the degree of swelling of the two kidneys.
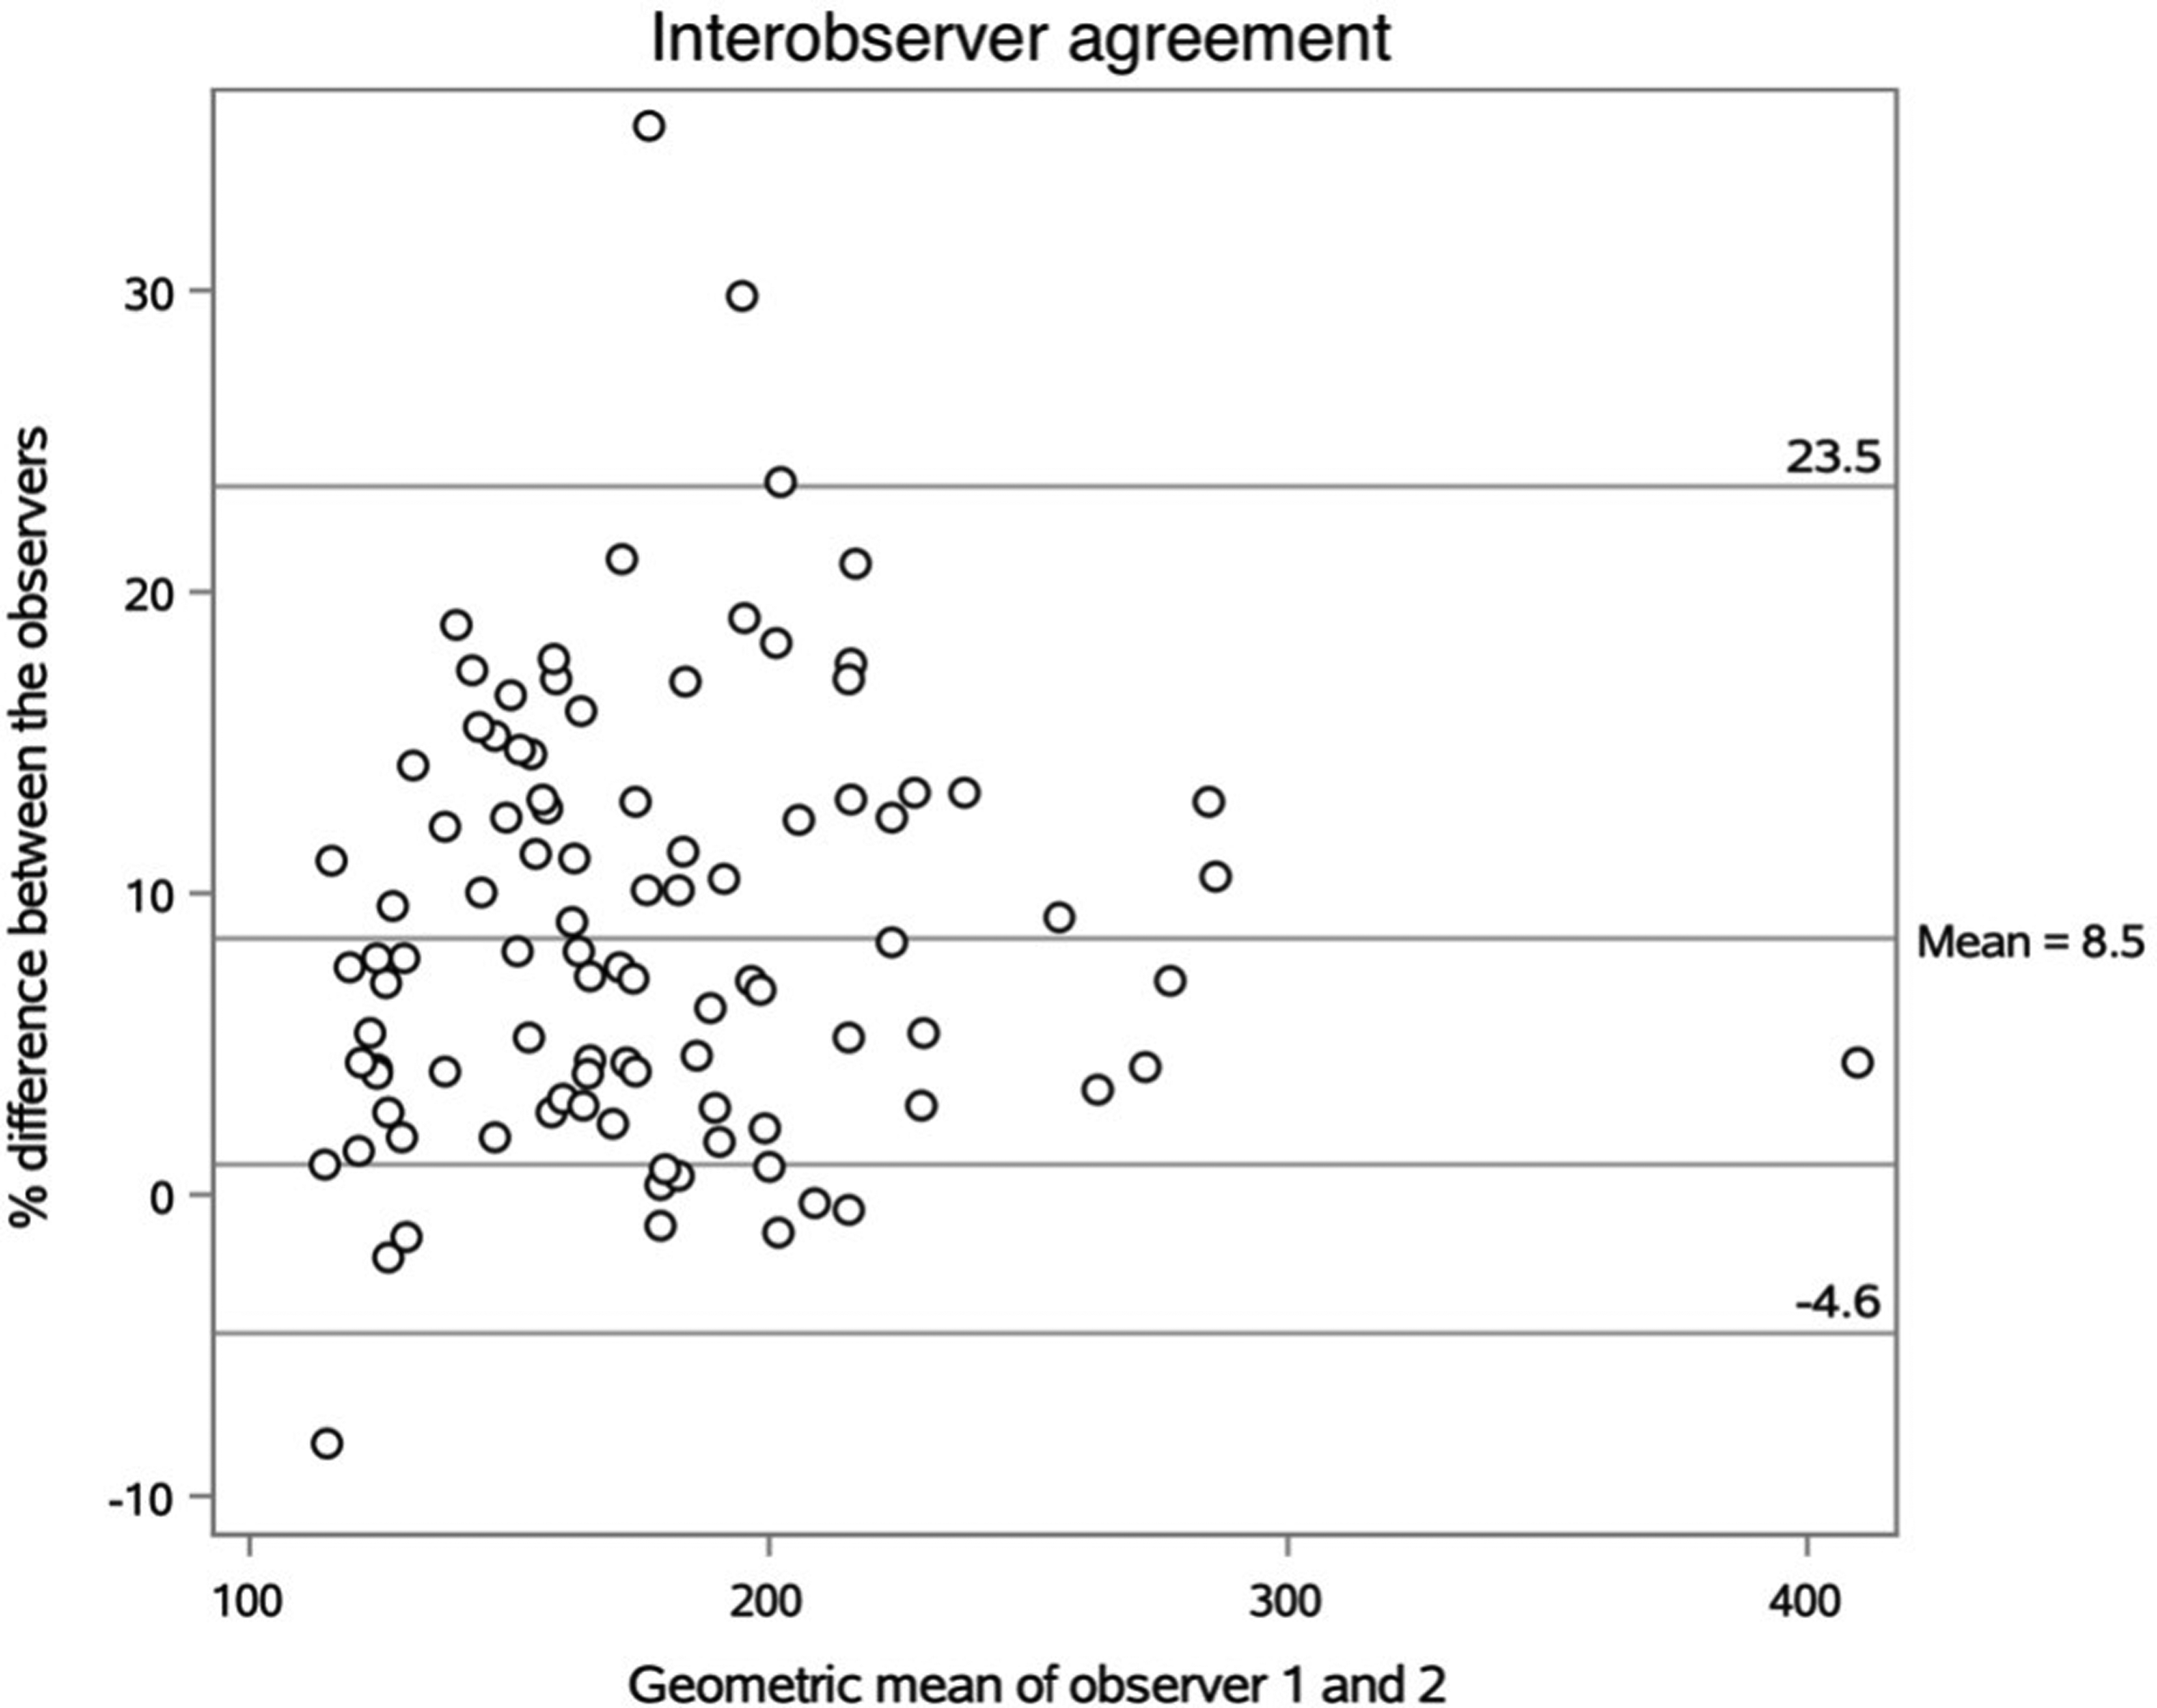
Inter-observer agreement. Bland–Altman plot with limits of agreement. The x-axis shows the geometric mean of the measured volume by the two observers. The y-axis shows the percentage difference in volume measured by the two observers.
Renal parenchymal volumes during and after obstruction
The descriptive statistics of the renal volumes during and after obstruction are presented in Table 1. The volume was larger during obstruction compared to after obstruction in both obstructed (P < 0.0001) and non-obstructed (P = 0.0010) kidneys. The mean volume change of the obstructed kidneys was –24% (ratio 0.76, 95% CI = 0.73–0.80) and the corresponding mean volume change of the non-obstructed kidneys was –5% (ratio 0.95, 95% CI = 0.92–0.99). The obstructed kidneys had a larger parenchymal volume compared to the non-obstructed kidneys during obstruction (P < 0.0001), but not after obstruction (P = 0.5593). The volume change of the obstructed kidneys was positively correlated to the volume change of the non-obstructed kidneys (correlation 0.57, P = 0.011) (Fig. 4).
Renal parenchymal volumes during and after obstruction.

Values are given as mean ± SD (range) unless otherwise indicated.
*Values are given as geometric mean (95% CI).
Renal parenchymal volumes before and after obstruction
The descriptive statistics of the renal volumes before and after obstruction are shown in Table 2. There was no change in volume of the obstructed kidneys (P = 0.6848) nor of the non-obstructed kidneys (P = 0.3392). Furthermore, there was no difference in volume between the obstructed and non-obstructed kidneys, neither before (P = 0.2849) nor after obstruction (P = 0.5593).
Renal parenchymal volumes before and after obstruction.

Values are given as mean ± SD (range) unless otherwise indicated.
*Values are given as geometric mean (95% CI).
Secondary signs of obstruction and renal parenchymal volume change
No secondary signs were found before or after obstruction. During obstruction, the median sum of points for secondary signs was 5.00 (range = 3.00–8.00). There was no correlation between the sum of the secondary signs and volume change (P = 0.434). Nor was there a correlation between any of the secondary signs separately compared to volume change (hydronephrosis, P = 0.591; hydroureter, P = 0.664; perirenal stranding, P = 0.160; or thickening of the renal fascia, P = 0.855).
Inter-observer agreement
The limits of agreement are presented in Fig. 5. There was a discrepancy between the observers’ results. For almost all measurements, one observer had a result with larger volume compared to the other observer. The limits of agreement were in the range of –4.6% to 23.5%, with a mean value of 8.5%.
Time between CT scans
The median time between scans performed before and during obstruction was 302 days (range = 34–2602 days) and the time between scans performed during and after obstruction was 86 days (range = 13–365 days) and between before and after obstruction 601 days (range = 83–2949 days). Of the 19 scans performed after obstruction, 17 were scheduled for a follow-up of the ureterolithiasis and two had other indications for referral (one follow-up due to cancer that was not kidney-related, one acute scan for another reason, showing no ureteral stones). The 10 scans performed before obstruction had various indications, but showed no ureteral stone or urinary tract obstruction.
Discussion
In this study, we found that the renal parenchymal volume increases in both the obstructed and its contralateral non-obstructed kidney during an acute urinary tract obstruction caused by ureterolithiasis. The greater the change in the volume of the obstructed kidney, the greater was also the change in the volume of the non-obstructed kidney. Furthermore, we found no difference in renal parenchymal volume before and after obstruction.
To the best of our knowledge, no comparable study on kidney volume measurements in this context has been performed. CT-rendered renal volume measurements have previously been used in other studies; for example, when evaluating split renal function (11,12). However, no study assessing renal parenchymal volume related to obstruction of the urinary tract was found.
There was a 24% reduction in the renal volume of the obstructed kidneys in scans performed after obstruction compared to during obstruction. Since the patients were examined during an acute renal colic episode, it could be argued that the larger volume during obstruction is due to the acute edema caused by the increased urinary pressure. An alternative explanation to the decrease in volume could be a loss of parenchyma due to atrophy second to the obstruction. In this study, the exact duration and degree of obstruction is unknown since we do not know when the stone passed before the control scan. Therefore, the difference in volume between the obstructed kidneys and the contralateral normal kidneys is of importance. The obstructed kidneys were larger than the contralateral normal kidneys during obstruction but had similar volumes after obstruction. These findings support the idea of a temporary increase in volume due to the obstruction rather than decrease in volume due to atrophy after the obstruction. One patient stood out in the study material with a renal volume during obstruction of >400 mL. However, when excluding this patient from the analysis, there was still a significant change in volume after obstruction of –23% (P < 0.0001).
A smaller but still significant decrease of 5% in renal volume was found in the contralateral normal kidneys after obstruction compared to during obstruction. A possible explanation is that when the obstructed kidney has an acute reduced filtration, the contralateral normal kidney increases its blood volume to increase filtration and reduce the effect of the obstruction.
The greater the volume change in the obstructed kidney, the greater was also the change in volume of the contralateral normal kidney, possibly corresponding to the severeness of the obstruction.
Preferably the volume of the kidney before obstruction should be compared to the volume during obstruction to examine the change in volume caused by the obstruction. However, CT scans performed before the obstruction were scarce (n = 10). To examine whether the decreased volume after obstruction corresponded to an increase due to obstruction, the available scans performed before obstruction were compared to scans after obstruction (n = 9). No change in volume was found in either the obstructed or the contralateral normal kidneys, and no difference was seen between the groups before or after obstruction. This indicates that the kidneys regain their original volume after the stone has passed. Therefore, the decrease in volume after obstruction may represent a normalization of the increase seen in volume during obstruction.
The degree of secondary signs of urinary tract obstruction could be expected to correlate with the parenchymal volume change. However, no correlation was found between the increased volume of the obstructed kidneys and the secondary signs of obstruction as a sum, nor for the signs separately. Even though the CT scans were performed in an acute setting, we do not know the time from onset of obstruction to the CT scan, nor do we know the degree of obstruction, which both might affect the presence and degree of secondary signs of obstruction.
Outlining the renal borders and excluding the collecting system can be challenging, especially when the scan is unenhanced and when the collecting system is not dilatated. By having two observers, we aimed to reduce the influence of these factors on the results. The measurements of one of the observers was approximately 9% larger compared to the other observer’s results, indicating a different but consistent approach when measuring. However, this should not affect the final results regarding volume change and the difference is also diminished by using the mean values of the two observers’ results. Another aspect is that the observers were not blinded to the presence of obstruction, and that knowledge might result in a tendency to make a larger or smaller measurement. In this study design, blinding was not possible as secondary signs and stone presence is difficult to not notice without extensive manipulation of the images and performing the measurements of each kidney in separate sessions. However, each volume requires multiple points of measurement in several 3-mm sections and the final results are therefore hard, if not impossible, to predict.
The median time between the acute scan performed during obstruction and the scan performed after obstruction was 86 days (range = 13– 365 days). Most scans performed after obstruction were follow-ups of the acute ureterolithiasis, explaining the relatively short interval compared to the time between scans performed before obstruction and during obstruction, which was 302 days (range = 34–2602 days). Time was not correlated to volume change; however, since there was no significant difference in volumes before and after obstruction (n = 9), the time between scans is suggested not to have had an impact. Since one inclusion criterion was that the patient should have no other (known) kidney condition, time-related confounding factors affecting renal parenchymal volume, such as tumors, were avoided.
In clinical practice, the volume measurements are time-consuming and would often be performed without access to comparable previous volume measurements. The information of a kidney's volume is therefore of little interest in practice, since there might also be a variation in kidney sizes in every individual patient. However, in this study we found no difference in volume between the obstructed kidney and the contralateral normal kidney before and after obstruction, indicating that a comparison between them might be possible in the acute setting. Our finding that there is also an increase of the contralateral normal kidney's volume during obstruction may suggest that such a comparison cannot be made. Therefore, knowledge of the kidney volume in a non-obstructive setting is really needed for a comparison. The increase in volume observed during obstruction indicates that there is a parenchymal edema during an acute obstruction, knowledge that could be useful if there is also a correlation to degree of obstruction, though this correlation has yet to be studied. In the near future, artificial intelligence (AI) or a faster tool or method for parenchymal volume measurements could help to facilitate a larger study on renal volume changes in relation to degree of obstruction.
This single-center retrospective study has some limitations. One is the small study population. This is explained by 3D segmentation being a time-consuming method (40–60 min per examination). Due to the small number of patients, analyses of factors affecting renal swelling (e.g. age, renal function, stone size, and location) could not be evaluated. However, this was not the intention of this study. It is hoped that a future study can address these questions.
In conclusion, the renal parenchymal volume increased during an acute urinary tract obstruction in both the obstructed kidney and to a smaller extent in the contralateral normal kidney. Renal parenchymal volumes were similar before compared to after obstruction. There was a positive correlation between volume change of the obstructed kidney and volume change in the contralateral normal kidney. No correlation was found between secondary signs of obstruction and the change in renal parenchymal volume. Further studies to establish the correlation between parenchymal volume change and degree of obstruction as well as correlation to time of onset of obstruction would be of interest.
Footnotes
Acknowledgments
The authors are grateful to Henrik Andersson for his assistance with language editing of the manuscript.
Declaration of conflicting interests
The author(s) declared no potential conflicts of interest with respect to the research, authorship, and/or publication of this article.
Funding
The author(s) received no financial support for the research, authorship, and/or publication of this article.
