



Abstract
Background
Osteoporosis can cause bone fractures and disability, but early diagnosis faces challenges. Our proposed diagnostic indicators offer a new approach for early detection, which benefits early identification.
Purpose
To determine the most appropriate threshold for predicting osteoporosis in patients with each section of vertebral body.
Material and Methods
A retrospective analysis of 210 patients, including 646 vertebrae, who had both abdominal computed tomography (CT) and dual-energy X-ray absorptiometry (DXA) within six months. The correlation between DXA T-score and CT Hounsfield units (HU) values was tested by Pearson. The area under the curve (AUC) was calculated using the threshold obtained from the regression equation.
Results
The thresholds matching the T-score of −2.5 were 85, 95, 85, and 90 HU for the upper axial plane of the vertebral body (Lau), the middle axial plane of the vertebral body (Lam), the lower axial plane of the vertebral body (Lad), and the mid-sagittal plane of the vertebral body (Lsm), respectively. Defining osteoporosis using CT as Lau ≤ 85, Lam ≤ 95, Lad ≤ 85, or Lsm ≤ 90 HU had a specificity of 88.1% (116/134) and sensitivity of 90.8% (69/76) for distinguishing DXA osteoporosis of the lumbar spine in 210 patients. T-score ≤−2.5 defined as Lau ≤85 or Lam ≤95 or Lad ≤85 or Lsm ≤90 HU had a specificity of 85.9% (275/320) and sensitivity of 82.8% (270/326) for DXA T-score ≤−2.5 in 646 lumbar vertebrae.
Conclusion
CT HU values obtained based on different sections of the vertebral body in abdominal CT can be used as a supplementary measure to assess osteoporosis.
Keywords
Introduction
With the arrival of an ageing society, the proportion of patients with osteoporosis is gradually increasing worldwide, along with the number of patients experiencing fractures caused by osteoporosis. According to statistics, osteoporosis will remain a significant socioeconomic disorder for a prolonged period in the future. According to the Compendium of Osteoporosis published by the International Osteoporosis Foundation (IOF) in 2015, the global population at high risk of osteoporotic fractures was approximately 158 million in 2010 and will double by 2050 (1). In the UK, after the age of 50 years, osteoporotic fractures impact one in five men and one in three women, with a consequent loss of 5.8 million healthy life-years annually (2). In China, the number and cost of osteoporosis-related fractures is expected to double by 2035 compared to 2010 and grow to 6 million per year by 2050, at a cost of $25.4 billion (3).
Studies have shown that some drugs, such as zoledronic acid, are effective in treating osteoporosis (4), which can prevent the occurrence of osteoporotic fractures and reduce the medical, social, and economic impacts of osteoporosis (5,6). However, early diagnosis of osteoporosis remains a tremendous difficulty. Dual-energy X-ray absorptiometry (DXA) is the “gold standard” for diagnosing osteoporosis (5,6). However, DXA has low acceptance and popularity in the population, due to its additional costs and narrow applicability. In a study from the United States, less than 6% of 24,000 women aged ≥65 years who underwent chest and abdominal computed tomography (CT) scans received DXA scans (7). This technique can produce false-negative results if the patient has a vertebral compression fracture, as observed in the use of the FRAX tool for evaluating fracture risk; the lumbar T-score may not be reported in DXA results in a notable proportion of cases (8% in the present study) (8). In 2011, researchers at the University of Wisconsin first used “opportunistic CT" (9), after which CT gradually became used in the diagnosis of osteoporosis because DXA may underestimate the decrease in bone density caused by spinal scoliosis, bone spurs, and osteosclerosis (10). The advantage of CT Hounsfield unit (HU) measurement is that it can avoid areas with significant degeneration and select trabecular bones that are more affected by osteoporosis (11). Quantitative computed tomography (QCT), which was introduced in the mid-1970s, can be used to diagnose osteoporosis, but it is not as widely utilized as DXA at this particular time (12).
Abdominal CT is comparatively more widely accepted by the population than DXA due to its broad range of indications in 2021. In addition, the bone mineral density (BMD) measured by abdominal CT can be easily performed, reducing the patient's time, cost, and radiation exposure (9,13–16). Some studies have shown that CT HU values obtained by lumbar CT are significantly correlated with BMD (17). But these studies only focus on a single section of a single vertebral body and lack comprehensive consideration of the entire vertebral body. This study focused on four different sections of the lumbar spine—i.e. the mid-sagittal plane of the vertebral body (Lsm), the upper axial plane of the vertebral body (Lau), the middle axial plane of the vertebral body (Lam), and the lower axial plane of a vertebral body (Lad)—to determine the most appropriate threshold for predicting osteoporosis in patients with each section the vertebral body of the patient.
Material and Methods
Participants
Patients who underwent DXA and abdominal CT examinations between 16 November 2020 and 20 October 2021 were analyzed. Abdominal CT is used for a variety of routine clinical indications and is important for imaging data in most hospital departments. In addition, the interval between CT and DXA could not be >6 months. The study protocol was vetted and approved by the medical ethics committee of The First Hospital of Nanchang (reference number: KY2022024).
Dual-energy X-ray absorptiometry
DXA (Hologic, The Kingdom of the Netherlands) scans of the spine (lumbar 1–4 [L1–L4]) were performed using a standard technique. The parameters for the standard technique included: tube ratings = 160 kV maximum, 320 W maximum average; focal spot = 0.4 ×1.2 mm; pre-collimator beam =2° × 24°. Osteoporosis of the lumbar spine was diagnosed by the lowest T-score of vertebrae among L1–L4 (10). To confirm and clinically diagnose osteoporosis, a T-score ≤−2.5 in any of the vertebrae is required (10).
Computed tomography
The imaging department personnel routinely calibrates the CT scanner, and the calibration results are documented and presented to the director of the imaging department for evaluation before usage. All CT examinations were performed using an Ingenuity CT scanner (Philips, USA. The parameters for standard abdominal CT scans were as follows: tube voltage = 120 kV; tube current = automatic adjustment; and slice thickness = 1.0 mm. The vertebral body was divided into upper, middle, and lower parts on the sagittal plane from head to tail. A two-dimensional reconstruction was performed at 1 mm in the mid-sagittal plane of the vertebral body, without measuring the compressed bone. The mid-sagittal plane of the vertebral body divided the lumbar vertebrae into four equal sections from head to tail. We focused on the interfaces where the four equal sections were divided, with each of the three interfaces representing the upper, middle, and lower parts of the lumbar vertebra. ImageJ is a public image processing software based on Java, developed by the National Institutes of Health (NIH) in the USA, which performed image processing and calculated CT HU values. The region of interest (ROI) was measured on images at the three aforementioned interfaces and the mid-sagittal plane: the mid-sagittal plane of the vertebral body (Lsm), the upper axial plane of the vertebral body (Lau), the middle axial plane of the vertebral body (Lam), and the lower axial plane of the vertebral body (Lad). The measurement method of CT HU values takes into account all four interfaces, and plots elliptical regions of the same size on each interface to obtain the ROI. ImageJ measured all the points within the ROI and provided a mean value that represents the intensity of the interface. When placing the ROI, we avoided the posterior venous plexus area and shadow of the vertebral body (Fig. 1).
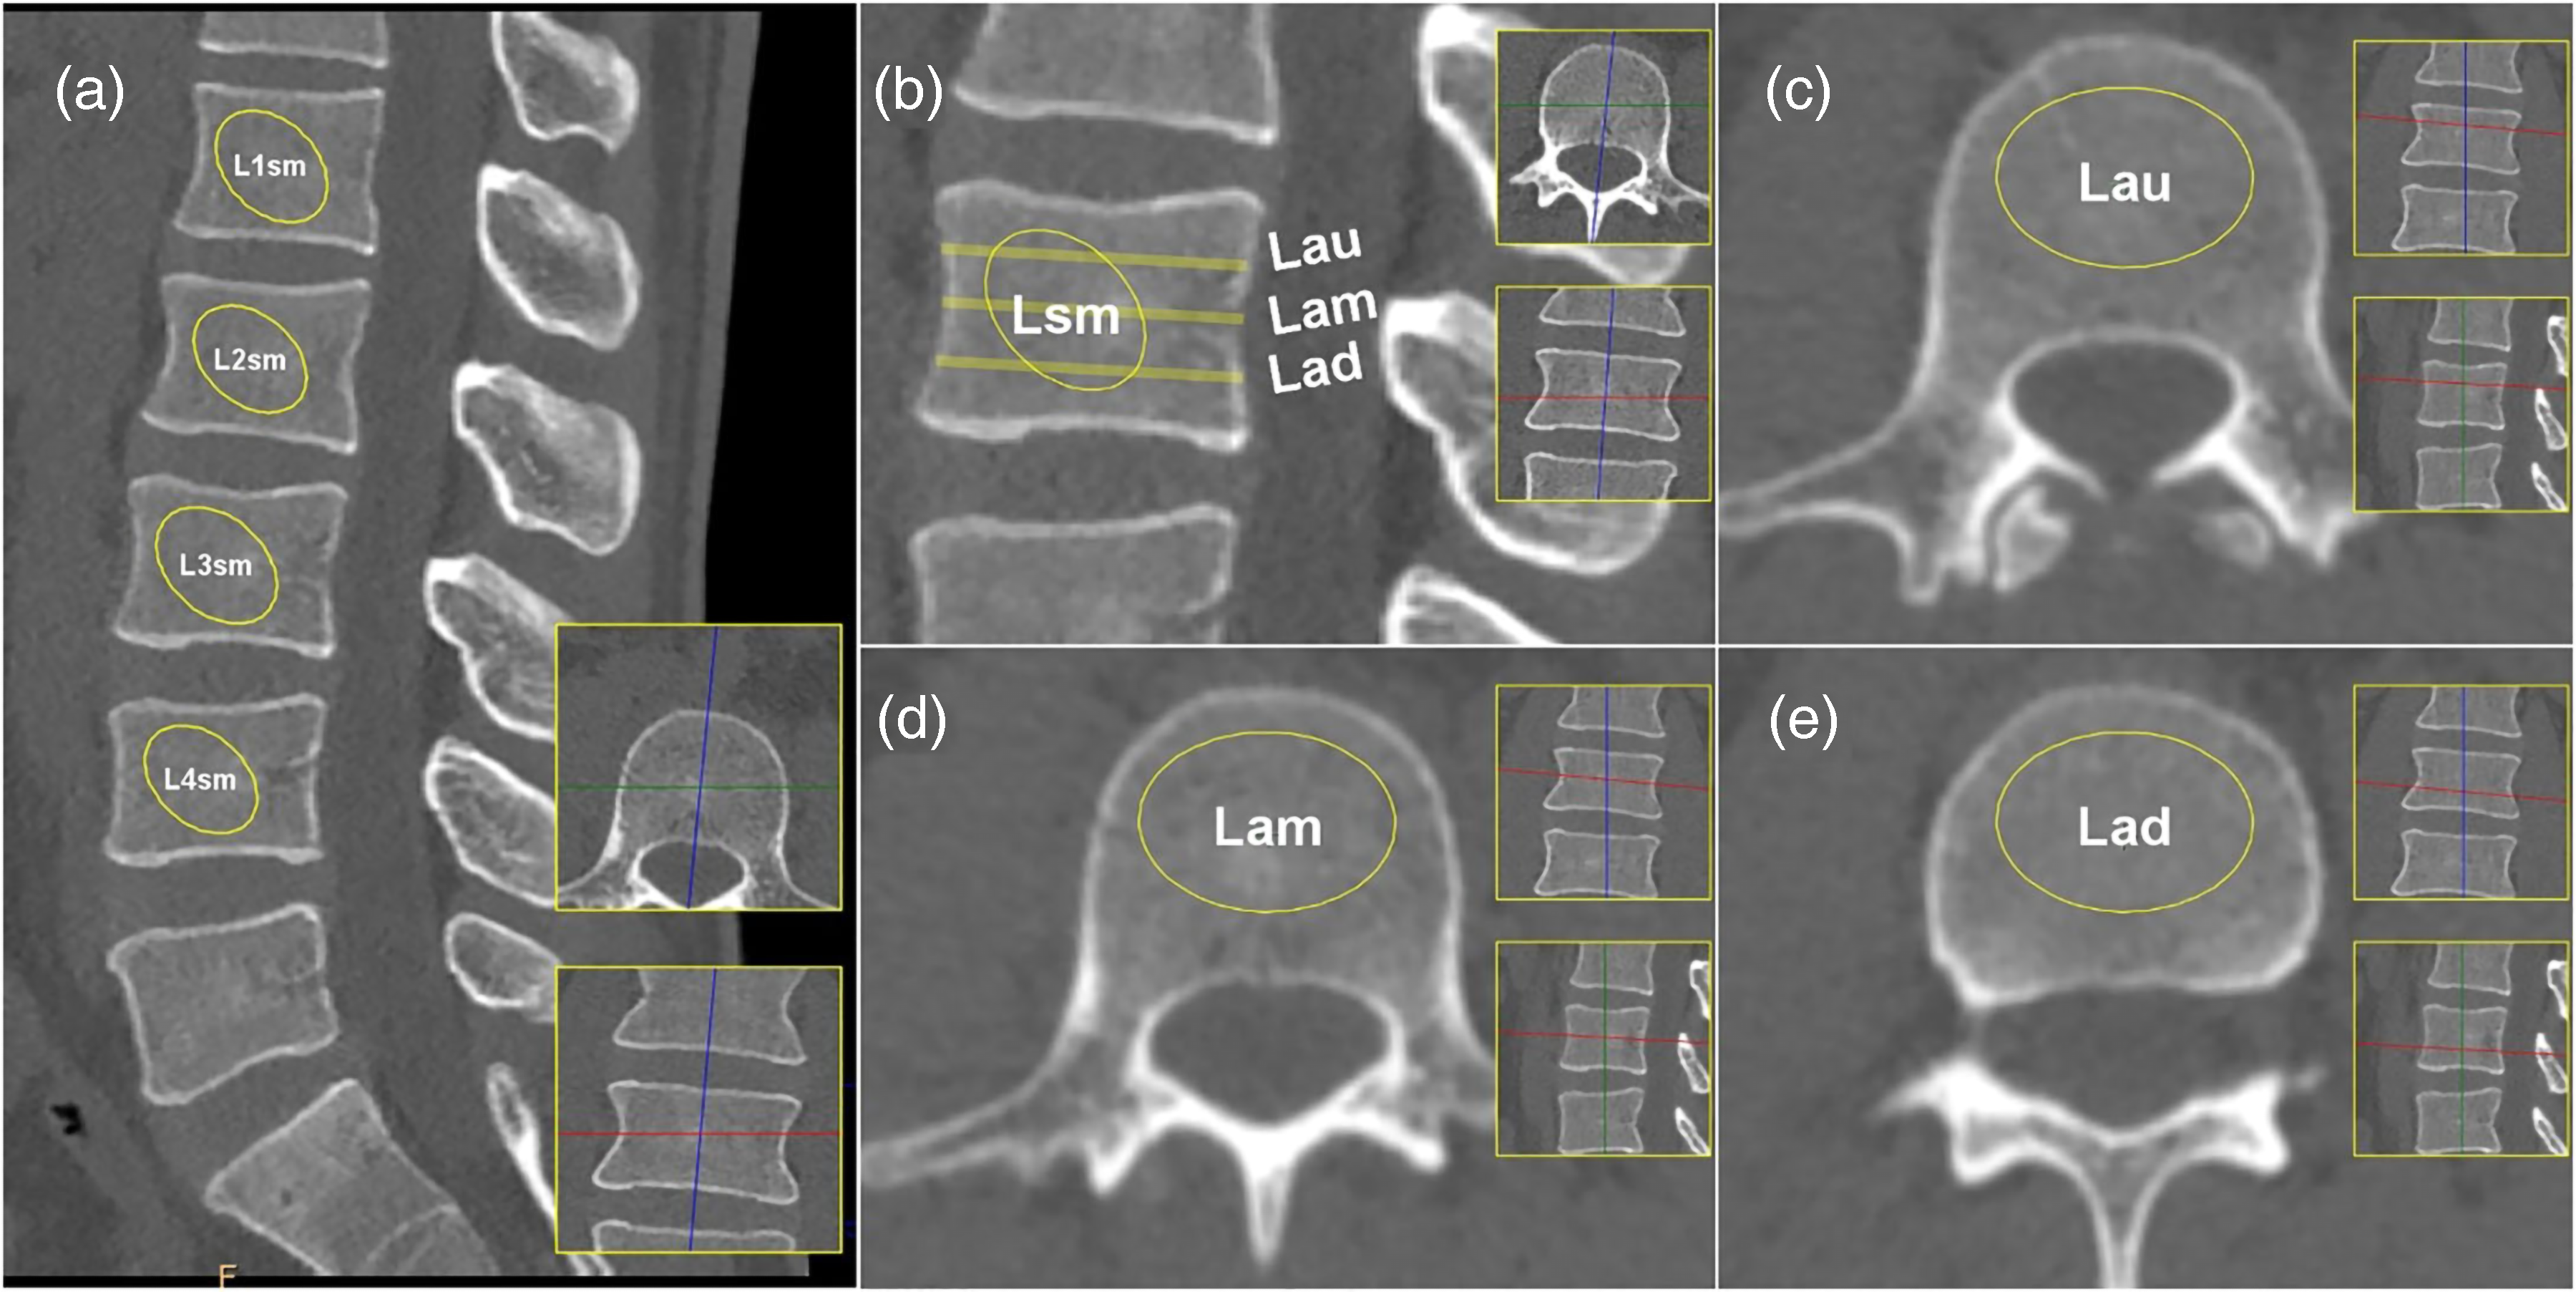
CT method of selecting a ROI. (a) Mid-sagittal plane (Lsm) ROI is selected. (b) The vertebral body is divided into four equal sections as well as a selection of cross-sections; (c) ROI is selected from the upper axial plane of the vertebral body (Lau); (d) ROI was taken from the middle axial plane of the vertebral body (Lam).; (e) ROI was taken from the lower axial plane of the vertebral body (Lad). ROI, region of interest.
Statistical analysis
SPSS version 23 (IBM Corp., Armonk, NY, USA) was used for statistical analysis. The t-test was employed to examine the difference in age between patients with and without osteoporosis, and the Mann–Whitney test was employed to analyze the disparities in CT HU values between patients with and without osteoporosis for Lau, Lam, Lad, and Lsm, as well as the mean values of the three sections (Lau, Lam, and Lad) and the mean values of the four sections (Lau, Lam, Lad, and Lsm). Analysis of variance (ANOVA) was used to compare the CT HU values of the Lau, Lam, Lad, and Lsm of the vertebral body. The correlation between CT HU values and vertebral body T-score was analyzed by linear regression analysis and Pearson correlation coefficient. Receiver operating characteristic (ROC) curve analysis (a graphical plot that shows the diagnostic performance of a binary classifier system as its discrimination threshold is varied) was performed using MedCalc version 20.27 (a statistical software package for biomedical research that provides a wide range of statistical analysis tools and graphical visualization functions) to evaluate the CT HU values in the differential diagnosis of osteoporosis.
Results
Of the 210 patients (mean age = 69.1 years; age range = 32–90 years) who received CT and BMD at an interval of <6 months between 2020 and 2021, 646 lumbar vertebrae were evaluated. Of the 210 patients with BMD determined by DXA, 134 (63.8%) were classified as having osteoporosis; in 646 vertebrae, 320 (49.5%) had a T-score ≤−2.5. Demographic characteristics and BMD as measured by DXA T-score and CT HU value are shown in Table 1.
Patient statistical characteristics and bone mineral density.

Values are given as median (range).
*P < 0.05 using the t-test, compared with the non-osteoporosis group.
P < 0.05 using the Mann–Whitney test, compared with the non-osteoporosis group.
Lad, the lower axial plane of vertebral body; Lau, the upper axial plane axial plane of vertebral body; Lam, the middle axial plane of vertebral body; Lsm, mid-sagittal plane.
The mean age of patients with osteoporosis was 72.2 years and that of patients without osteoporosis was 63.7 years; the average age of patients with osteoporosis was 9.2 years older than those without osteoporosis. The average CT HU values and DXA T-score of all vertebral sections of women were lower than that of men, and the CT HU values of Lau, Lam, Lad, and Lsm were inconsistent according to ANOVA (P < 0.001).
The CT HU values of each vertebral segment were significantly correlated with the corresponding lumbar BMD T-score (P < 0.01), and the correlation coefficients were >0.7 (Table 2). The middle axial plane CT HU value (Lam) had the best correlation with vertebral DXA T-score. There was no statistically significant difference between Lam CT HU values and average CT HU values of three planes (Lau, Lam, Lad) and average CT HU values of four planes (Lau, Lam, Lad, Lsm). The CT HU value of the middle axial plane can be used as the CT HU value of the vertebral body, which is correlated with the DXA T-score of the vertebral body. The scatter diagram of the relationship between CT HU values and DXA T-score of each section of the vertebral body (Lau, Lam, Lad, Lsm) is shown (Fig. 2). The linear regression equation of the best-fitting line of each part was calculated, and the CT HU values of each section were calculated when the T-score = −2.5 (Table 3).

Scatter plots showing the correlation between vertebral T-score and CT HU values are shown for (a) Lau: the upper plane of the vertebral body, (b) Lam: axial plane, (c) Lad: the lower plane of the vertebral body, and (d) Lsm: mid-sagittal plane.
Pearson correlation coefficients between the CT HU value and vertebral T-score.

Values are given as mean ± SD unless otherwise indicated.
*P < 0.01.
Linear regression equation between the CT HU value of each section and the T-score of the vertebral body (n = 646).

*The linear regression equation was used to calculate the CT HU value for a T-score of −2.5.
P < 0.01.
CT, computed tomography; HU, Hounsfield unit; Tad, T-score of the lower axial plane of vertebral body; Tam, T-score of middle axial plane of vertebral body; Tau, T-score of upper axial plane of vertebral body; Tsm, T-score of mid-sagittal plane.
The CT HU values matching the T-score of −2.5 were 81.5, 92.5, 82.0, and 85.1 HU in the Lau, Lam, Lad, and Lsm, respectively. In order to facilitate the clinical application, each of the CT HU thresholds was adjusted to its next “multiple of five,” respectively (10): 81.5 should be adjusted to 85, 92.5 to 95, 82.0 to 85, and 85.1 to 90. The sensitivity and specificity were 77.8% and 79.1% when the upper vertebral body (Lau) threshold was 85. The sensitivity and specificity were 80.6% and 78.2% when the lower vertebral body (Lad) threshold was 85. The mid-sagittal plane (Lsm) had a threshold of 90 with a sensitivity of 81.3% and specificity of 74.5% (Table 4). Using a ROC curve analysis of each of the four sections, we found that the optimal CT HU values for Lau, Lam, Lad, and Lsm were 87.6, 89.1, 83.1, and 77.0 HU, respectively, with AUCs of 0.870, 0.882, 0.870, and 0.867 (Table 5). Close to the optimal CT HU values we selected above, ROC curves are shown (Fig. 3).

(a) The ROC curve of osteoporosis was predicted by the CT HU values of the upper axial plane of the vertebral body (Lau); (b) the ROC curve of osteoporosis was predicted by the CT HU values of the middle axial plane (Lam); (c) the ROC curve of osteoporosis was predicted by the CT HU values of the lower axial plane of the vertebral body (Lad); (d) the ROC curve of osteoporosis was predicted by the CT HU values of the mid-sagittal plane (Lsm).; (e) the ROC curve of osteoporosis was predicted by CT HU values of the axial plane (Lam), mean values of the three sections (Lau, Lam, Lad), and the mean values of the four sections (Lau, Lam, Lad, Lsm).
Diagnostic performance of the CT HU thresholds for distinguishing osteoporotic lumbar vertebrae from non-osteoporotic lumbar vertebrae.

*Obtained using MedCalc based on the Delong method.
AUC, area under the receiver operating characteristic curve; CI, confidence interval; CT, computed tomography; HU, Hounsfield unit.
The CT HU threshold was obtained from the ROC curve.

*The optimal threshold given by MedCalc version 20.027.
Obtained by MedCalc based on the Delong method.
CT, computed tomography; HU, Hounsfield unit; ROC, receiver operating characteristic.
The diagnostic criteria for spinal osteoporosis were thresholds and adjusted thresholds derived from linear regression equations and ROC curve analysis. The criteria were 85 for Lau, 95 for Lam, 85 for Lad, and 90 for Lsm. Of the 320 vertebral bodies determined by DXA, 275 (85.9%) conformed to our CT HU values for spinal osteoporosis. In addition, we applied this diagnostic criterion to 134 patients with osteoporosis and found that 116 (88.1%) patients met our CT HU values for spinal osteoporosis.
Discussion
In the present study, we found a strong correlation between DXA T-scores and CT HU values in the Lau, Lam, Lad, and Lsm lumbar sections. The highest correlation was found in the middle axial plane of the lumbar. In addition, we also compared the mean values of the middle axial plane of the vertebral body with the three planes of the vertebral body cross-section (Lau, Lam, Lad) and the mean values of the four planes of the vertebral body (Lau, Lam, Lad and Lsm) and found no significant differences. Therefore, our study suggests that CT HU value can be used for preliminary screening of patients at high risk of osteoporosis, and the middle axial plane CT HU value can be used to evaluate patients with osteoporosis.
Some studies have shown a strong correlation between vertebral CT HU value and DXA T-score (10,17–21), with several studies showing that the vertebral CT HU value in abdominal CT can be used to screen for osteoporosis (17,22–24). However, most studies have focused on the application of the HU value of individual vertebrae in screening for osteoporosis (17,23,24); few studies have reported the relationship between CT HU value and DXA T-score at different cross-sections and its role in evaluating osteoporosis (2). It is a good choice to use the CT HU value of the vertebral body in abdominal CT to predict osteoporosis. In our study, we compared the relationship between the CT HU values of each cross-section and the DXA T-score. Previous studies have shown that there is a correlation between CT HU values in the inferior to the superior end plate, middle axial plane, and superior to the inferior end plate of the vertebral body and DXA of the vertebral body; there was no statistically significant difference between each cross-section (25). However, we found that the sections were not exactly equal and added a mid-sagittal plane to the three interfaces. Studies have estimated CT HU value for the entire vertebral body on the axial or sagittal plane, but the thresholds given are not identical (23,24,26). In terms of our findings, among the four interfaces, the middle axial plane of the vertebral body is better, with an optimal threshold of 95, a sensitivity of approximately 80.0%, and specificity of approximately 77.3%, which can be used to distinguish osteoporosis from non-osteoporosis. Some studies have compared the CT HU value of the middle axial plane of the vertebral body and the mid-sagittal plane (17). However, they have not compared a certain interface of the vertebral body with the mean of three or four interfaces of the vertebral body. We averaged the CT HU values of three (Lau, Lam, Lad) and four (Lau, Lam, Lad, Lsm) interfaces of the vertebral body, which better represented the CT HU value of the vertebral body. In addition, we also provided thresholds for three other sections to determine osteoporosis. According to these conditions, clinicians can choose the appropriate section according to the specific situation of the patient. Especially when surgeons perform vertebrae-related operations, they need to pay special attention to the bone volume of the patient's single vertebral body and select the appropriate surgical method.
The present study has some limitations. First, our study found that sex may also be a contributing factor to CT HU values. However, due to regional limitations, we did not further investigate whether the thresholds differed between sexes. We encourage future researchers to take sex into consideration as a contributing factor and explore its potential impact. Second, this is a retrospective study. The CT indications of patients are heterogeneous, as each part of the vertebral body is not completely consistent, and the calculation and selection of threshold are dependent on a large number of data studies, so a larger cohort is required to provide a more reliable threshold. Third, all the patients selected in this study needed to undergo CT and DXA examinations, so the selection of patients was limited to those who had a tendency to experience osteoporosis and had completed the DXA examination. Furthermore, soft tissue coverage can affect DXA measurement results. Finally, the presence of variability between patients was not assessed.
In conclusion, CT HU values obtained from all facets of the vertebral body in routine abdominal CT can be used to evaluate osteoporosis, reduce social healthcare expenditures, and reduce patients’ exposure to radiation. The mean value of CT HU values of each vertebral body is not completely equal. Compared to the four sections, the middle axial plane of the vertebral body is the best, so it can be a BMD measurement and assessment of osteoporosis. The axial plane does not satisfy the evaluation requirements and can also choose the appropriate section for evaluation according to the patients’ condition. Additional research with larger sample sizes is necessary to acquire precise CT HU thresholds for specific cross-sections.
Footnotes
Declaration of conflicting interests
The author(s) declared no potential conflicts of interest with respect to the research, authorship, and/or publication of this article.
Funding
The author(s) received financial support for the research, authorship, and/or publication of this article: This research supported by the Science and Technology Bureau of Nanchang City (Hongkezi 2019 No.258-5 to ZPZ); and the Science and Technology Bureau of Nanchang City (Hongkezi 2021 No.129-4 to ZPZ).
