




Abstract
Background
As guidelines endorse the use of computed tomography (CT) for examining coronary artery disease (CAD), it is important to compare the advantages and disadvantages of the novel photon counting detector CT (PCD-CT) technology with the established energy integrating detector CT (EID-CT).
Purpose
To compare the image quality of coronary computed tomography angiography (CCTA) and the Agatston scores (AS) derived from EID-CT and PCD-CT.
Material and Methods
In this prospective observational study, 28 patients underwent clinical calcium score and CCTA scans on an EID-CT and a PCD-CT scanner. CCTA images were qualitatively analyzed by five observers using visual grading characteristics. The correlation and agreement of the AS were assessed using Spearman's rank correlation and Bland–Altman plots.
Results
This qualitative analyses demonstrated a high fraction of “good” or “excellent” ratings for the image criteria in both CT systems. The sharpness of the distal lumen and image quality regarding motion artifacts were rated significantly higher for EID-CT (P < 0.05). However, the sharpness of coronary calcification was rated significantly higher for PCD-CT (P < 0.05). Spearman's rank correlation and Bland–Altman plots showed good correlation (P = 0.95) and agreement regarding the AS between EID-CT and PCD-CT.
Conclusion
Both CT systems exhibited high CCTA image quality. The sharpness of calcifications was rated significantly higher for PCD-CT. A good correlation was observed between the AS derived from the two systems.
Introduction
Cardiovascular disease is one of the major causes of death and disability in the world (1,2). Over the past two decades, coronary computed tomography angiography (CCTA) has become increasingly used as an imaging modality for coronary artery disease (CAD) (3,4). CCTA distinguishes itself from other diagnostic modalities with its excellent negative predictive value and ability to image various stages of atherosclerosis (5–8). The growing role of CCTA has been acknowledged by several guidelines, which use CT as a first-line tool for the evaluation of patients with chronic coronary syndrome and symptomatic patients in whom obstructive CAD cannot be excluded by clinical assessment alone (1,8–10).
The Agatston score (AS) has been used since the 1990s for coronary artery calcification (CAC) quantification and subsequent cardiovascular risk estimation in asymptomatic patients (11–13). The AS has demonstrated a high negative predictive value (14) because an AS of 0 strongly correlates with a lack of cardiovascular events over the following 5 years (13).
Despite technological progress, CCTA performed with energy-integrating detector CT (EID-CT) remains limited in its ability to accurately evaluate small arteries, non-calcified plaques, and the lumen near calcifications and stents (15–17).
The latest advancement in CT technology is photon counting detector CT (PCD-CT), which has been reported to offer solutions to many of the limitations related to CCTAs performed on EID-CTs, such as improved spatial resolution and soft-tissue contrast, reduced noise levels, and fewer blooming and beam-hardening artifacts (15,17–21). Unlike EID-CTs, which convert incoming photons into electric currents indirectly using scintillator and photodiode layers, PCD-CTs directly convert X-ray photons into proportional electric signals using semiconductor materials (18). The result is the possibility to create a detector with higher spatial resolution and improved dose efficiency (18). Because the energy of all incoming photons is registered by the PCD-CT, it also has an inherent capability for energy resolution. Equal weighting of low and high energy photons is therefore possible, which increases the low contrast resolution compared to EID-CTs. Another advantage is the possibility to filter out electronic noise (18,22–24). Additionally, more energy thresholds can be applied, making advanced material decomposition possible (18).
The purpose of the present study was to evaluate and compare the quality of CCTA scans between EID-CT and PCD-CT technologies on the same patients using established clinical protocols. The study also aimed to compare the AS derived from both CT technologies, as well as iodine contrast doses and patient-absorbed dose indices.
Material and Methods
Patient inclusion
This prospective single-center study, performed at the university hospital, included 30 patients with low-intermediate risk for CAD, referred for a clinical CCTA. The study was approved by the Swedish Ethical Review Authority (Dnr 2022-05041-02). The patients provided informed consent. All examinations in this study were performed from 1 October to 15 October 2022. The indication for all examinations was suspected CAD. Exclusion criteria were contraindication to iodine contrast, adverse reactions to the contrast injection during the initial clinical CCTA, an anamnesis of renal failure (cutoff at a clearance of 45 mL/min), or a very irregular pulse rendering a high radiation dose for the initial CCTA. Based on this, one patient was excluded due to a highly irregular pulse and one patient due to contrast extravasation. Patient baseline characteristics are presented in Table 1.
Patient information.
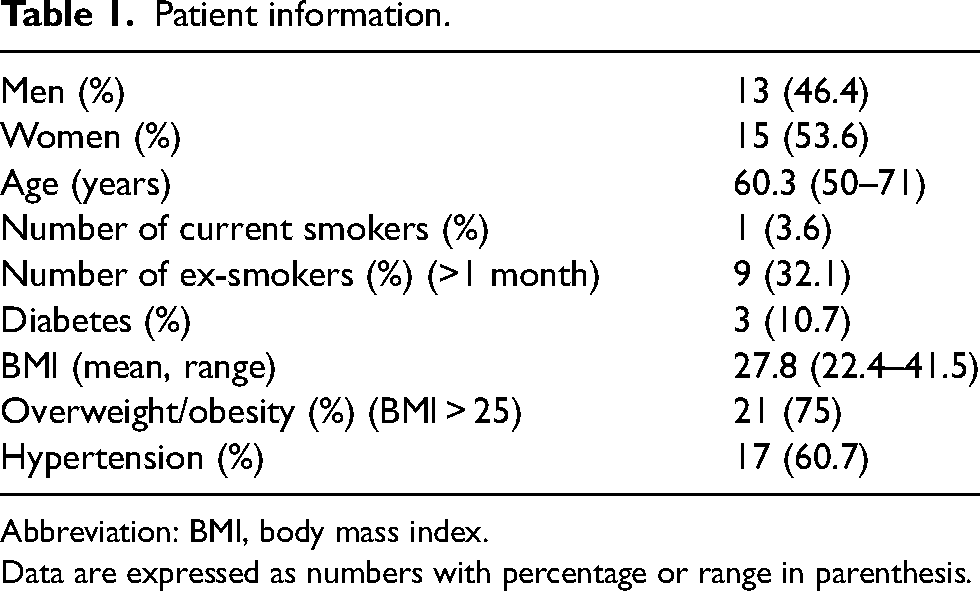
Abbreviation: BMI, body mass index.
Data are expressed as numbers with percentage or range in parenthesis.
EID-CT and PCD-CT image acquisition and reconstruction
All patients were examined with a CAC scan and a CCTA on an EID-CT (SOMATOM Force; Siemens, Forchheim, Germany) and then additionally scanned with a CAC scan and a CCTA on a PCD-CT (NAEOTOM Alpha; Siemens). The EID and PCD-CT examinations were performed during the same patient visit, with the interval between the two scans varying between 9 to 34 min (average 12 min).
CAC and CCTA scans within the study were performed using the current clinical scan protocols at our department.
Automatic mAs exposure control (CARE dose 4D; Siemens) was activated on both systems for the CAC scans with qRef mAs 50 on the EID-CT and CARE keV IQ level 19 on the PCD-CT. Automatic kVp selection (CARE kV; Siemens) was activated in the semi-mode setting 120 kVp and slider position 3 on the EID-CT. The CARE keV (Siemens) setting on the PCD-CT was optimized for non-contrast examinations, and the kVp setting was allowed to vary between 120 and 140 kVp. CAC images were reconstructed using a 3-mm slice thickness with an increment of 1.5 mm, CAC reconstruction kernel Qr36, and 512 matrix. PCD-CT CAC scans were reconstructed as 70 keV virtual monoenergetic images (VMI) as recommended by the vendor. For patients with a positive AS, an 80 keV VMI reconstruction was added.
CCTA scans on the EID-CT and PCD-CT were prospective high-pitch spirals (flash) if the patient's heart rate was regular and below 65 beats/min. Otherwise, a retrospectively gated spiral scan was used on EID-CT and sequential scan, including one or more cardiac phases, was used on PCD-CT.
Automatic mAs exposure control was activated for CCTAs on the EID-CT, and automatic kVp selection (CARE dose 4D and CARE kV; Siemens) with qRef mAs 250, ref kV 100, and slider position 11. The kVp was allowed to vary between 70 and 120 kVp. On the PCD-CT automatic exposure control (CARE dose 4D and CARE keV; Siemens) was activated with CARE keV IQ level 55. The kVp was set to 140 with CARE keV optimized for vascular scans.
If no contraindications were found, patients were given a beta-blocker (Seloken; Recordati, Milan, Italy; 1 mg/mL, 5–10 mL) intravenously and 0.8 mg nitroglycerin (Nitrolingual; Sciele Pharma, Inc., Atlanta, GA, USA; 0.4 mg/dose sublingual spray) before the EID-CT scan. Two doses of nitroglycerine were administered additionally before the PCD-CT scan if the systolic blood pressure was above 110 mmHg.
CCTA images from the EID-CT were reconstructed with 0.5-mm slice thickness with an increment of 0.25 mm, kernel Bv36, advanced modelled iterative reconstruction (ADMIRE; Siemens) with noise reduction level 4, and 5122 matrix (the maximum size). PCD-CT CCTA images were reconstructed as 55 keV VMIs with 0.4-mm slice thickness with an increment of 0.2 mm, kernel Bv44, quantum iterative reconstruction (QIR) 4, and 10242 matrix.
For CCTAs on the EID-CT, an iodine contrast (Omnipaque 350 mg/mL iodine) dose of 325 mg/kg iodine (maximum weight 77 kg) was administered for 90–120 kVp scans. This was changed to a dual flow injection for 80 kVp scans with 75% iodine contrast, and the rest of the volume (25%) replaced by saline solution (NaCl, 9 mg/mL). The same was carried out for 70 kVp scans but with 50% iodine contrast and 50% saline. An 11-s injection time was used. Both contrast and dual flow injections were followed by a 70 mL of saline chaser. The contrast injection on the PCD-CT was performed in the same manner as for 70 kVp scans on the EID-CT. To determine the optimal scan delay, a test bolus (7 mL of contrast followed by 50 mL of saline) was injected with the same injection rate before each CCTA.
CT acquisition and reconstruction parameters for CCTA are summarized in supplemental Table 1).
Image quality evaluation and statistical analysis
The quality of the CCTAs was statistically analyzed using visual grading characteristics (VGC) (25) and assessed with the visual display and grading software ViewDEX, version 3.2 (University of Gothenburg, Gothenburg, Sweden) (26–28). CCTA image data were transferred to ViewDEX for visual assessment on diagnostic review monitors (Eizo RX250; Eizo Global Headquarters; Ishikawa, Japan).
In a first observer study five thoracic radiologists with 3–17 years of CCTA experience were presented with two image sets per patient. One image set from the EID-CT or from the PCD-CT was presented one at the time (i.e. a single set evaluation). The image sets included curved multiplanar reconstructions (MPR) of the left anterior descending artery (LAD), circumflex artery (CX) and right coronary artery (RCA), an axial stack of the heart, and a reconstructed stack with three-chamber view of the left ventricle. Observers were blinded to the type of CT system and patient identity to minimize bias. A training session was held prior to the evaluation of the images, and a single-page instruction was provided about how to use the image grading software.
Observers scored each image set independently using a five-point ordinal scale for various image quality criteria (20). VGC Analyzer, version 1.0, release 2 (28,29) was used to analyze the ordinal scores. For each CT system, the accumulated fractions obtaining the highest score “5” were computed. Subsequently the fractions of lower scores “4” to “1” were added to form the VGC-curve that shows these accumulated fractions of the image criteria scores for each CT-system, with the reference CT (EID-CT) on the x-axis and the test system (PCD-CT) on the y-axis (Fig. 1).
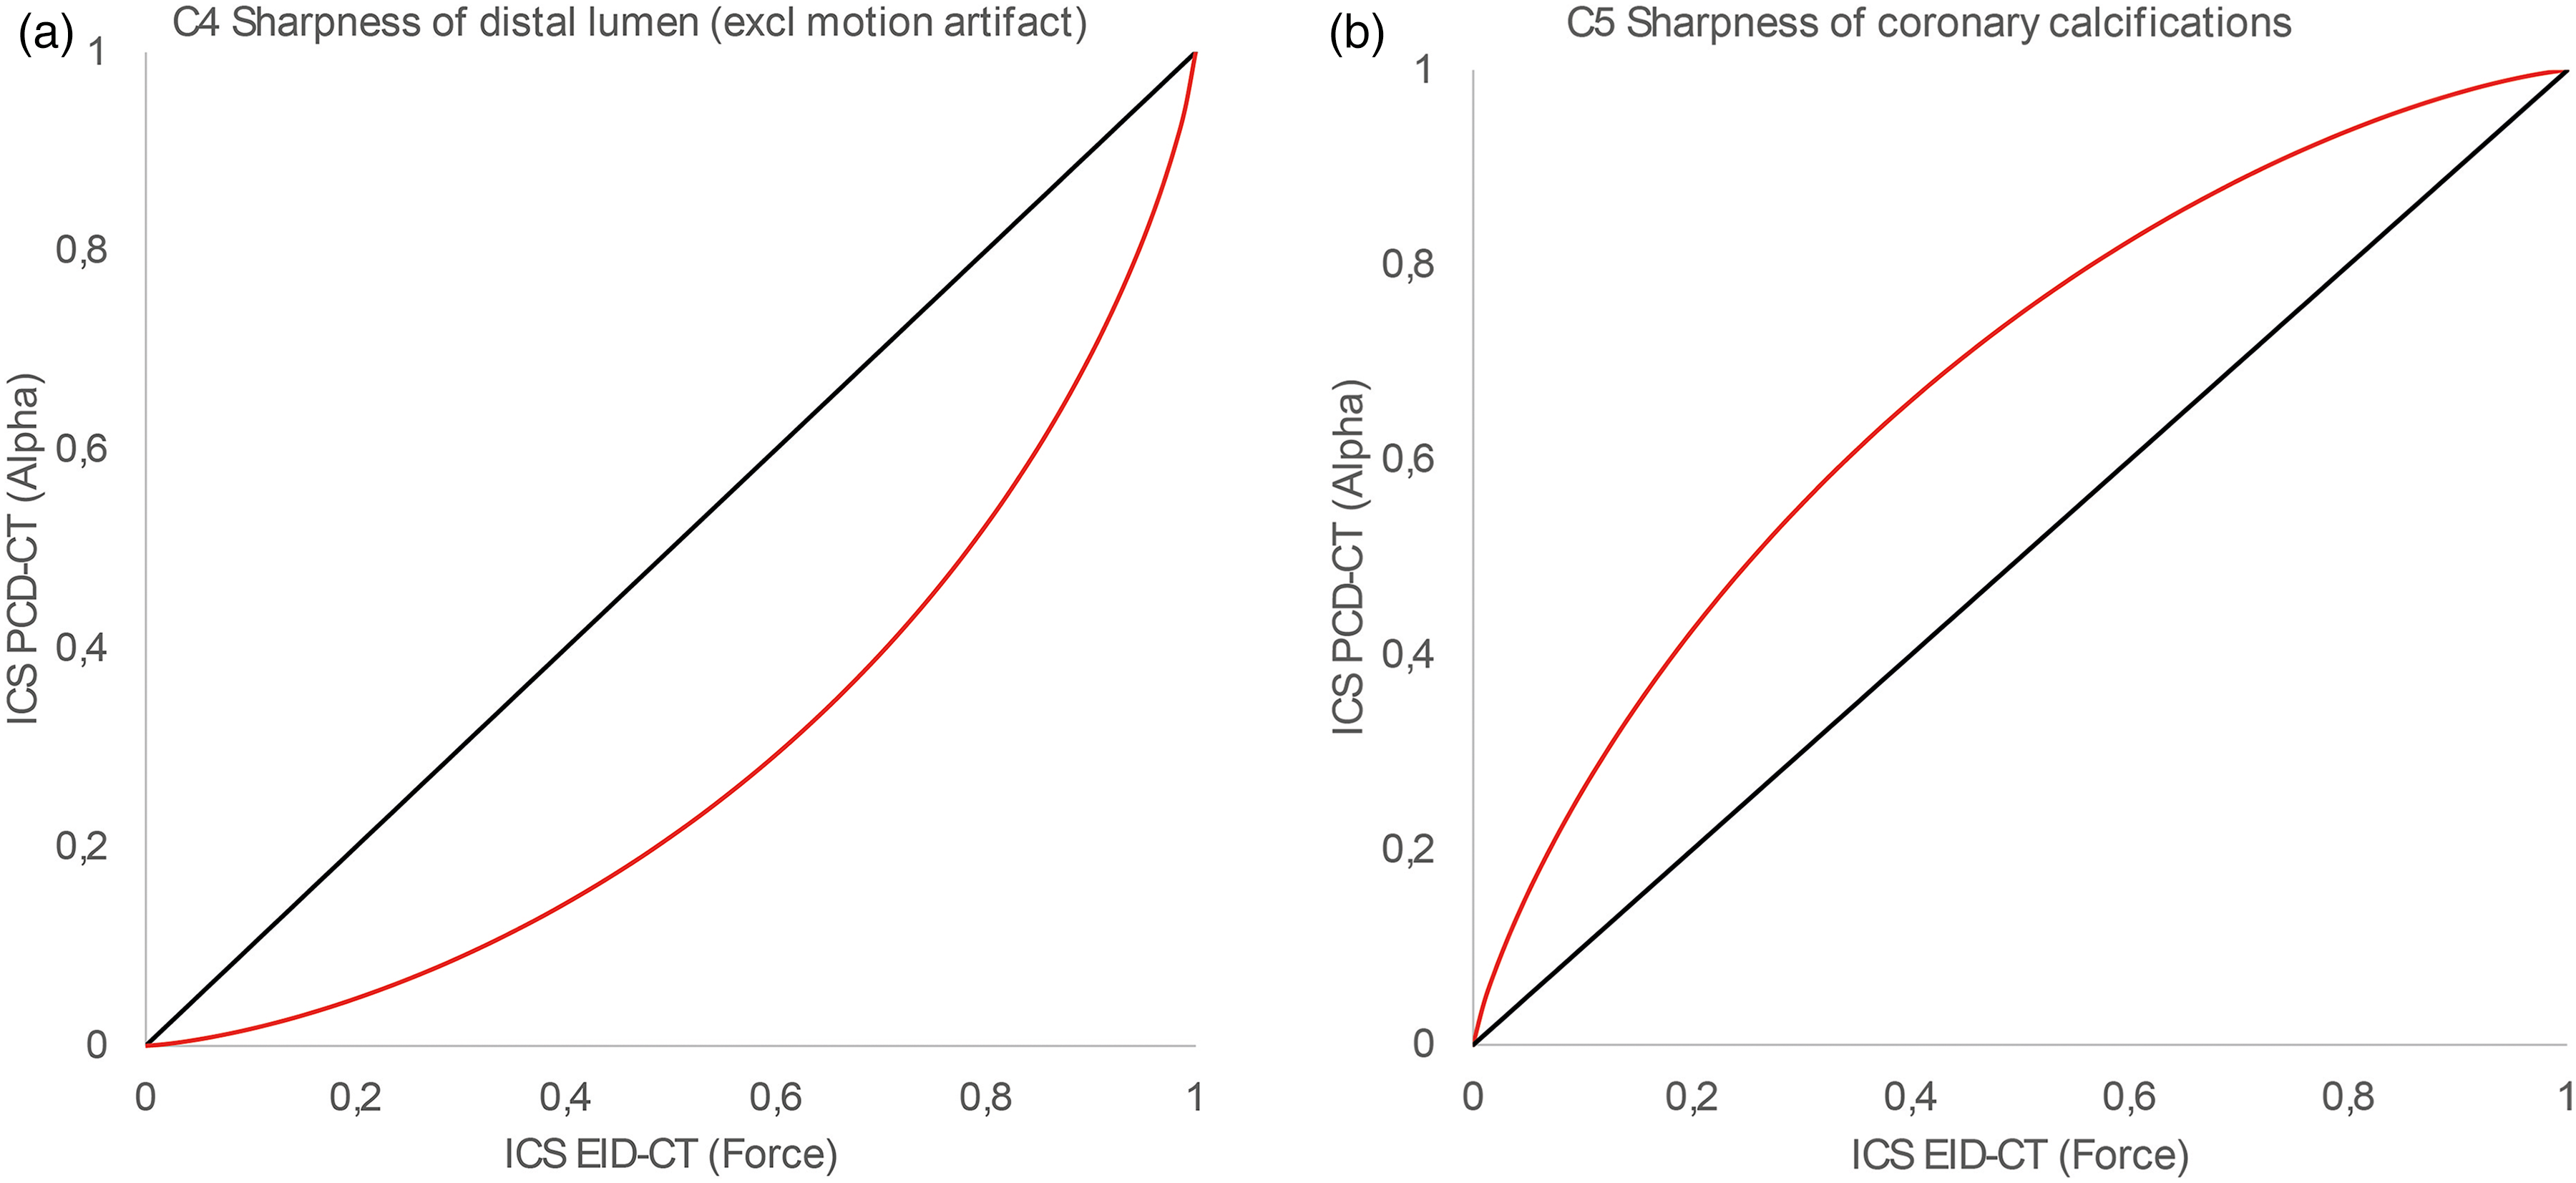
VGC-curves using pooled observer data for illustration purpose. A) Criteria C4 (Sharpness of distal lumen (excl. motion artifact)), showing significant better results in EID-CT and B) Criteria C5 (Sharpness of coronary calcifications) showing significant better results i PCD-CT.
If the area under the VGC-curve (AVGC) was larger than 0.5, the test system (PCD-CT) was superior; if AVGC < 0.5, the test system was inferior. The P-value and the 95% confidence interval (CI) of AVGC were computed for fixed observers.
In addition to the main procedure, a second observer study was constructed in which the observers reviewed 10 selected patient cases with calcifications in LAD, CX or RCA in a pairwise manner. The MPRs of the coronary arteries from the two CT systems were placed side by side in random order, and the observers rated whether they preferred the image from one of the CT systems or whether they considered the image quality to be equal in the two CT systems regarding sharpness of proximal lumen (excluding motion artifact), sharpness of distal lumen (excluding motion artifact) and sharpness of coronary calcification.
The data from this pairwise comparison were analyzed using the non-parametric sign test with SPSS, version 29 (IBM Corp., Armonk, NY, USA).
The AS evaluations, from the CAC scans, were performed by a thoracic radiologist with 20 years of radiologic experience and approximately 10 years of experience in reading cardiac images. For the 14 patients with an AS > 0, the AS was obtained using a semi-automatic post-processing calcium score software (syngo.via VB60; Siemens).
Statistical analysis for the AS was performed using Spearman's rank correlation coefficient and Bland–Altman plots with Stata, version 17.0 (StataCorp, College Station, TX, USA).
Radiation dose, including the absorbed dose indices (computed tomography dose index-volume, CTDIvol; as well as size-specific dose estimate, SSDE) and contrast agent dose were calculated. Continuous data were presented as the mean ± SD if normally distributed, or as median and interquartile range (IQR) if non-normally distributed. The normality assumption was checked using the Shapiro–Wilk test.
Because neither the dose indices, nor the contrast media volume was normally distributed, a non-parametric test (Wilcoxon test) was used to calculate significant differences using SPSS.
Results
CCTA image quality
The fraction of cases with ordinal scores “Good” (4) or “Excellent” (5) for each image criteria demonstrated overall good quality for both CT systems (Table 2). The results of the VGC analysis are shown in Table 3 and Fig. 1. The assessment of the sharpness of coronary calcifications was significantly better for PCD-CT (P = 0.024) (Table 3) and the sharpness of the distal lumen was significantly better for EID-CT (P < 0.001) when estimating the single image sets. With regards to motion artifacts, the overall assessment and the image quality were significantly better in EID-CT (P = 0.004).
Fraction of cases with ordinal scores “good” (4) or “excellent” (5) for each image criteria and computed tomography scanner.

Showing the area under the visual grading characteristic (VGC) curve, AVGC
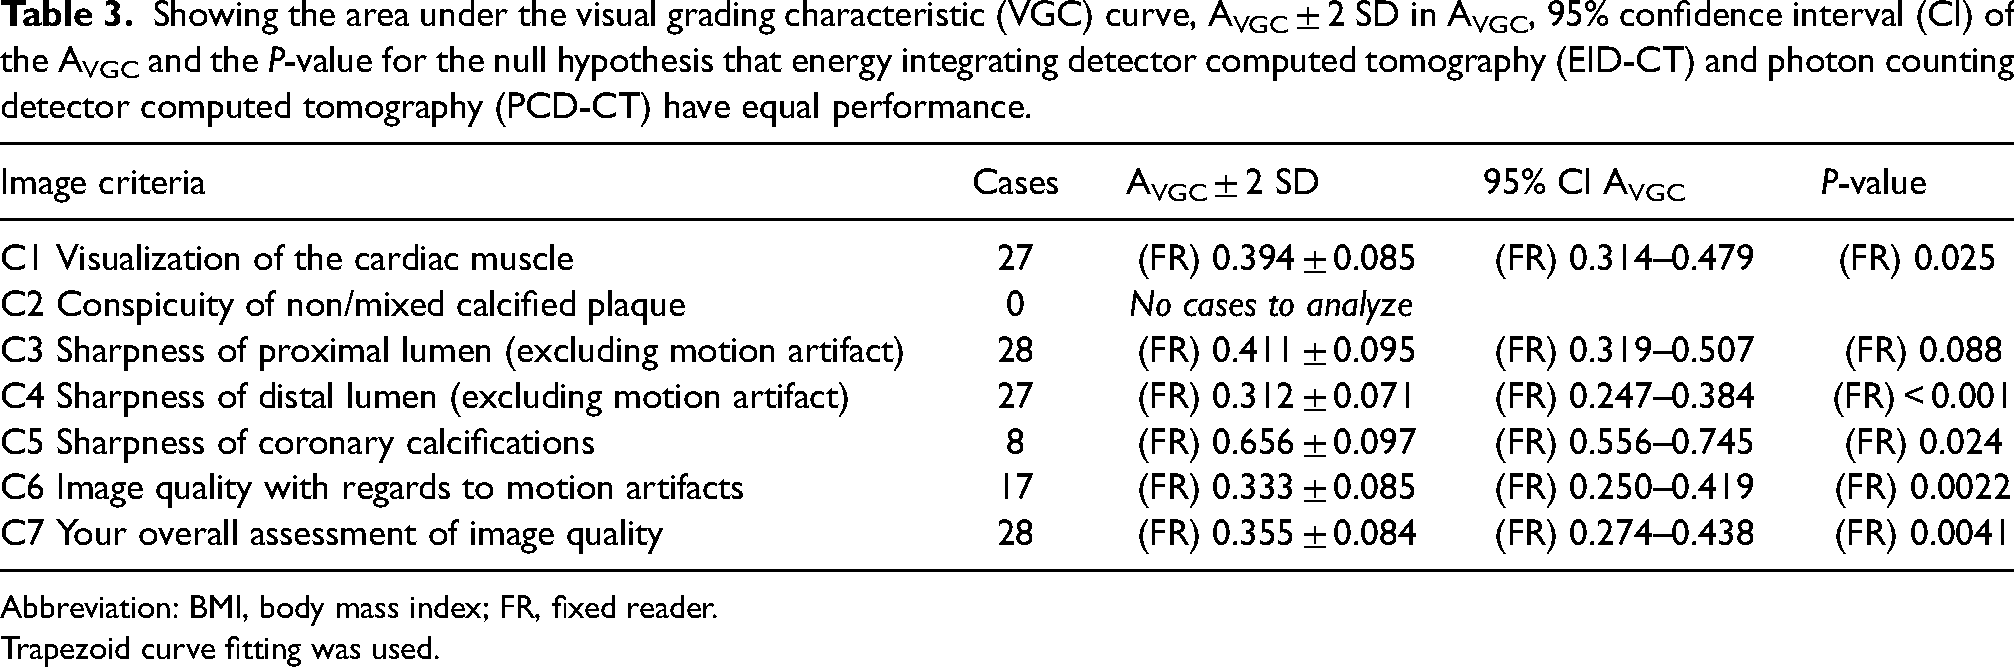
Abbreviation: BMI, body mass index; FR, fixed reader.
Trapezoid curve fitting was used.
In the pairwise comparison, directly assessing images using criteria C3–C5 to evaluate 10 patients with coronary calcification, the PCD-CT was rated significantly better with regards to C5 (sharp calcifications) (P < 0.001), but there were no significant differences in regards to C3 (proximal lumen) (P = 0.164) and C4 (distal lumen) (P = 0.511). Fig. 2 shows example of images with coronary artery calcifications from EID-CT and PCD-CT.
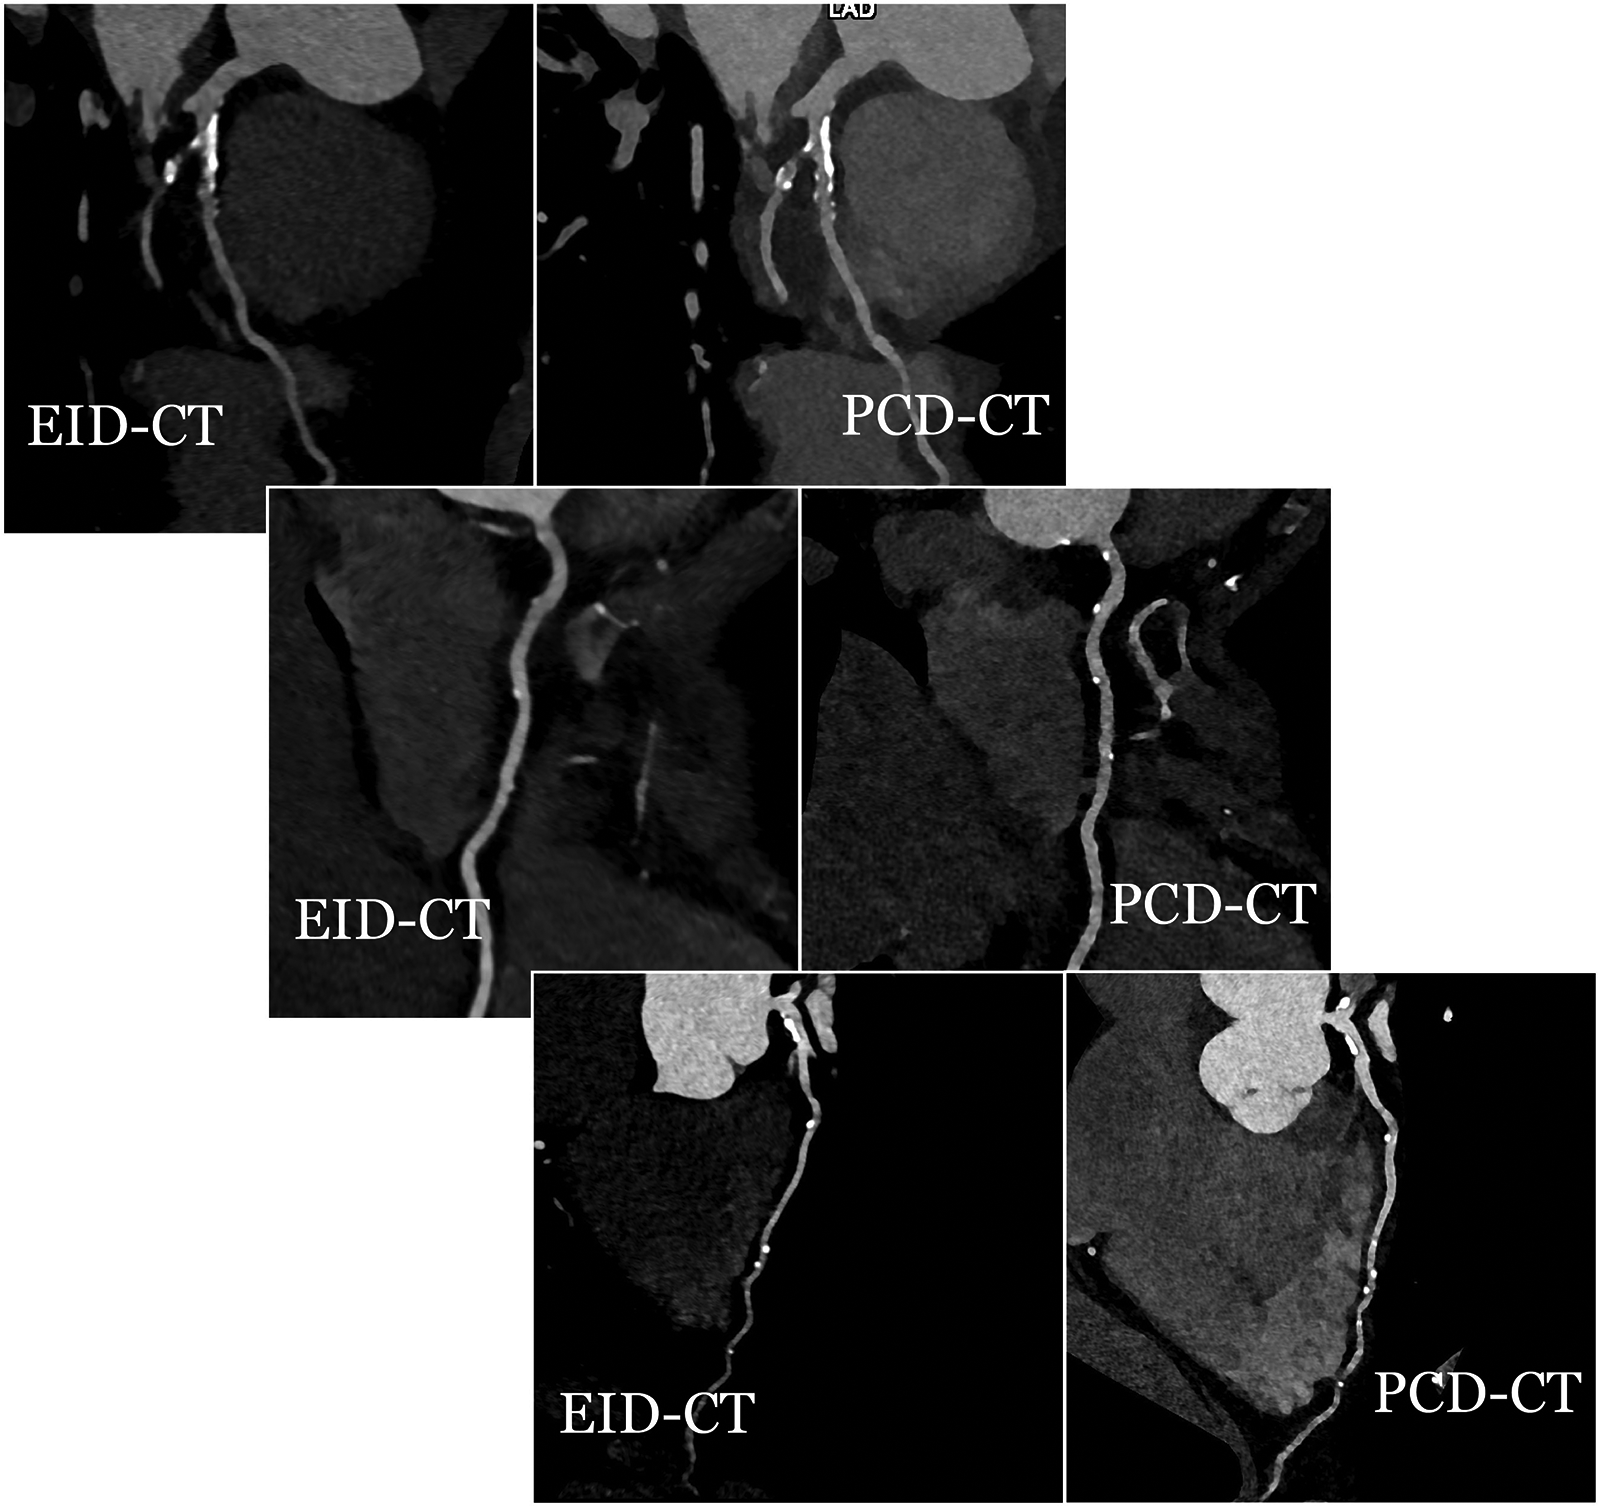
Example of coronary arteries with calcifications, from three different patients. Images from energy integrating detector computed tomography (EID-CT) to the left and photon counting detector computed tomography (PCD-CT) to the right.
AS evaluation
Evaluation of the correlation between the AS from EID-CT and PCD-CT 70 keV VMI and 80 keV VMI, showed a Spearman's rank correlation coefficient of ρ = 0.95 and ρ = 0.95 (P < 0.001), respectively (Fig. 3). The Bland–Altman mean difference and 1.96 SD upper and lower limits of agreements for the AS between the EID-CT and PCD-CT 70 keV VMI and 80 keV VMI were −71 (148 to −290) and 66 (349 to −217), respectively (Fig. 4).
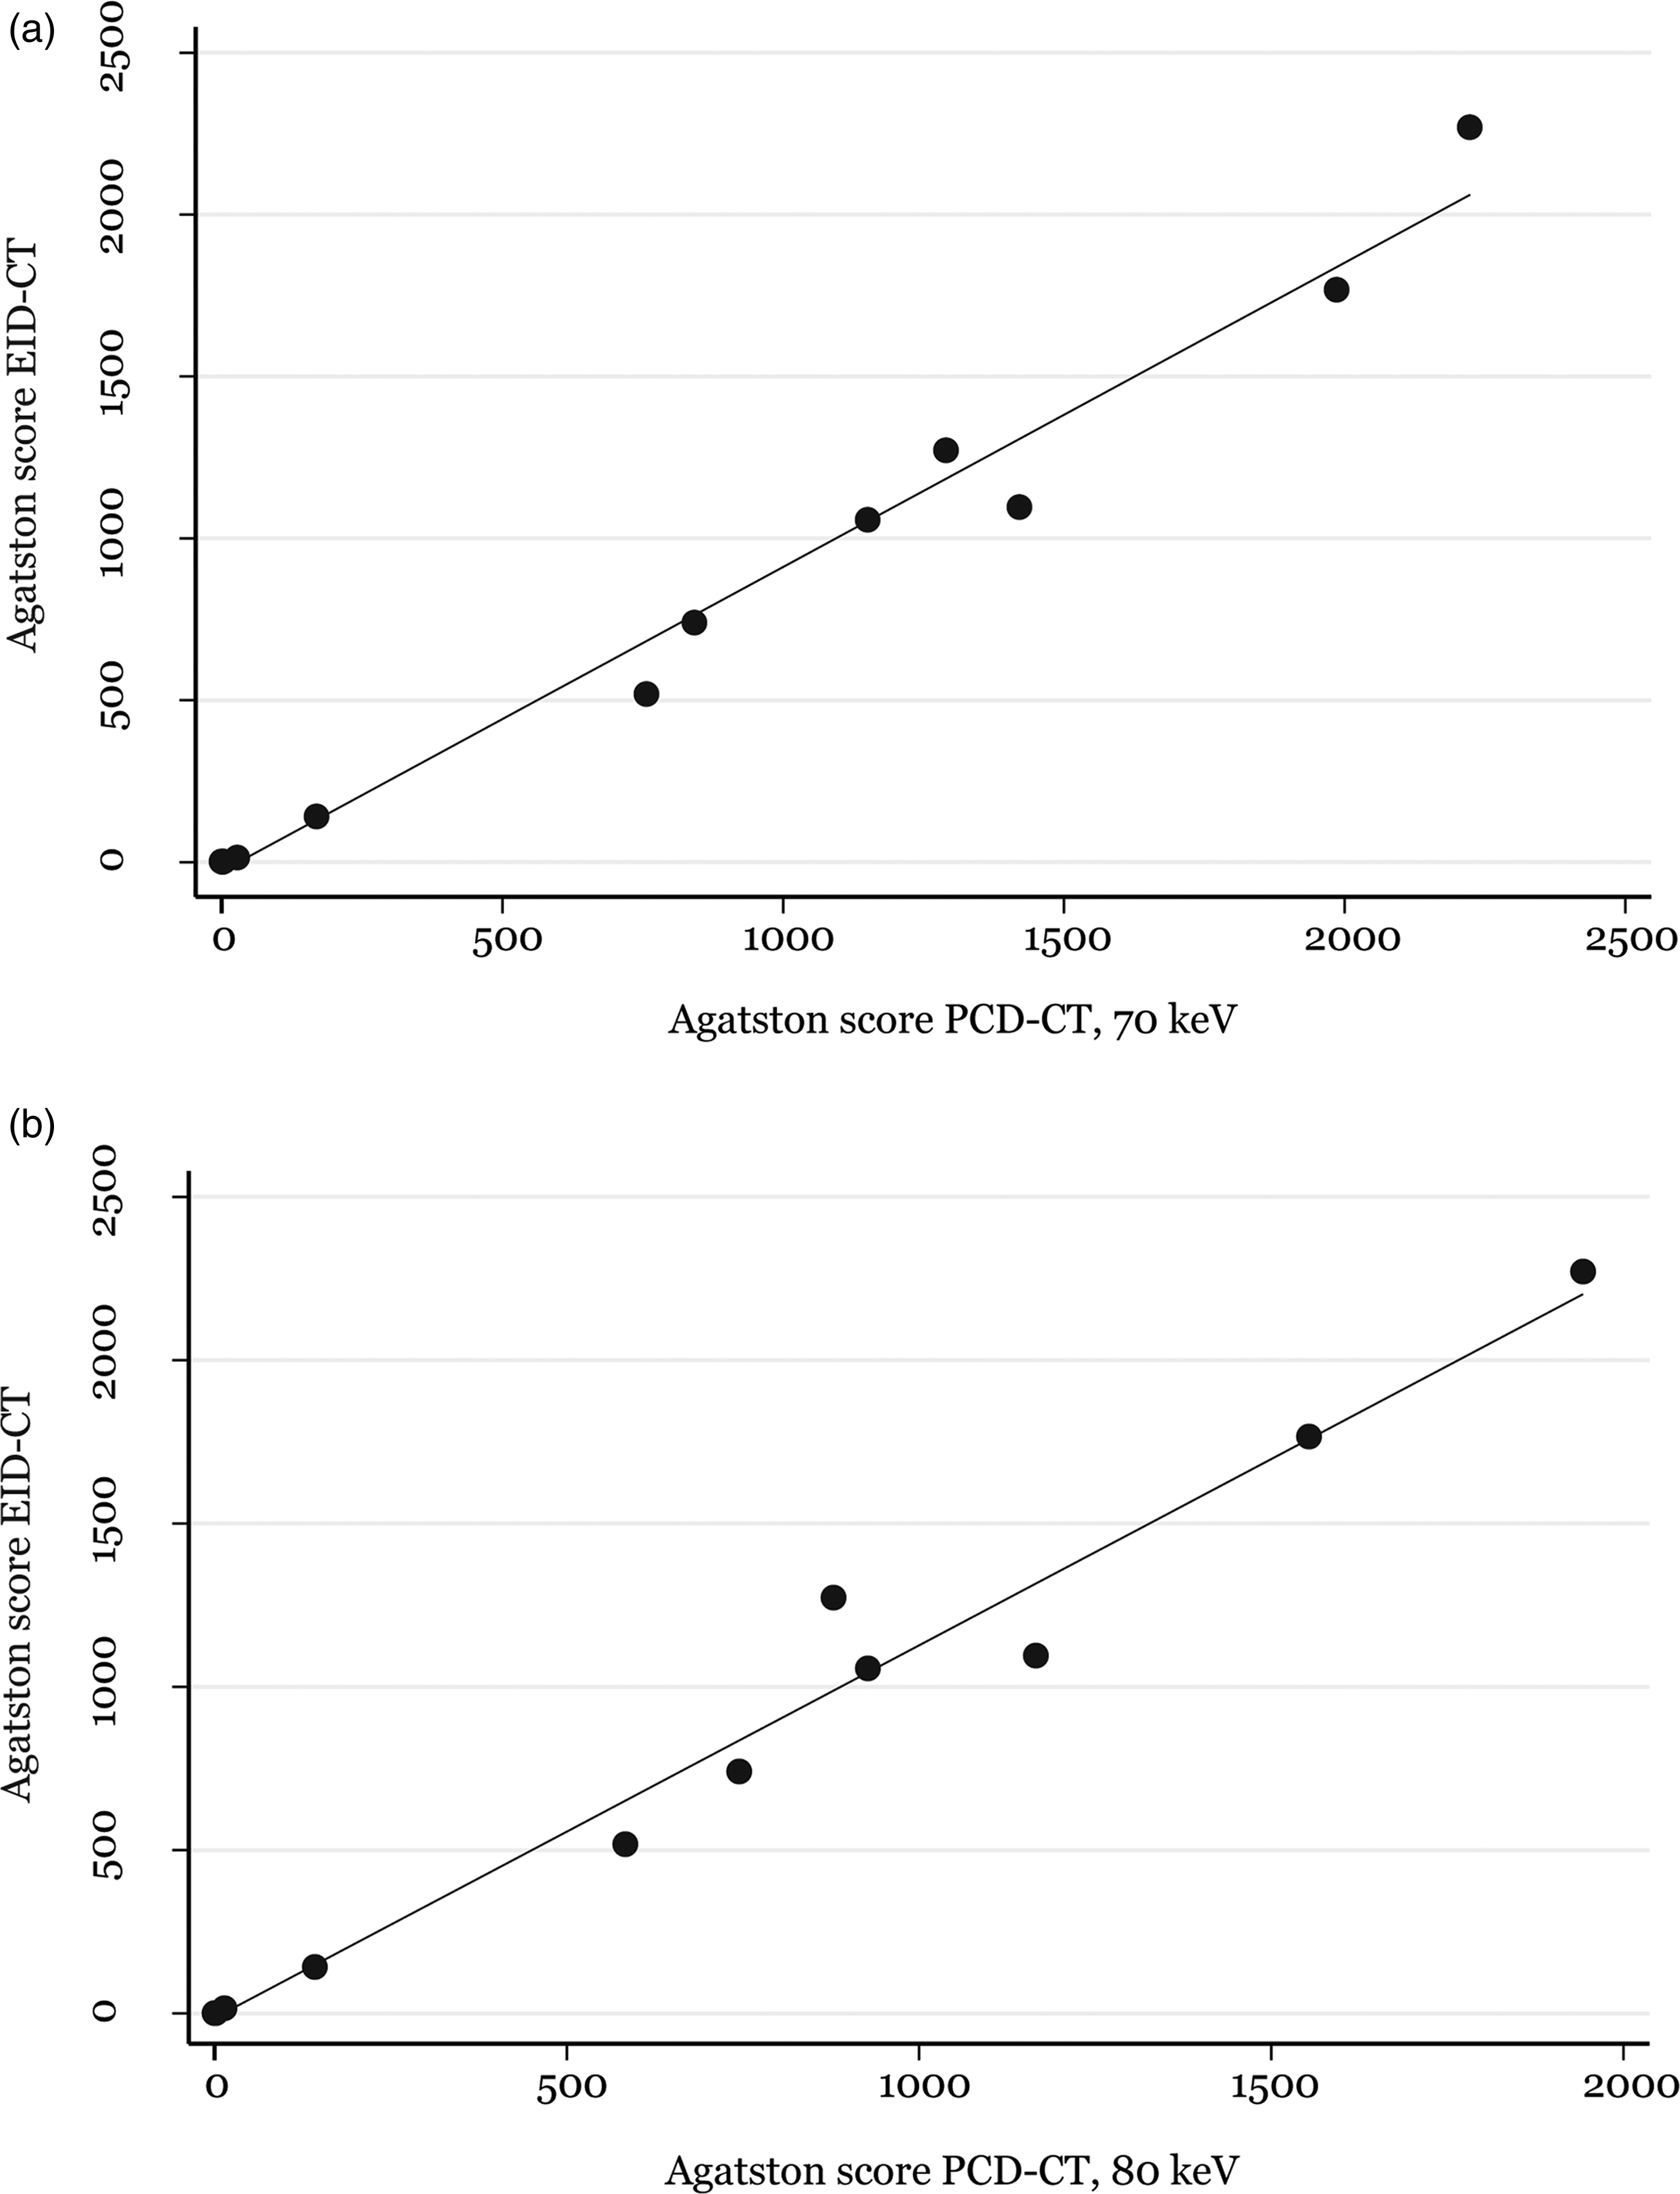
(a) Scatter plot depicting the Agatston score correlation between the energy integrating detector computed tomography (EID-CT) and photon counting detector computed tomography (PCD-CT) 70 keV expressed as Spearman rank correlation coefficient ρ = 0.95. (b) Scatter plot depicting the Agatston score correlation between the EID-CT and PCD-CT 80 keV expressed as Spearman rank correlation coefficient (ρ) = 0.95.
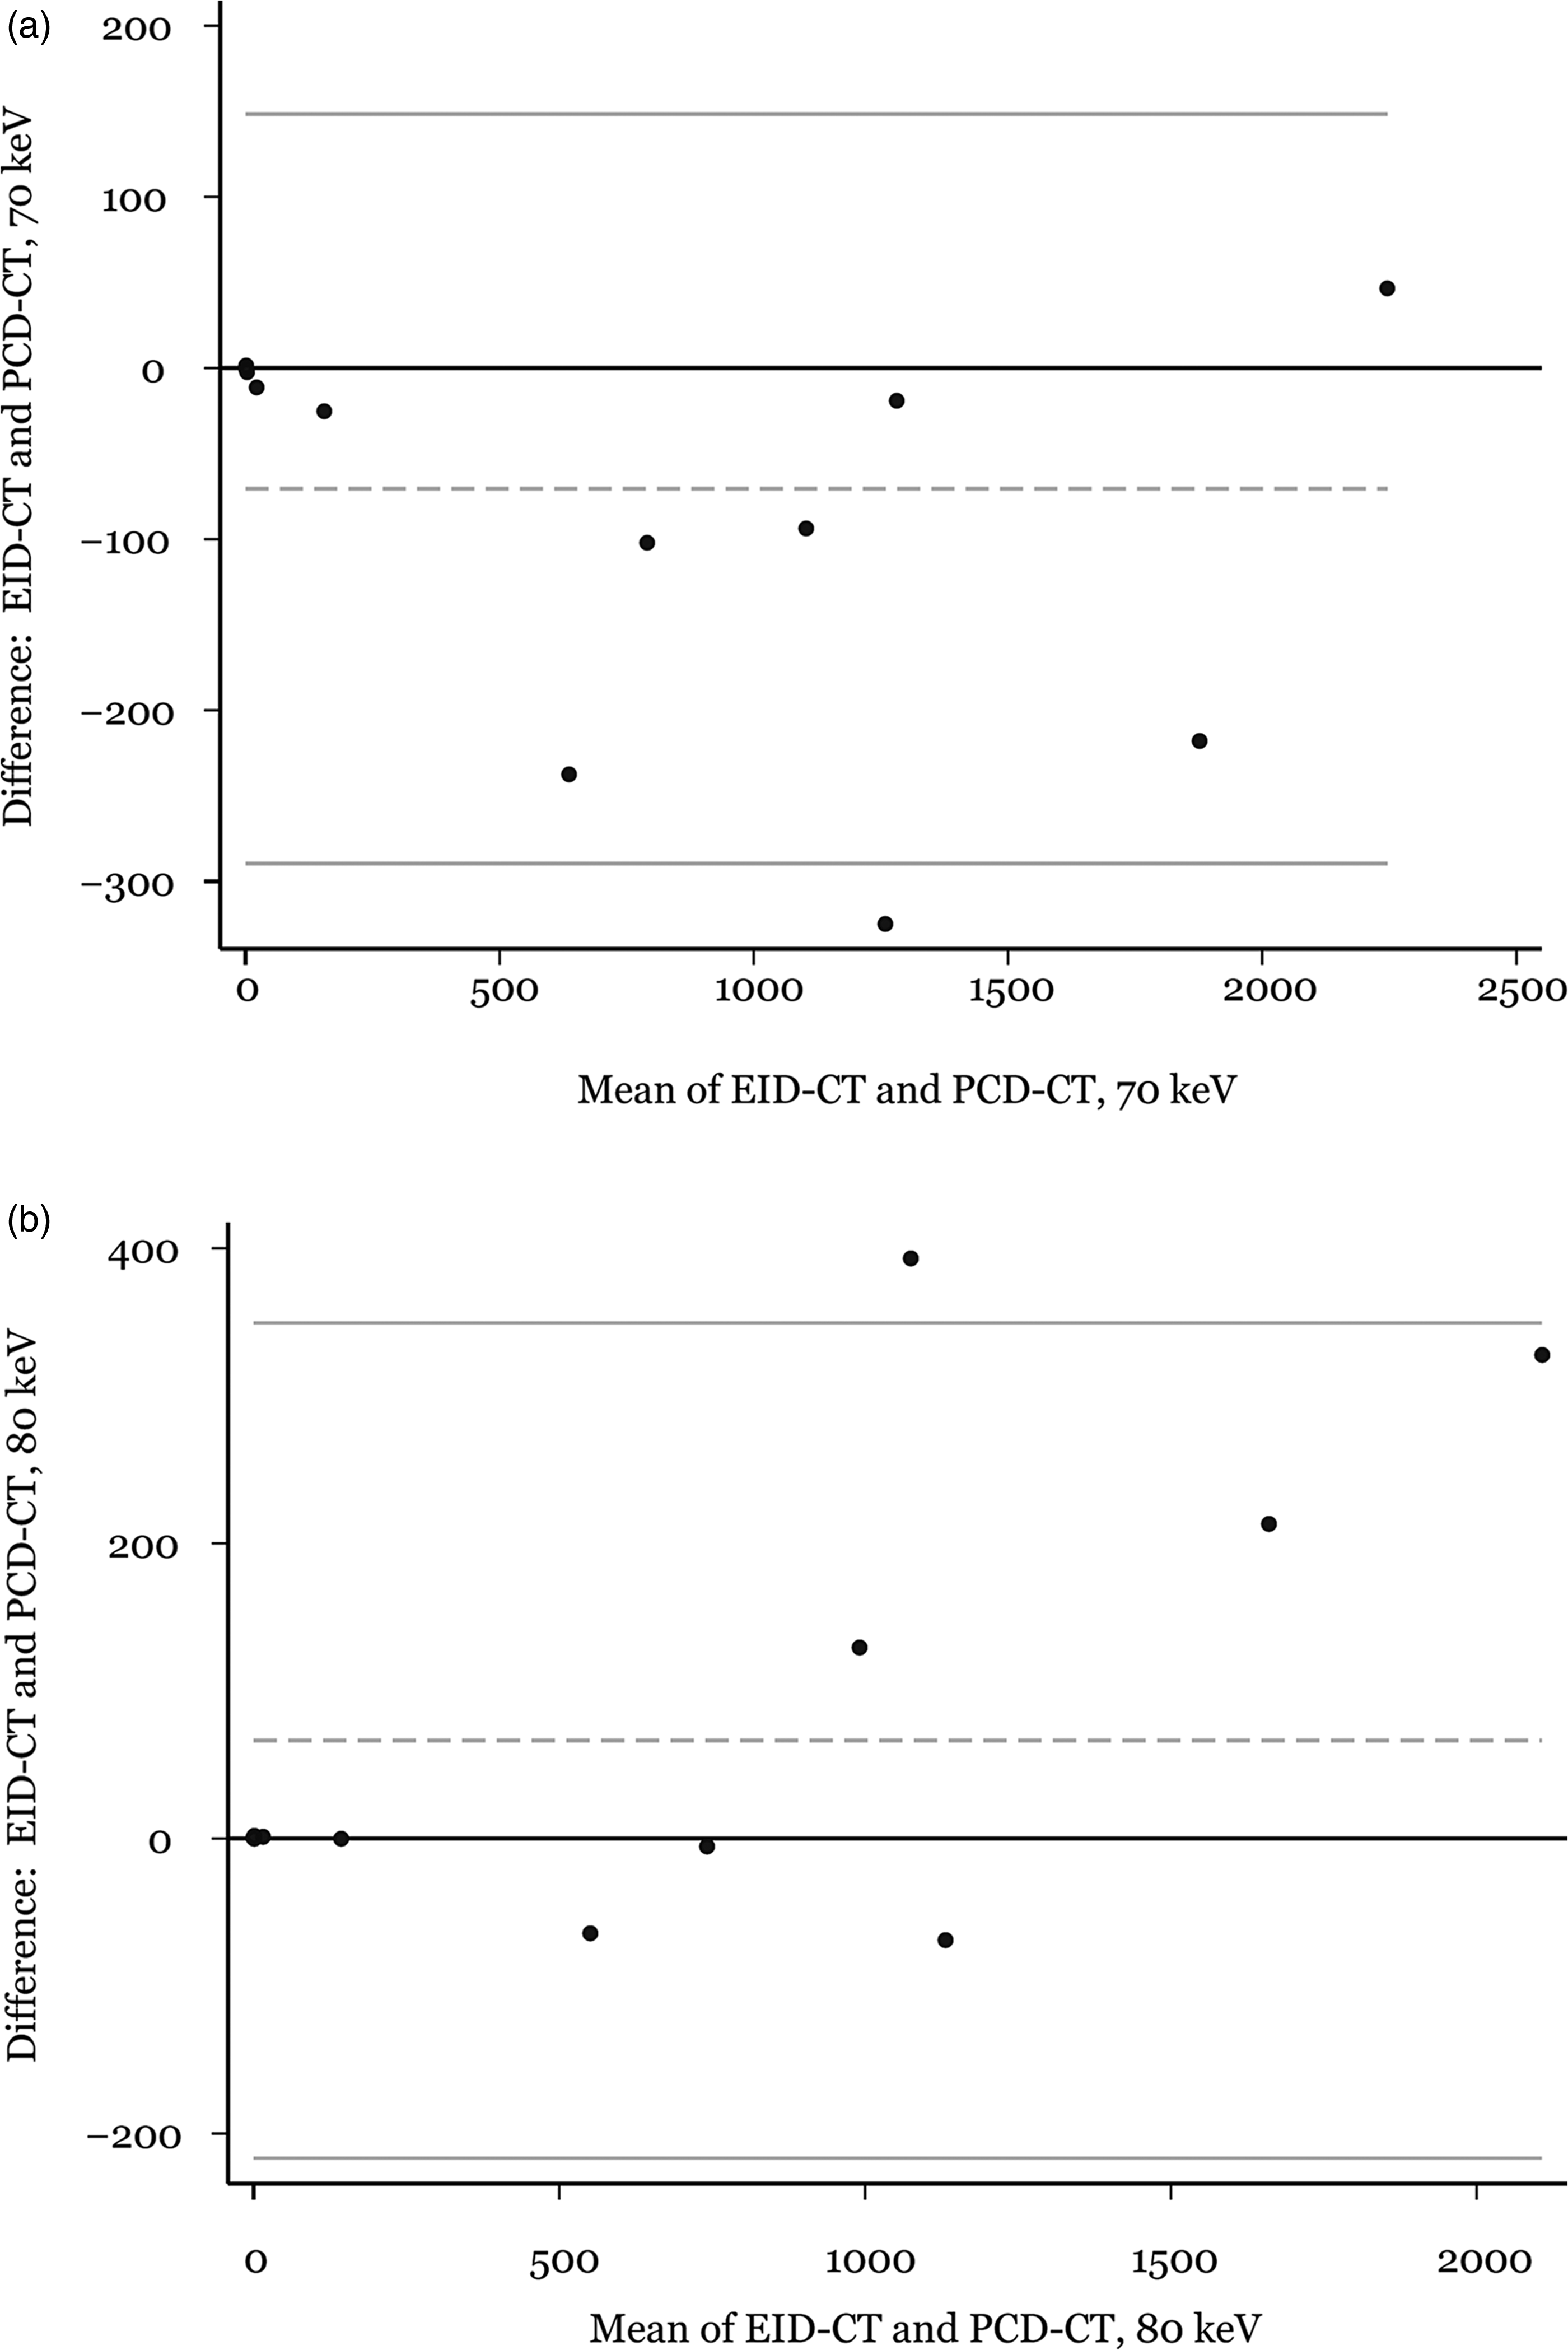
(a) Bland–Altman mean difference and 1.96 SD upper and lower limits of agreements for the AS between the energy integrating detector computed tomography (EID-CT) and photon counting detector computed tomography (PCD-CT) 70 keV were −71 (148 to −290). (b) Bland–Altman mean difference and 1.96 SD upper and lower limits of agreements for the AS between the EID-CT and PCD-CT 80 keV were 66 (349 to −217).
Radiation dose and iodine contrast agent dose
Both absorbed dose indices (CTDIvol and SSDE) were significantly lower (P = 0.016 and P = 0.031, respectively) with PCD-CT than with EID-CT. The median (IQR) of the CTDIvol with EID-CT was 9.3 (2.6–17.0) mGy compared to 4.5 (2.2–14.7) mGy with PCD-CT. The median (IQR) of SSDE with EID-CT was 13.0 (3.3–20.7) mGy compared to 6.5 (2.9–17.4) mGy with PCD-CT. In flash-mode, the CTDIvol and SSDE were not statistically different between PCD and EID scanners (P = 0.285 and P = 0.114), whereas spiral mode on the EID-CT rendered a significantly higher dose versus sequence mode on the PCD-CT (P = 0.004 and P = 0.006).
The iodine contrast agent dose was significantly lower for the PCD-CT (34.6 ± 4.5 mL) compared to EID-CT (44.4 ± 13.2 mL) (P < 0.001).
Discussion
In the present study, both systems produced comparable, high-quality images. A good correlation and agreement was also found between the AS derived from both systems.
Given the established use of CCTA and AS in clinical settings, it becomes vital to explore whether the transition from EID-CT to the innovative PCD-CT technology will yield consistent image quality and quantitative AS outcomes (17,24,30).
When comparing the image quality of CCTAs performed on EID-CT and PCD-CT, both methods received high scores. In the single set evaluation, the EID-CT CCTA images were rated slightly higher than PCD-CT CCTA images in general, with the exception of calcium demarcation. Those differences can partly be explained by the scan mode differences because sequential scans tend to have more stairstep and slab artifacts with pronounced differences in the contrast filling.
In both the single set and the pairwise side-by-side study, sharpness of coronary calcifications demonstrated superior results for the PCD-CT. This is coherent with previous studies (20,31,32), showing that the newly developed PCD-CT technology provides important spatial resolution advantages over EID-CT, which in turn may yield better detection and evaluation of coronary plaques (31–33). These findings on the coronary calcification sharpness indicate that the improved spatial resolution of PCD-CT may provide advantages that improve CCTA specificity. Such developments could reduce the future need for invasive coronary angiography, thus reducing the risk of adverse complications (34), as well as reducing health care costs (35).
Patients referred for CCTA were investigated with the current clinical scan protocols at our department, which include both prospectively gated (sequence and flash) and retrospective spiral scans (spiral). Because the method to decide scan mode differs slightly between the EID-CT and PCD-CT, some patients were scanned using different scan modes on the two systems. Accordingly, the radiation dose also differed between the two systems. If the chosen protocol was a prospectively gated scan, the subsequent dose was lower but the risk of motion-artifacts would be higher. Because some of the patients were appointed to a retrospective spiral scan protocol on EID-CT, the mean radiation dose was higher for these examinations, whereas the risk for motion artifacts in the included images was reduced. However, there were no statistically significant differences between dose indices for patients appointed to the prospective high-pitch spiral (Flash) examinations.
As another factor affecting the PCD-CT image quality, the automated exposure control was set to the reference level CARE keV IQ level 55, which is a lower image quality setting compared to the vendor recommended IQ level 64. This setting was chosen as an attempt to have a dose-neutral scan protocol on the PCD-CT contra EID-CT. The scan mode difference alone did lead to a significantly lower radiation dose for the PCD-CT scans. This leaves room for the possibility to increase the IQ level, which could improve visualization of small arteries and the overall image quality (33).
A third factor that may have had an impact on the assessment is that the evaluating radiologists were more accustomed to images from EID-CT. Different iterative reconstructions were used in the two CT systems. Iterative reconstructions designed for EID-CT have been showed to change noise texture. In the QIR used in PCD-CT, however, noise reduction can be achieved without compromising image texture. Due to this, the images from the different CT systems appeared slightly different (36). The extent to which radiologists adapt and accept images with a new appearance (e.g. those reconstructed with model-based iterative reconstruction technique) has been studied by Marin et al. (37) and Kataria et al. (38). Their results suggest that radiologists possess the ability to adapt to some extent. This adaptability will likely be essential for the acceptance of PCD-CT images not only for CCTA, but for a wide range of examinations.
Although AS is an older method, it remains the most extensively studied and accepted calcium scoring method in both clinical and research settings (12). Consequently, it is crucial to authenticate the applicability of this method in relation to the PCD-technology. Although there were only 14 patients with a positive AS, the comparison between EID-CT and PCD-CT showed good correlation and agreement, confirming previous results (39). To explore any over/underestimation of the AS, the PCD-CT data were reconstructed as 70 keV and 80 keV VMIs. VMI 70 keV showed a tendency for overestimation of the AS, whereas VMI 80 keV showed a tendency to underestimate the AS for the PCD-CT (39). Therefore, in terms of the AS, the best match between EID-CT and PCD-CT is likely somewhere between these two keV-levels, although larger studies are needed to validate this result.
Several strategies can be used to reduce the use of intravenous iodine contrast in CT, such as contrast media protocols adapted to the tube voltage (40–43). The spectral features of the PCD-CT technology improve the impact of low photon energies and enable CCTA reconstructions with 55 keV VMIs. This allows for a reduction of the iodine contrast dose, an approach that could lead to the future incremental use of CCTA in patients with reduced kidney function. All CCTA reconstructions from the PCD-CT were 55 keV VMIs, as recommended by the vendor.
The present study has important limitations. The study comprised only 28 patients with low to intermediate risk of CAD. Consequently, only a limited number (14 patients) of coronary artery plaques were available for analysis. Also, because the decision tree for scan mode in our clinical protocols differs slightly between the EID-CT and PCD-CT, some of the patients were scanned with different scan modes in the two examinations
In conclusion, the present study indicates that both types of CT systems are capable of producing high-quality CCTA images. However, PCD-CT outperformed EID-CT in terms of calcification demarcation. There was also a good correlation between the AS from PCD- and EID-CT. Furthermore, PCD-CT required lower radiation and iodine contrast doses than EID-CT when using standard clinical scan protocols. These findings are encouraging for the impending shift to this new technology.
Supplemental Material
sj-docx-1-acr-10.1177_02841851231199384 - Supplemental material for A prospective study comparing the quality of coronary computed tomography angiography images from photon counting and energy integrating detector systems
Supplemental material, sj-docx-1-acr-10.1177_02841851231199384 for A prospective study comparing the quality of coronary computed tomography angiography images from photon counting and energy integrating detector systems by Susann Skoog, Michael Sandborg, Lilian Henriksson, Mårten Sandstedt, Håkan Gustafsson and Anders Persson in Acta Radiologica
Footnotes
Acknowledgements
We thank Mats Fredriksson, PhD, Forum Ostergotland, Faculty of Medicine, Linkoping, Sweden, who provided help with the statistics. We are grateful to Bente Konst, PhD, Center for Medical Image Science and Visualization (CMIV), Linkoping University, Linkoping, Sweden, for help with calculation of radiation-dose indices. We are also grateful to Gunnar Wiklund, MD, Department of Radiology and Department of Health, Medicine and Caring Sciences, Linköping University, Linköping, Sweden and Gusten Nyberg, MD, Department of Radiology and Department of Health, Medicine and Caring Sciences, Linköping University, Linköping, Sweden, for help with the VGC review. Furthermore, we are grateful for the support from Siemens Healthineers regarding the use of the PCD-CT. This work has been conducted within (in collaboration with) Center for Medical Image Science and Visualization (CMIV) at Linköping University, Sweden. CMIV is acknowledged for provision of financial support and access to leading edge research infrastructure.
Ethics approval
The study was approved by the Swedish Ethical Review Authority (Dnr 2022-00009-01). The patients provided informed consent, both oral and written.
Declaration of conflicting interests
The authors declared no potential conflicts of interest with respect to the research, authorship, and/or publication of this article.
Funding
The author(s) received the following financial support for the research, authorship, and/or publication of this article: This study has received research funding by ALF grants, Region Ostergotland, LIO 899441

Supplemental material
Supplemental material for this article is available online.
References
Supplementary Material
Please find the following supplemental material available below.
For Open Access articles published under a Creative Commons License, all supplemental material carries the same license as the article it is associated with.
For non-Open Access articles published, all supplemental material carries a non-exclusive license, and permission requests for re-use of supplemental material or any part of supplemental material shall be sent directly to the copyright owner as specified in the copyright notice associated with the article.
