




Abstract
Background
The 2021 World Health Organization (WHO) classification considers a histological low grade glioma with specific molecular characteristics as molecular glioblastoma (mGBM). Accurate identification of mGBM will aid in risk stratification of glioma patients.
Purpose
To explore the value of machine learning models based on magnetic resonance imaging (MRI) radiomics features in predicting mGBM.
Material and Methods
In total, 166 patients histologically diagnosed as low-grade diffuse glioma (WHO II and III) were included in the study. Fifty-three cases were reclassified as mGBM based on molecular status. Four dimensionality reduction methods including distance correlation (DC), gradient boosted decision tree (GBDT), least absolute shrinkage and selection operator (LASSO) and minimal redundancy maximal relevance (MRMR) were used to select the optimal signatures. Six machine learning algorithms including support vector machine (SVM), linear discriminant analysis (LDA), neural network (NN), logistic regression (LR), K-nearest neighbour (KNN) and decision tree (DT) were used to develop the classifiers. The relative SD was used to evaluate the stability of the models, and the area under the curve values in the independent test group were used to evaluate their performances.
Results
NN_DC was determined as the optimal classifier due to the highest area under the curve of 0.891 in the test group. The classification accuracy, sensitivity, specificity, positive predictive value and negative predictive value of NN_DC were 0.915, 0.842, 0.950, 0.889 and 0.927, respectively.
Conclusion
Machine learning models can predict mGBM non-invasively, which may help to develop personalized treatment strategies for neurosurgeons and provide an effective tool for accurate stratification in clinical trials.
Introduction
Diffuse low grade glioma (LGG; World Health Organization [WHO] grade II and grade III) comprises a group of common primary tumors in the central nervous system and represents a highly heterogeneous tumor entity (1). Prognosis varies among different patients despite the same standardized treatment (2). With ongoing advancements in the understanding of the pathogenesis of brain tumors, the regulatory role of molecular features in the occurrence and prognosis of LGG is gradually being revealed. The reclassification of LGG based on the combination of histological and molecular features is crucial for estimating prognosis and developing personalized treatment strategies (3,4).
In the 2021 WHO classification of tumors of the central nervous system, WHO grade II or III histological isocitrate dehydrogenase (IDH) wild-type diffuse gliomas carrying epidermal growth receptor (EGFR) factor amplification, chromosome 7 gain/chromosome 10 loss or telomerase reverse transcriptase (TERT) promoter mutations are reclassified as glioblastoma (GBM) in the new guidelines (5). Previous treatment strategies also need to be adjusted with the new guidelines. A tool that can non-invasively identify this new molecular glioblastoma (mGBM) will be greatly appreciated in clinical practice. It will also allow more homogeneous patient populations to participate in clinical trials, facilitating the evaluation of new treatments.
Conventional magnetic resonance imaging (MRI) has been widely used in the imaging of central nervous system tumors due to the excellent tissue resolution, which helps to provide accurate lesion localization, prediction of treatment response and long-term follow-up monitoring after surgery (6,7). However, conventional imaging is not competent to reveal the histological and molecular information of the lesions and is highly dependent on the experience and subjective perception of the radiologists. Radiomics is an emerging medical image analysis technique that connects conventional imaging with histopathological and molecular findings by extracting high-throughput microscopic features (8). Machine learning models based on radiomics have shown great potential and have been effectively applied to the diagnosis, grading and prediction of molecular features of tumors (9–11). Previous studies have demonstrated that radiomics can distinguish histologically defined glioblastoma from LGG, but its value for the identification of newly defined mGBM in WHO 2021 remains to be investigated (10,12). The present study aimed to non-invasively predict mGBM by machine learning models based on multiparameter MRI radiomics features.
Material and Methods
Patients
The study was approved by the institutional review board of our institute, and the need for informed consent was waived. We retrospectively reviewed the patients with diffuse gliomas at our institution from January 2019 to February 2022. The inclusion criteria for this study were: (a) patients with histological diagnosis of LGG including diffuse astrocytic and oligodendroglial tumors (grade II and III) according to the 2016 WHO CNS tumors classification; (b) being the first surgery; (c) molecular expressions including IDH, epidermal growth factor receptor (EGFR), TERT and chromosome 7/10 status were determined; and (iv) MRI pre-surgery including T1-weighted images, T2-weighted images, contrast enhancement T1-weighted images and fluid-attenuated inversion recovery images were acquired with 3T scanners. The exclusion criteria were: (a) juvenile patients; (b) history of related treatments such as radiotherapy and chemotherapy before MRI examination; and (c) motion or susceptibility artifacts that hinder pre-processing or segmentation. Finally, 166 eligible patients were enrolled in the study in total. Based on molecular expression status, 53 cases (male = 32, female = 21) were defined as mGBM and the remaining 113 cases (male = 70, female = 43) were defined as LGG. The mean ± SD ages of patients with mGBM and LGG were 52 ± 11 and 53 ± 12.6 years, respectively. The patients were randomly assigned to either the training (n = 118) or test group (n = 48) in a ratio of 7:3. A flow chart of this study is shown in Fig. 1.
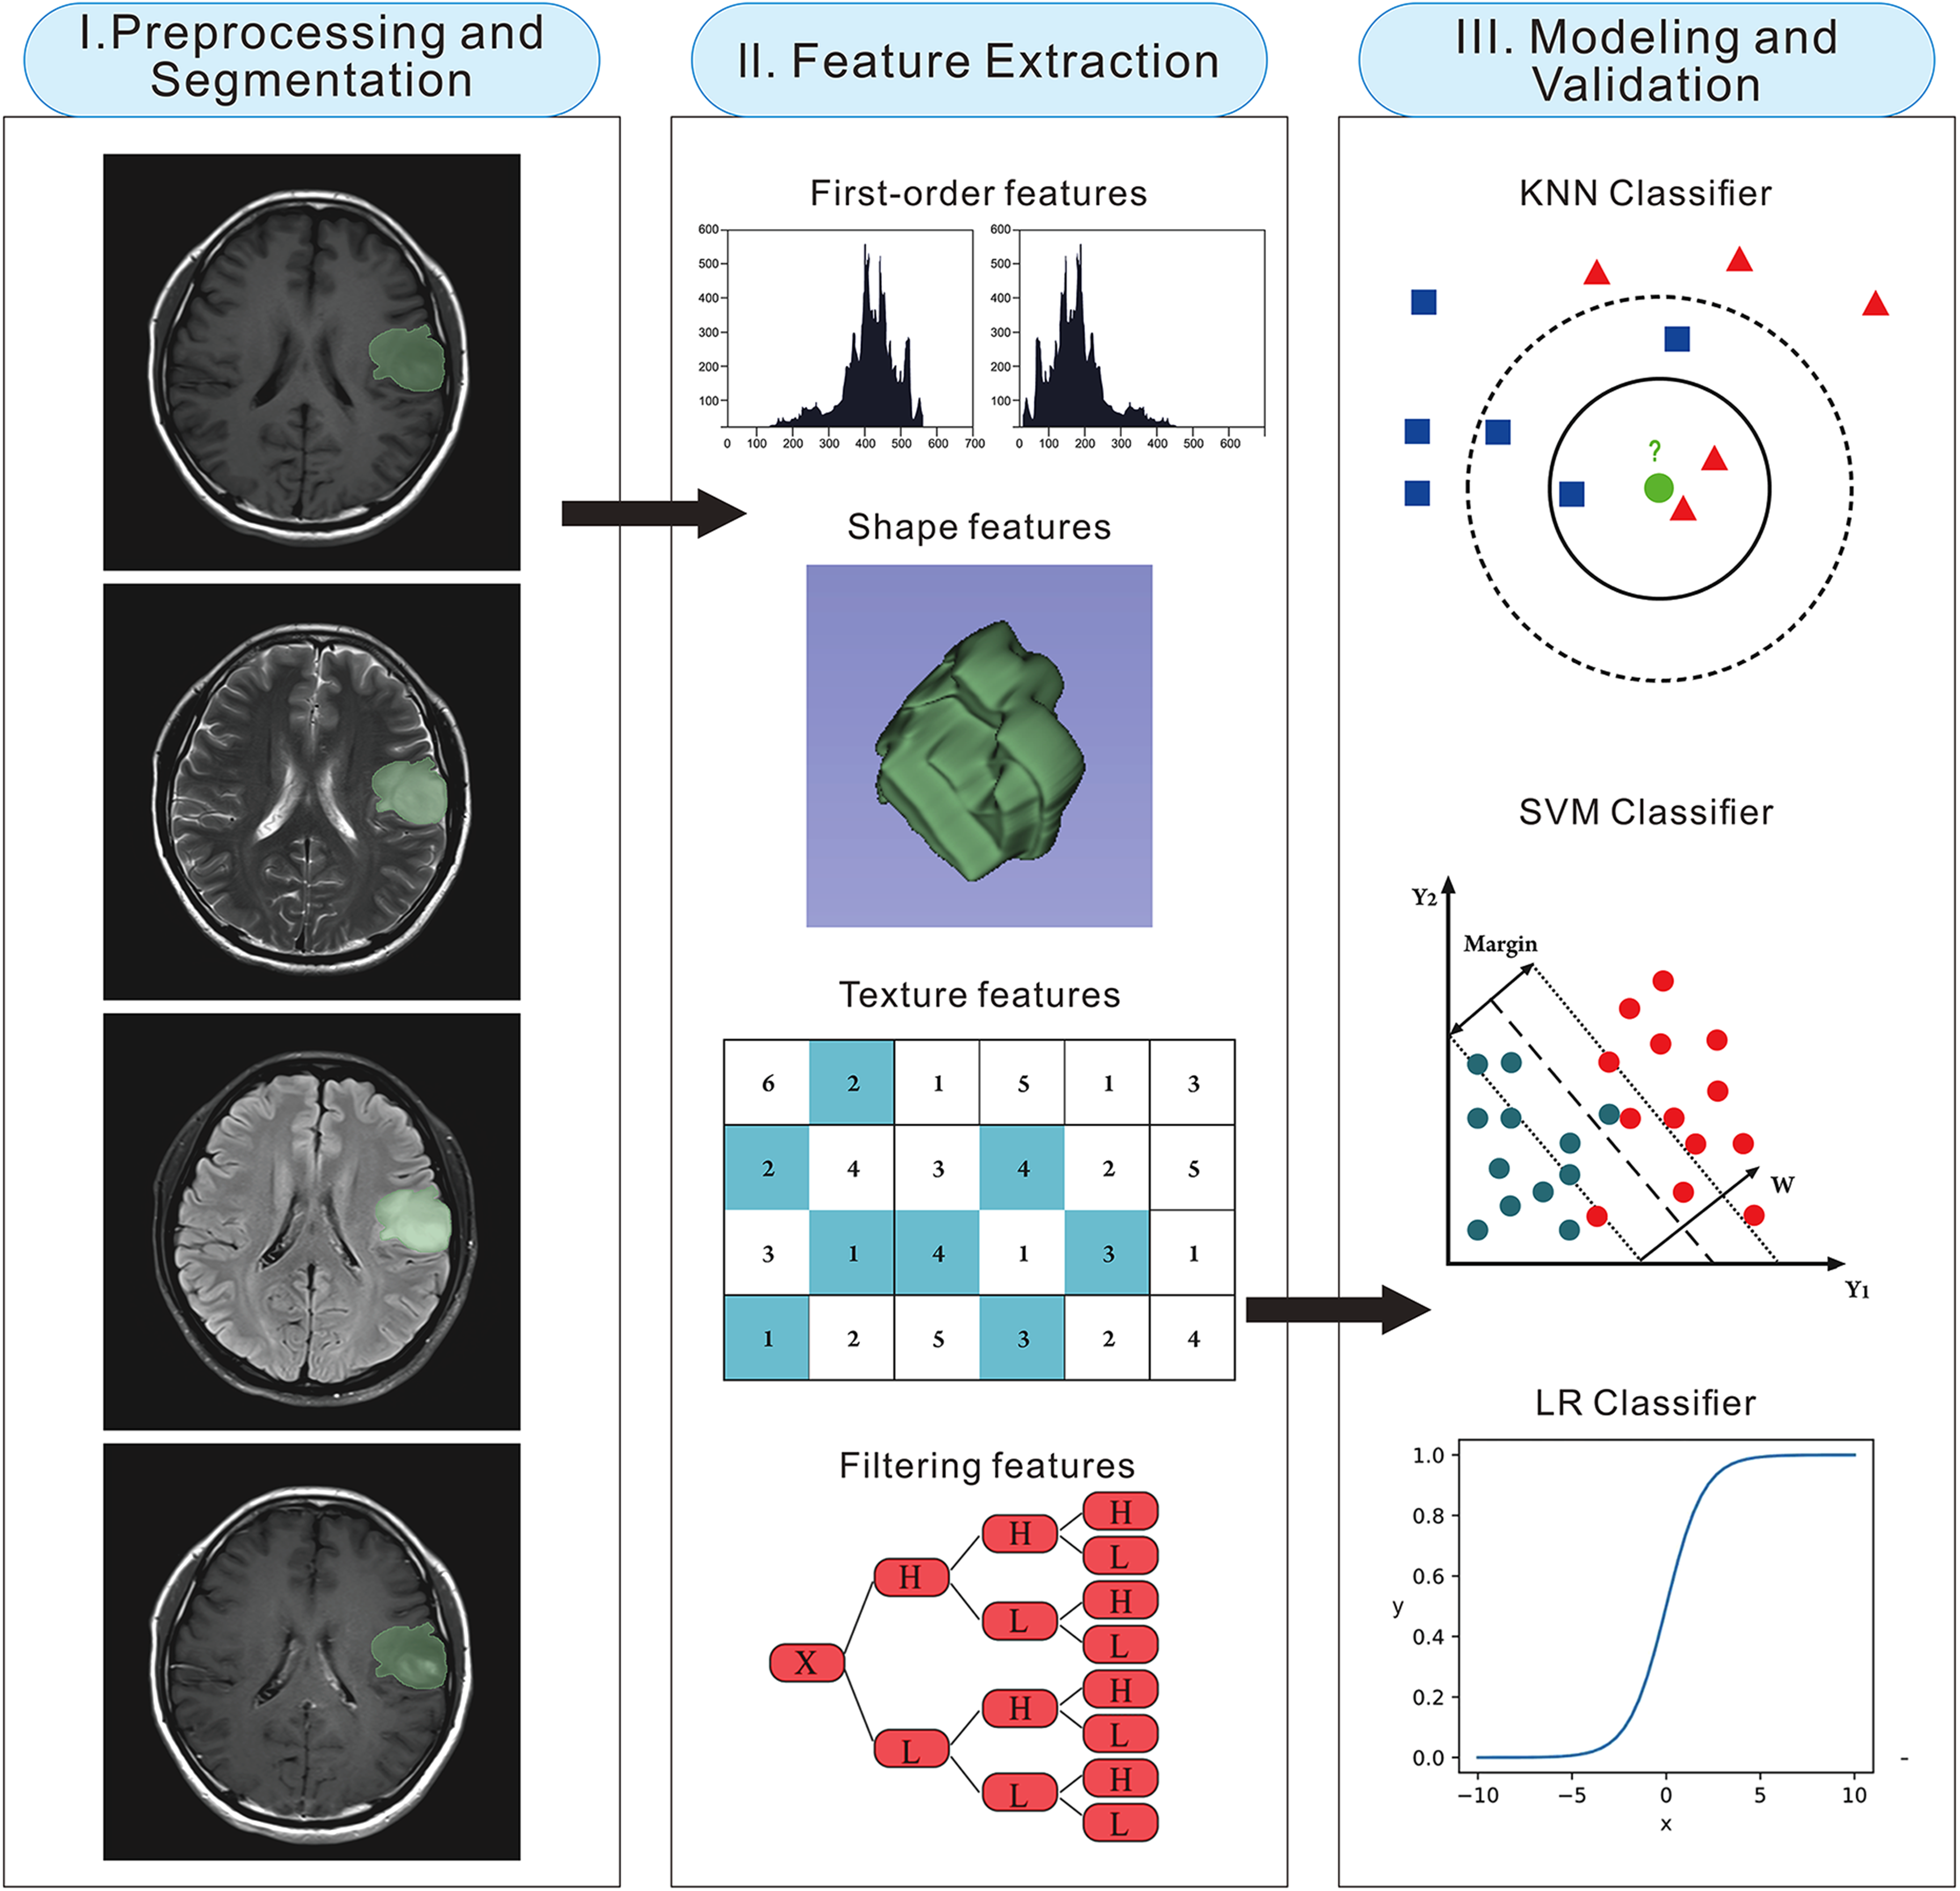
Flowchart of the present study. (I) First, image pre-processing and tumor segmentation were performed. (II) Second, radiomics features were automatically extracted. (III) Finally, the machine learning models were developed and evaluated. LR, logistic regression; KNN, K-nearest neighbour; SVM, support vector machine.
Image acquisition, pre-processing and tumor segmentation
All MR images were acquired with 3T scanners including Magnetom Prisma (Siemens Healthineers AG, Erlangen, Germany), Magnetom Verio (Siemens Healthineers AG) and Discovery 750 (GE Medical Systems, Milwaukee, WI, USA). The acquisition parameters of T1-weighted imaging were: repetition time (TR), 1900–2400 ms, echo time (TE), 8.6–19.8 ms, slice thickness, 5 mm, matrix, 512 × 512. The acquisition parameters of T2-weighted imaging were: TR, 4500–9800 ms, TE, 8.6–113.4 ms, slice thickness, 5 mm, matrix, 512 × 512. The acquisition parameters of the fluid attenuated inversion recovery (FLAIR) sequence were: TR, 6800–8000 ms, echo time, 81–146 ms, slice thickness, 5 mm, matrix, 512 × 512. The acquisition parameters of CET1 were: TR, 1900–2400 ms, TE: 8.6–19.8 ms, slice thickness, 5 mm, matrix, 512 × 512. In the above four sequences, the slice gap was 1 mm. Gadolinium-ethoxybenzyl-diethylenetriamine pentaacetic acid (dose: 0.1 mmol/kg) was used as contrast agent for contrast enhancement imaging. Because different scanners and acquisition parameters were used in this retrospective study, we applied two preprocessing methods to eliminate the confounding effects and improved the reproducibility and repeatability of the radiomics features. All images were preprocessed with N4ITK bias field correction, and then all voxels were resampled to 1 × 1 × 1 mm (13,14). These preprocessing steps were performed using 3Dslicer software, version 4.11.20210226 (https://www.slicer.org) before tumor segmentation. Detailed descriptions of the pre-processing methods are shown in supplemental Material S1.
The segmentation process of all images was performed by a neuro-radiologist with more than 5 years of experience using 3Dslicer. According to the Brain Tumor Image Segmentation Benchmark (BRATS), the region of interest (ROI) was delineated as all tumor structures including edema, enhancing core, non-enhancing core and the necrotic/cystic core (15,16). The three-dimensional ROIs were manually delineated slice-by-slice on FLAIR images by the neuroradiologist. Subsequently, the ROIs delineated on FLAIR were registered to the T1-weighted imaging, T2-weighted imaging and CET1 sequences and reviewed by the neuroradiologist to make appropriate adjustments.
Dimensionality reduction and feature selection
The radiomics features in our research were extracted using Pyradiomics library (http://pyradiomics.readthedocs.io). In total, 4520 features including shape, first-order, texture, wavelet and Laplacian of Gaussian (LoG) were extracted from four sequences. The detailed description of the extracted radiomics features is provided in supplemental Material S2. Thirty cases were randomly selected and the tumor segmentation and feature extraction process was repeated by another neuroradiologist with 10 years of experience. Interclass correlation coefficients (ICC) were calculated between the features extracted by the two neuro-radiologists and ICC ≥ 0.75 was considered as the cutoff point to select features with good reproducibility. The feature selection process was performed in the training group. Before feature selection, the radiomics features were normalized by Z-score to eliminate the different dimensionality of the features. Z-score normalization subjected all features to follow a distribution with a mean of 0 and SD of 1. Then, the feature selection was carried out in three steps. First, an independent sample t-test or Mann–Whitney U-test was performed on all features according to the distribution to select potentially important features as the primary cohort. Second, the Spearman correlation coefficients of the features were calculated to screen out the features with potential collinearity. When the correlation coefficient of a pair of features was greater than 0.9, it was considered as serious collinearity, and one of them would be excluded. Finally, four classical feature selection algorithms including distance correlation (DC), gradient boosted decision tree (GBDT), least absolute shrinkage and selection operator (LASSO) and minimal redundancy maximal relevance (MRMR) were used to establish the optimal feature sets respectively.
Construction and evaluation of the machine learning models
Six machine learning algorithms including support vector machine (SVM), linear discriminant analysis (LDA), neural network (NN), logistic regression (LR), K-nearest neighbour (KNN) and decision tree (DT) were used to establish the classification models in the training group. Combined with four feature selection methods and six machine learning algorithms, a total of 24 classification models was established in our research. Each model was named in the form of “classifier_feature selection”. For example, SVM_DC represented an SVM classifier with features selected by DC. In the training process, 10-fold cross-validation was employed to obtain robust performance of the models. The average area under thr curve (AUC) value and relative standard deviation (RSD) of the 10-fold cross-validation were used to evaluate the performance and stability of the models. The calculation formula of RSD was:

where sdAUC and meanAUC represented the standard deviation and mean of the AUC values of the 10-fold cross-validation, respectively. Subsequently, the independent test group was used for further testing of the models. Models with AUC values greater than 0.9 and RSD values less than 1.0 in the 10-fold cross-validation was retained, and the model with the highest AUC value in the test group was defined as the optimal model. Three neuro-radiologists with 2, 5 and 10 years of experience were recruited to predict the cases in the test group, and none of them knew the true labels before making their predictions. The performance of the optimal machine learning model was compared with that of radiologists to further evaluate its potential value and clinical applicability.
Statistical analysis
The statistical analysis was carried out in Rstudio, version 3.6.0 (https://www.rstudio.com). In the analysis of clinical characteristics, for numerical variables, the Shapiro test and Bartlett test were used to test the normality and homogeneity of variance of the characteristics, respectively. An independent sample t-test or Mann–Whitney U-test was performed on the characteristics according to the distribution. A chi-squared test was used for the statistical analysis of categorical variables. P < 0.05 was considered statistically significant.
Results
Characteristics of the patients
All patients were randomly assigned to the training or test group in a ratio of 7:3. No significant differences were observed in baseline data (age, gender and the proportion of tumors) between the training and test groups (Table 1). The same data distribution between the randomly divided training and test groups suggested that the division was reasonable.
The baseline data in the training and test groups.
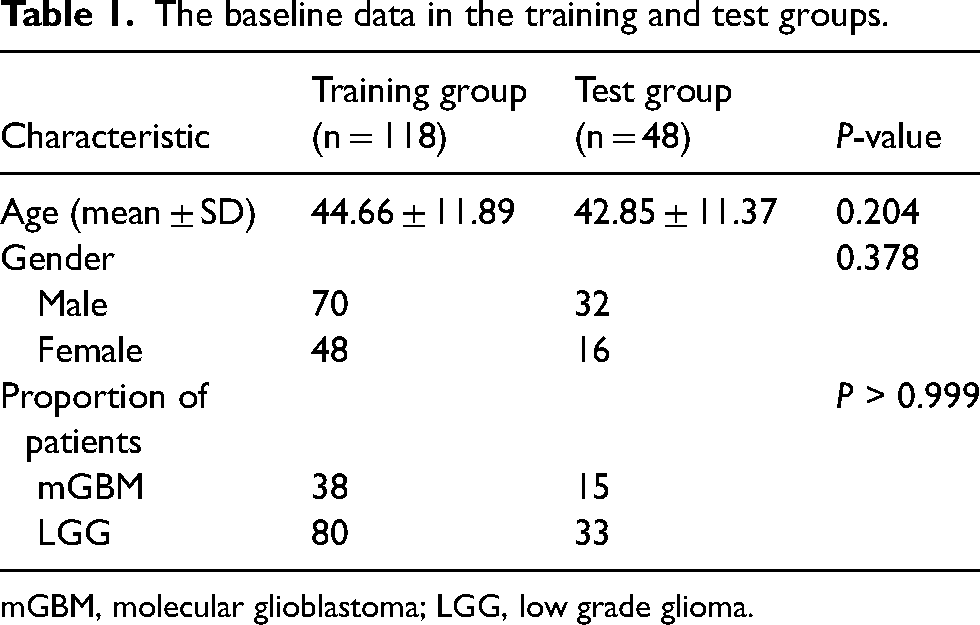
mGBM, molecular glioblastoma; LGG, low grade glioma.
Feature extraction and selection
In tota, 4520 radiomics features were extracted from the four sequences in each case. The mean and median ICC of radiomics features extracted between the two radiologists were 0.808 and 0.969, respectively. The boxplot of the ICC values for all radiomics features is shown in Fig. 2. The features we extracted including wavelet and LoG features were calculated after filtering, it may be too ideal to expect high consistency of all features. Therefore, features with ICC ≥ 0.75 were considered to be highly reproducible, and 1090 features that did not fit were excluded and 3430 features remained. After subsequent univariate and Spearman correlation analysis, only 202 robust radiomics features were left. DC calculated the distance correlation coefficient and selected the top 10 features. GBDT selected the top 10 important features through a tree model with 3-fold cross-validation. LASSO selected 11 features by adjusting the penalty coefficient lambda (λ). MRMR selected 10 features by maximizing the correlation between features and labels and minimizing the correlation between different features. The selected feature sets are shown in Table 2.
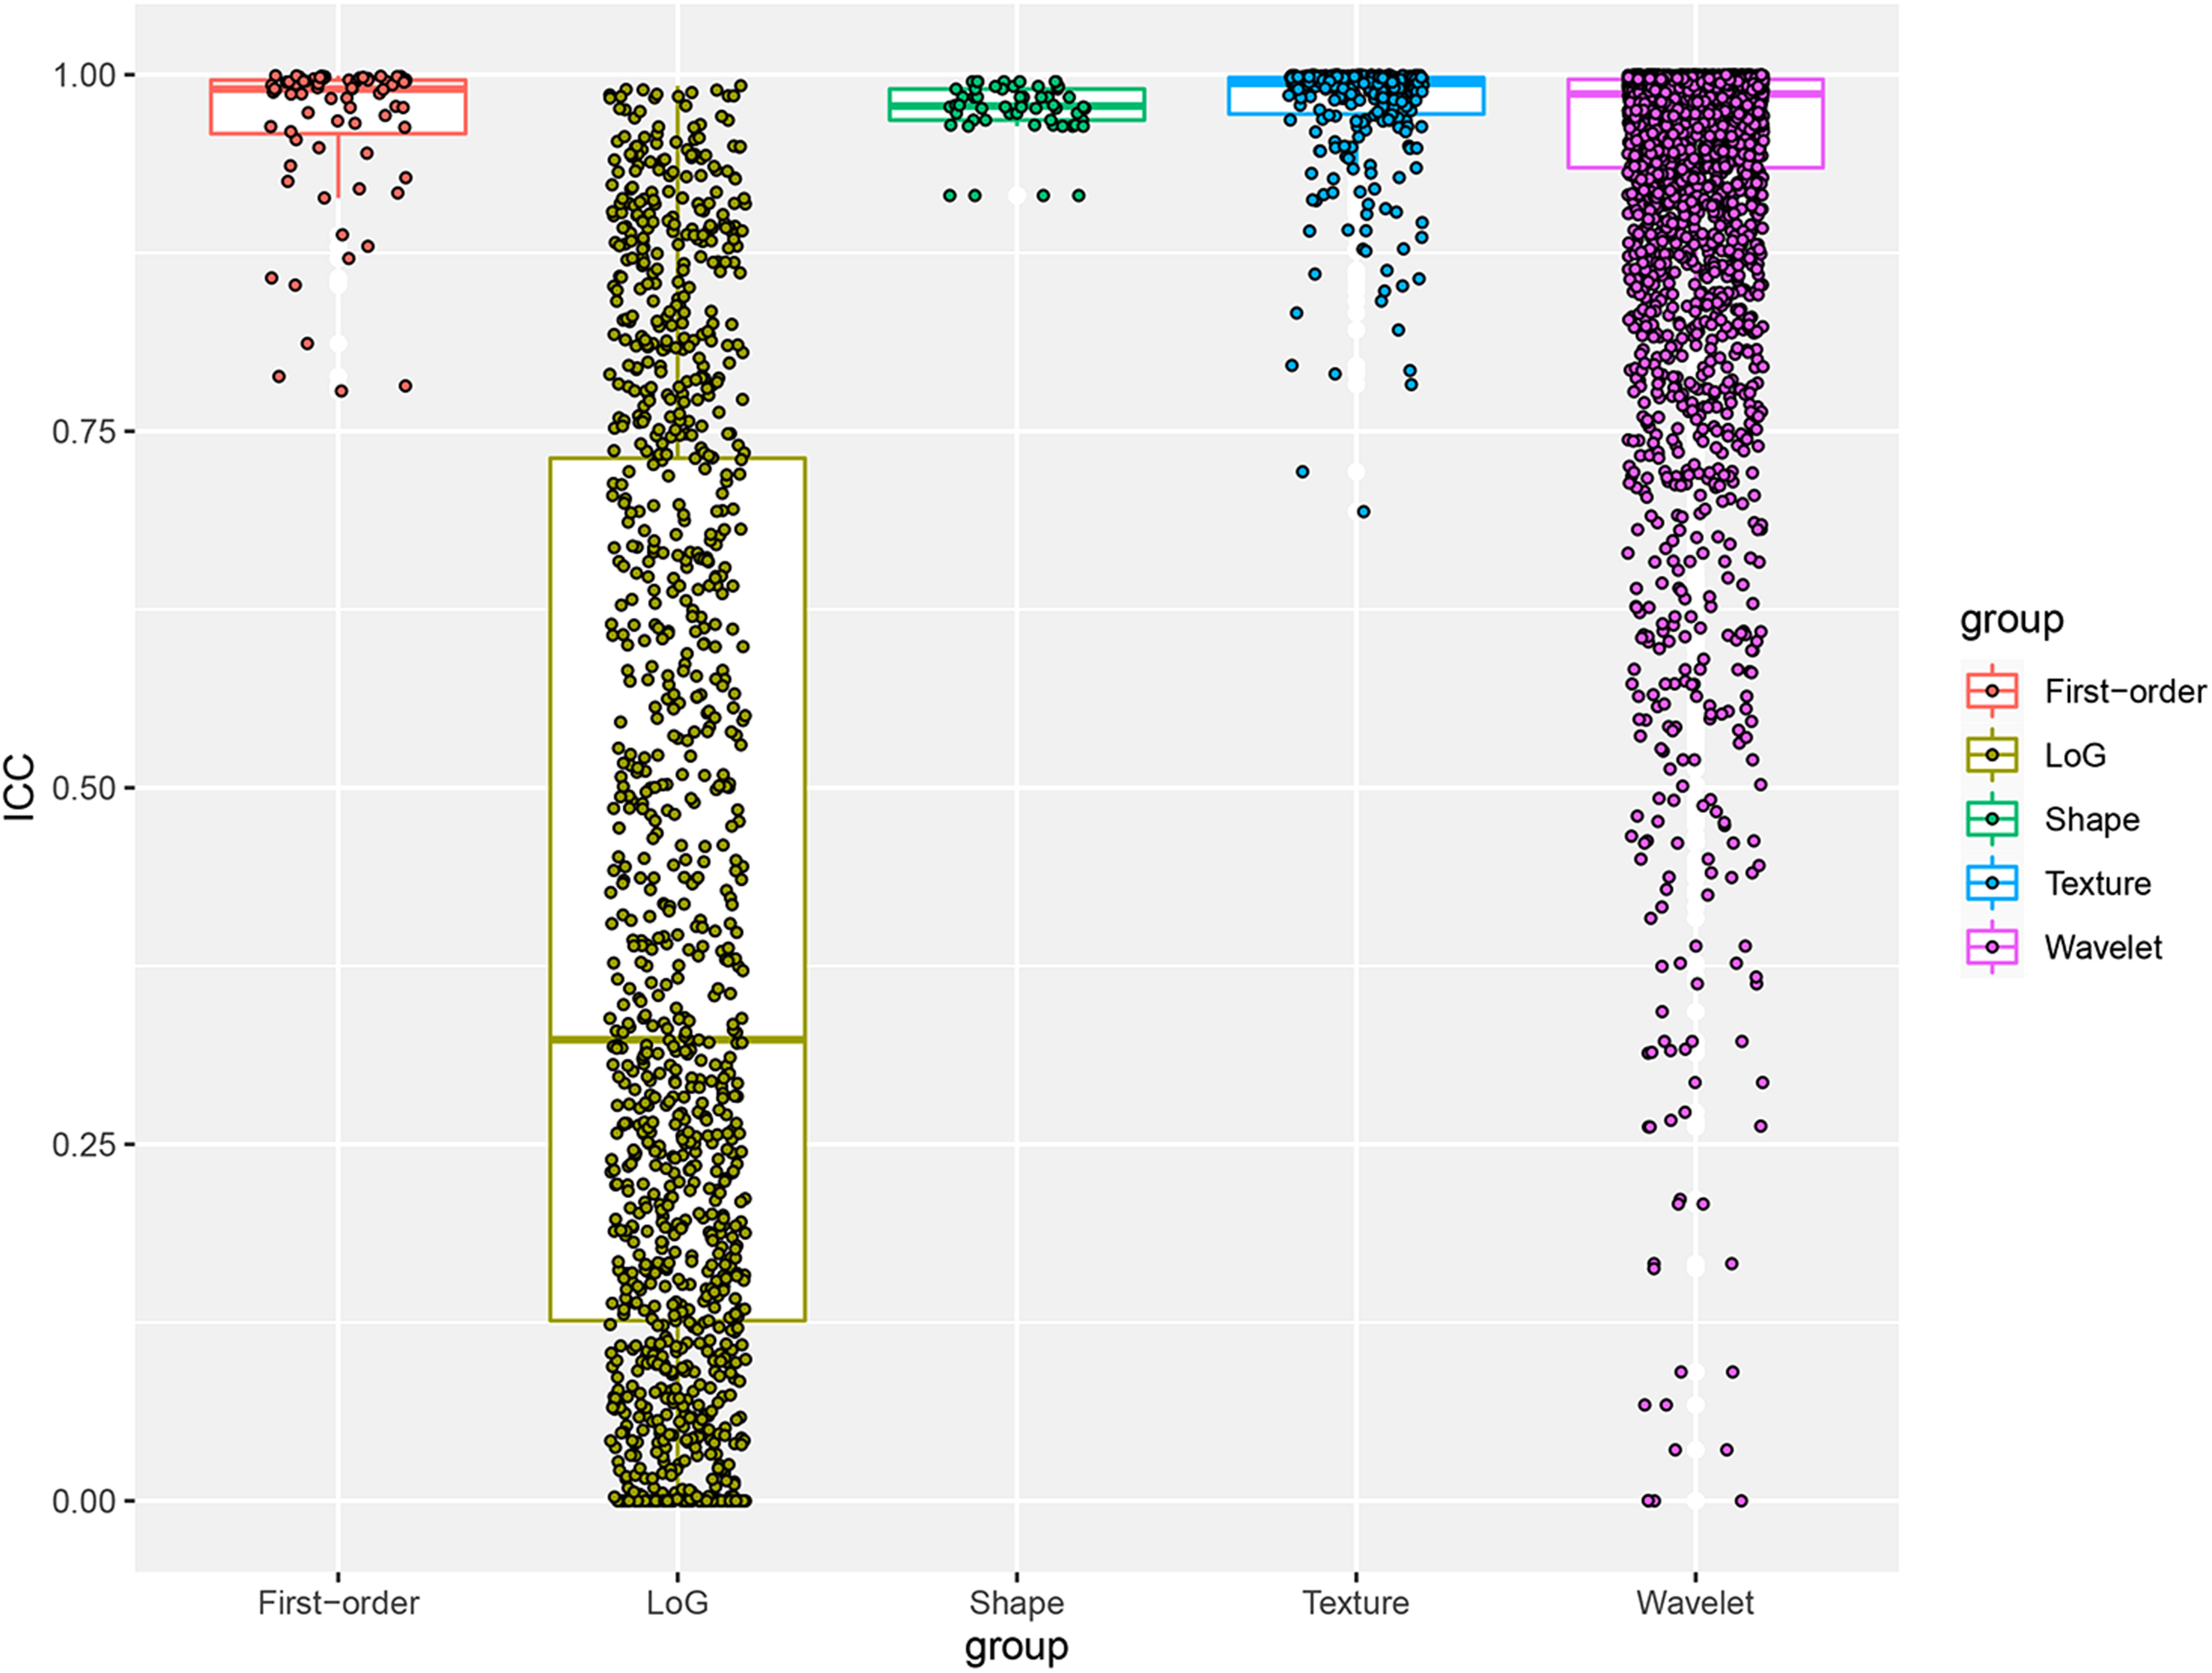
Boxplot of interclass correlation coefficients (ICC) values for five groups of radiomics features. Most of the features in the research showed good reproducibility. LoG, Laplacian of Gaussian.
The radiomics feature sets selected by four algorithms.

DC, distance correlation; GBDT, gradient boosted decision tree; LASSO, least absolute shrinkage and selection operator; MRMR, minimal redundancy maximal relevance.
Performances of the machine learning models
In total, 24 classifiers were established in our research combining four feature selection methods and six machine learning algorithms. All classifiers were trained by 10-fold cross-validation in the training group and further tested in the independent test group. The average AUC values and RSD values of 10-fold cross-validation are shown in Fig. 3. Regarding the evaluation of model performances, the NN classifiers outperformed others when using the same feature sets. Therefore, NN_DC was selected as the optimal classifier due to the highest AUC of 0.891 in the test group. We constructed the classification confusion matrix for the NN_DC model and the classification accuracy, sensitivity, specificity, positive predictive value and negative predictive value of NN_DC were 0.915, 0.842, 0.950, 0.889 and 0.927, respectively. The classification confusion matrix of NN_DC and ROC curves in the training and test groups are shown in Fig. 4. The classification performance of the NN_DC model in the test group and that of three radiologists with 2, 5 and 10 years of experience are shown in Table 3. The classification accuracy of NN_DC was significantly higher than that of radiologists with 2 years of experience. In addition, it is worth noting that the sensitivity of our model was significantly higher than that of radiologists with 2 and 5 years of experience, indicating a significant improvement in the detection rate of mGBM. A representative misdiagnosed case of mGBM is shown in Fig. 5.

The heat maps of the area under the curve (AUC) and relative standard deviation (RSD) values of the machine learning models. (a) Average AUC values of the 24 machine learning models in the training group with 10-fold cross-validation; (b) RSD values of the models in the training group with 10-fold cross-validation. DC, distance correlation; DT, decision tree; GBDT, gradient boosted decision tree; KNN, K-nearest neighbour; LASSO, least absolute shrinkage and selection operator; LDA, linear discriminant analysis; LR, logistic regression; MRMR, minimal redundancy maximal relevance; NN, neural network; SVM, support vector machine.
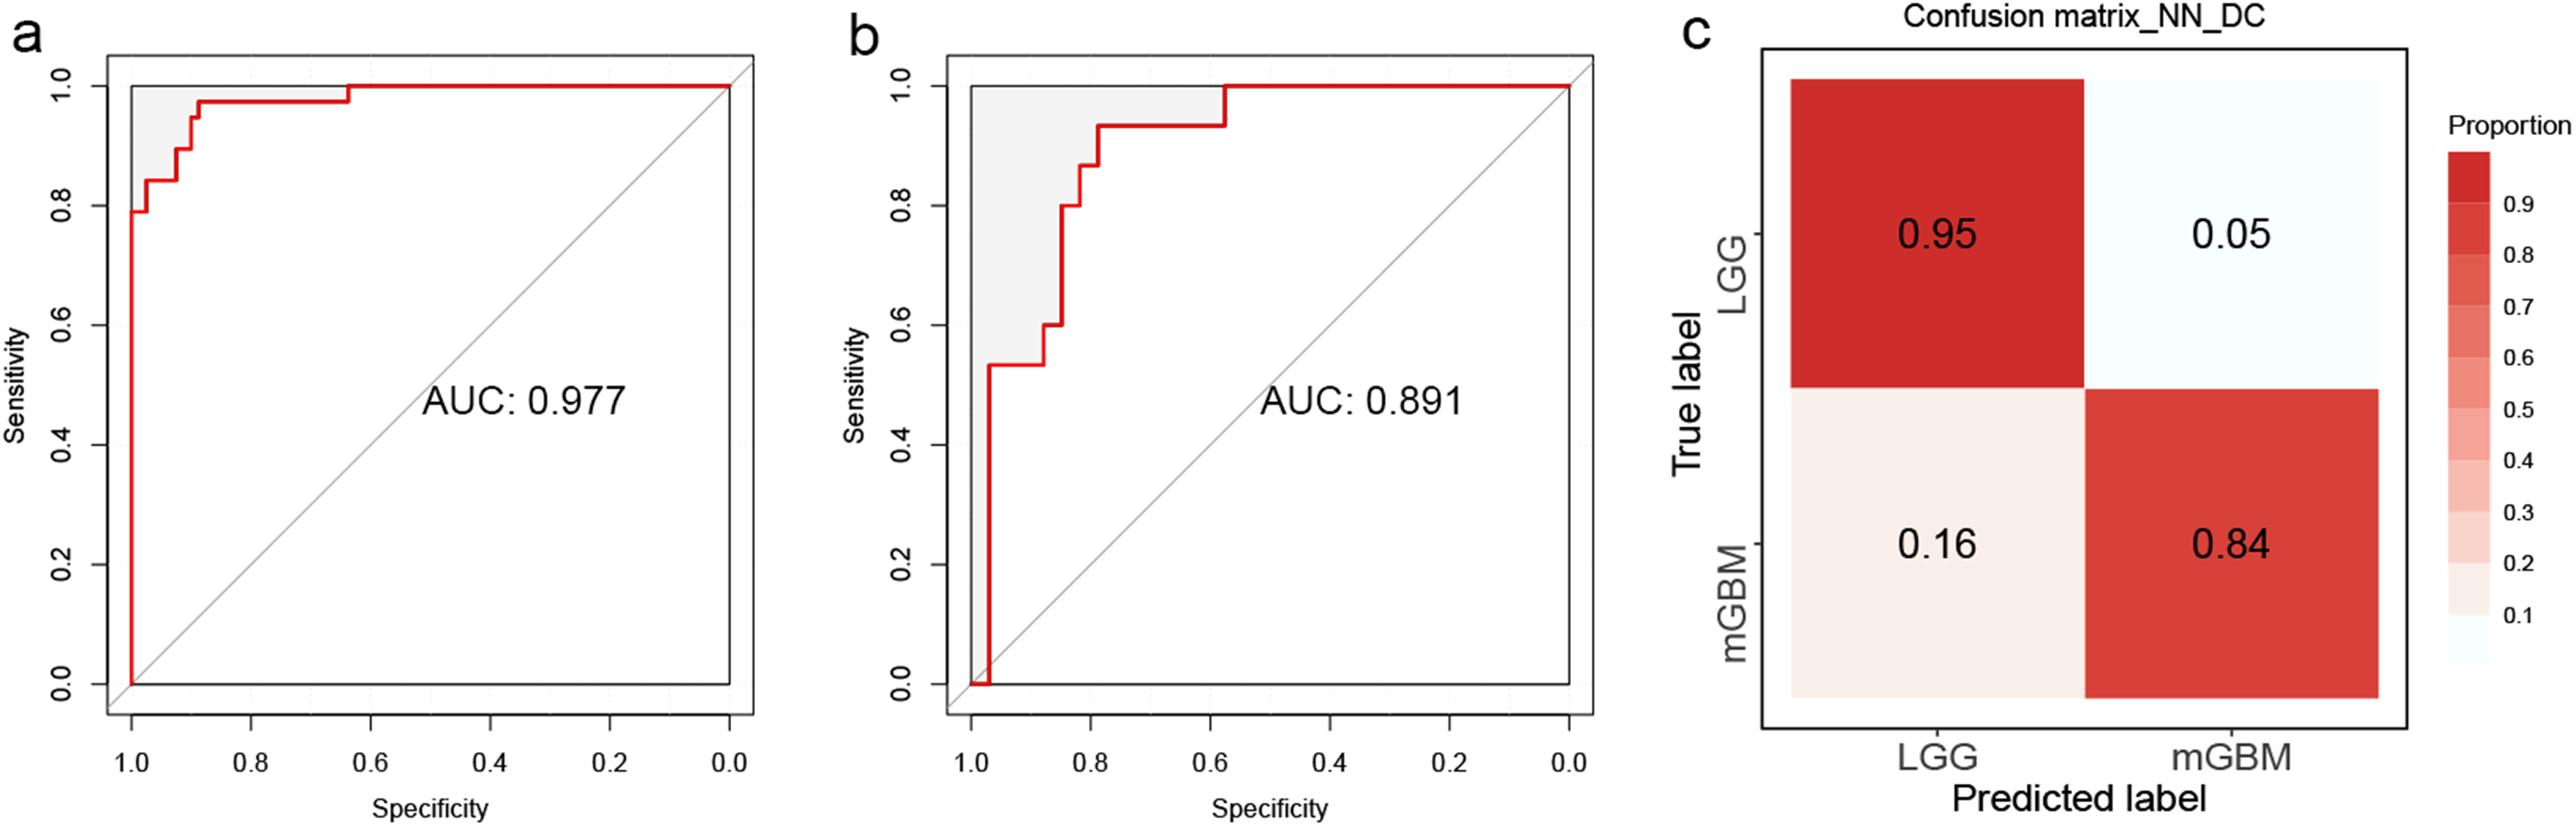
Performance of the NN_DC model. (a) The receiver operating characteristic (ROC) curve of NN_DC in the training group. (b) The ROC curve of NN_DC in the test group. (c) The classification confusion matrix of the NN_DC model. AUC, area under the curve; DC, distance correlation; LGG, low grade glioma; mGBM, molecular glioblastoma; NN, neural network.

Magnetic resonance images of a representative case. (a) T1-weighted, (b) T2-weighted, (c) fluid attenuated inversion recovery and (d–f) contrast-enhanced T1-weighted images of a 42-year-old male patient with molecular glioblastoma (mGBM). The lesions involved the right temporal lobe and hippocampus, and no significant contrast enhancement was observed. The tumor was histologically diagnosed as a World Health Organization Grade 2 astrocytoma; however, due to isocitrate dehydrogenase wild-type and the presence of telomerase reverse transcriptase promoter mutation, it would be redefined as mGBM, indicating a relatively poor prognosis and clinical outcome.
Comparison of classification performance between the NN_DC model and radiologists.
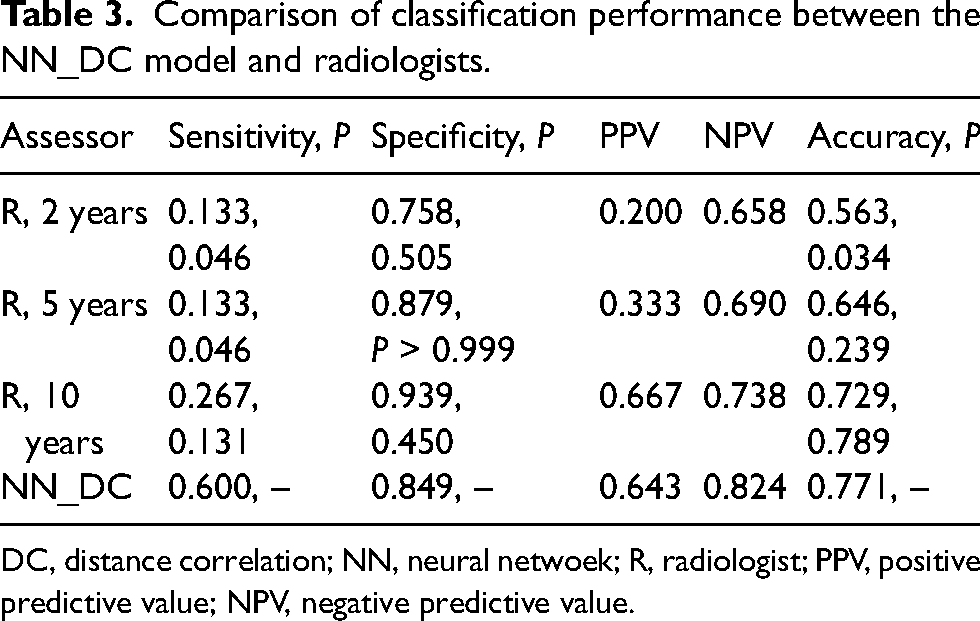
DC, distance correlation; NN, neural netwoek; R, radiologist; PPV, positive predictive value; NPV, negative predictive value.
Discussion
In clinical practice, gliomas vary greatly in their treatment options due to their wide heterogeneity. Intratumoral heterogeneity has been challenging the prognosis and treatment of glioma patients. Standard treatment for glioblastoma consists of maximal tumor resection followed by temozolomide chemotherapy and stereotactic radiation therapy (17,18). However, there is still some controversy about the management of LGG. LGG is generally considered inert and with longer survival and better prognosis. Furthermore, given the prevalence in younger adults and the frequent involvement of important functional areas, the perspective that the adverse effects of early intervention outweigh the benefits to patients has led some neurosurgeons and patients to prefer expectant treatment and imaging-based surveillance policies. However, some LGG will rapidly evolve into glioblastoma after the first diagnosis (19). This phenomenon now is well explained with the inclusion of molecular markers in the new CNS classification guidelines. These active tumor entities may represent the early stages of glioblastoma and, although no corresponding histopathological signs have been observed, the tumor cells have shown epigenetic and molecular features of glioblastoma (2,20). Accurate diagnosis of the molecular glioblastoma is essential for personalized healthcare and will help improve clinical outcomes.
Conventional MRI is powerless for the identification of tumor histology and molecular information. GBM has traditionally been considered to have a distinctive wreath-like pattern of enhancement. This contrast enhancement was attributed to increased microvascular proliferation and blood–brain barrier permeability, resulting in increased extravasation of gadolinium into the lesion (21,22). Indeed, the specificity of this enhancement pattern is inadequate in clinical practice. In a recent study with a large sample, approximately 8.1% of glioblastomas were shown to be non-enhancing and were more likely to be observed in the elderly (23). In addition, contrast enhancement was observed in approximately half of the LGGs (24). Conventional imaging diagnosis is also highly dependent on the working experience and subjective judgment of the radiologists. Radiomics aims to establish a correspondence between histology and genomics by extracting high-throughput features from conventional images, and is expected to become a bridge between medical images and individualized treatment in the future. In the present study, we developed multiple classifiers by combining various feature selection methods and machine learning algorithms and evaluated their performance and stability to determine the best classifier. The classifiers were designed to help the development and implementation of individualized treatment for patients with gliomas by identifying mGBM at an early stage.
The optimal classifier NN_DC achieved an excellent performance of AUC of 0.891 and classification accuracy of 0.771 in the independent test group, which may provide a new and robust tool for the non-invasive prediction of mGBM in clinical practice in the future. NN is a machine learning algorithm that simulates the structure and function of the biological neural network, which can make adaptive adjustments based on external information. The NN model used in the present study iteratively adjusted the weights of the hidden layers by a back-propagation algorithm to achieve optimal performance (25). As a common and accessible algorithm, NN has been widely used in the non-invasive prediction of central nervous system tumors and achieved excellent performance. Kitajima et al. (26) developed a neural network model for identifying among several common sellar region lesions, including pituitary adenoma, craniopharyngioma and Rathke cleft cyst, achieving impressive performance with an AUC of 0.990. Furthermore, the model they developed demonstrated significantly better performance compared to that of general radiologist (P = 0.0083), showing promising clinical application prospects (26). In another study on preoperative prediction of histological grades of the meningioma, Hale et al. established multiple machine learning models, including neural network, KNN, SVM, naïve Bayes and LR, and compared their performances. The results of their research indicated that the neural network achieved the best classification performance with an AUC value of 0.8895 (27).
In the present study, 10 important radiomics features were incorporated into the NN_DC model based on distance correlation coefficients. Given the excellent operability and applicability, DC has been widely used for dimensionality reduction of radiomics features (28,29). In the present study, DC selected two first-order features, which are “energy” originating from T1 and T2 sequences, respectively. First-order features, also known as histogram features, directly describe the distribution of voxel intensities within the image region defined by the mask through commonly used and basic metrics. In the study by Xue et al. (30), first-order features were found to effectively reflect tumor heterogeneity, and CET1 first-order features were feasible predictors of tumor-infiltrating CD8+ T cell levels in patients with GBM. Furthermore, the study by Kandemirli et al. (31) indicated that first-order radiomics-derived features can effectively predict the invasion status of meningiomas in the brain. The remaining eight features selected were all gray level co-generation matrix (GLCM) derived features. As the most popular texture features for measuring image heterogeneity, GLCM not only reflects the distribution of gray levels, but also reveals the second-order information of the adjacency relationship between voxels and surrounding voxels (32,33). He et al. (34) developed machine learning models based on multisequence MRI radiomics features and optimized the full radiomics processing pipeline to non-invasively predict the IDH mutation status of gliomas. The optimal model in their study achieved a superior performance with an AUC of 0.873 in the test group, and GLCM features were also confirmed to be of high importance (34). Although the specific biological significance of these high-dimensional data remains to be further explored, this application of computed abstract features to objectively reveal tumor heterogeneity will be a trend in the future of imaging.
Although different scanners were used in the present study, the N4ITK algorithm was applied to eliminate the impact of magnetic field inhomogeneity. As a non-parametric non-uniform intensity normalization algorithm published by the National Institutes of Health (NIH), N4ITK does not require pre-setting tissue signal intensity levels and has been widely used in the field of radiomics (35,36). Additionally, the voxels of all images were resampled to 1 × 1 × 1 mm to improve the robustness and reproducibility of radiomics features. Resampling is commonly performed to standardize the voxel size of the database with a unique voxel resolution and to correct for the differences of the scanner, pixel size and slice thickness within single or multicenter cohort studies (14,37). Previous studies have shown that resampling to isometric voxels increased the number of robust features when images were acquired with different parameters (38).
There are still some limitations to the present study. First, as a single-center study, we could not fully simulate the epidemiological distribution of tumors due to the the limited number of patients and the imbalanced distribution of tumor subtypes, which may limit the applicability of the results to some extent. Therefore, large prospective multi-institutional cohort studies with greater statistical power are urgently needed to validate the results of our study. Second, different MRI scanners and acquisition parameters were used in this retrospective study. Although all images have been preprocessed, the effectiveness of the pre-processing still needs further validation with external datasets. Finally, although radiomics have been widely used in the studies of a variety of lesions, the biological connotation of some radiomics features still needs to be revealed further.
In conclusion, the present study developed 24 machine learning models based on MRI radiomics to predict mGBM and evaluated their performances. Machine learning allows non-invasive prediction of mGBM, which may be helpful for individualized treatment of patients and accurate stratification of clinical trials.
Supplemental Material
sj-docx-1-acr-10.1177_02841851231199744 - Supplemental material for Machine learning models based on multi-parameter MRI radiomics for prediction of molecular glioblastoma: a new study based on the 2021 World Health Organization classification
Supplemental material, sj-docx-1-acr-10.1177_02841851231199744 for Machine learning models based on multi-parameter MRI radiomics for prediction of molecular glioblastoma: a new study based on the 2021 World Health Organization classification by Xin Kong, Yu Mao, Yuqi Luo, Fengjun Xi, Yan Li and Jun Ma in Acta Radiologica
Footnotes
Data availability
The data that support the findings of this study are available from the corresponding author upon reasonable request.
Declaration of conflicting interests
The authors declared no potential conflicts of interest with respect to the research, authorship, and/or publication of this article.
Ethics approval
The study was conducted in accordance with the Declaration of Helsinki and approved by the Institutional Review Board of Beijing Tiantan Hospital (number: KY2022-214-03) and the need for informed consent was waived.
Funding
The authors received no financial support for the research, authorship, and/or publication of this article.

Supplemental material
Supplemental material for this article is available online.
References
Supplementary Material
Please find the following supplemental material available below.
For Open Access articles published under a Creative Commons License, all supplemental material carries the same license as the article it is associated with.
For non-Open Access articles published, all supplemental material carries a non-exclusive license, and permission requests for re-use of supplemental material or any part of supplemental material shall be sent directly to the copyright owner as specified in the copyright notice associated with the article.
