



Abstract
Background
Current liver magnetic resonance elastography (MRE) scans often require adjustments to driver amplitude to produce acceptable images. This could lead to time wastage and the potential loss of an opportunity to capture a high-quality image.
Purpose
To construct a linear regression model of individualized driver amplitude to improve liver MRE image quality.
Material and Methods
Data from 95 liver MRE scans of 61 participants, including abdominal missing volume ratio (AMVR), breath-holding status, the distance from the passive driver on the skin surface to the liver edge (Dd−l), body mass index (BMI), and lateral deflection of the passive driver with respect to the human sagittal plane (Angle α), were continuously collected. The Spearman correlation analysis and lasso regression were conducted to screen the independent variables. Multiple linear regression equations were developed to determine the optimal amplitude prediction model.
Results
The optimal formula for linear regression models: driver amplitude (%) = −16.80 + 78.59 × AMVR − 11.12 × breath-holding (end of expiration = 1, end of inspiration = 0) + 3.16 × Dd−l + 1.94 × BMI + 0.34 × angle α, with the model passing the F test (F = 22.455, P <0.001) and R2 value of 0.558.
Conclusion
The individualized amplitude prediction model based on AMVR, breath-holding status, Dd−l, BMI, and angle α is a valuable tool in liver MRE examination.
Introduction
Magnetic resonance elastography (MRE) of the liver is an imaging technique used to detect liver stiffness in the evaluation of suspected fibrosis or cirrhosis. Measurement of hepatic stiffness can help predict the stage of liver fibrosis (1,2). For an accurate assessment of liver disease, high-quality MRE images are required. These images display regular shear waves crossing through the liver, resulting in the highest percent liver measurable volume (pMLV) (3) and lowest abdominal missing volume ratio (AMVR). However, in practice, the factors that impact shear waves are typically complex. These include physiological features, obesity, breath-holding status, and passive driver location. To date, relevant studies (4,5) only advocate performing MRE trial scans by modifying the driver amplitude based on the participant's body weight or body mass index (BMI) until high-quality MRE images are acquired (5,6). Thus, we collected the participants’ physiological characteristics, MRE technical parameters, and MRE quality control indicators before developing an optimal linear regression model with driver amplitude as the dependent variable to achieve individualized amplitude for improving MRE image quality and examination efficiency.
Material and Methods
Research participants
This study was approved by the ethics committee of the First Hospital of Lanzhou University. This is a retrospective study; all patient information was deidentified and patient consent was not required. We continuously collected data from participants who underwent 3.0-T liver 2D-SE-EPI-MRE in the radiology department of the First Hospital of Lanzhou University between January 2021 and December 2022.
The inclusion criteria were as follows: patients with liver mass, with or without chronic liver disease.
The exclusion criteria consisted of the following: (i) magnetic resonance imaging (MRI) with conventional contraindications; (ii) substantial ascites; (iii) BMI >35 kg/m2; (iv) diffuse liver space-occupying lesions or solitary liver tumor with a longitudinal diameter >3 cm; and (v) absence of shear waves (7). Participants were fasted for 4–6 h.
Information regarding the 95 liver MRE scans was collected from 61 consecutive participants (40 men, 21 women). Of these scans, 65 liver MRE scans were conducted with breath-holding at the end of expiration and 30 scans were conducted with breath-holding at the end of inspiration. Liver fibrosis status, based on the mean stiffness of whole liver (MSWL) (5), was as follows: 22 participants were in stage F0; 10 participants were in stage F1–2; six participants were in stage F2–3; nine participants were in stage F3–4; and 14 participants were in stage F4 or had cirrhosis. Additional baseline data are presented in Table 1.
Participants baseline description and test results for normality and homoscedasticity.
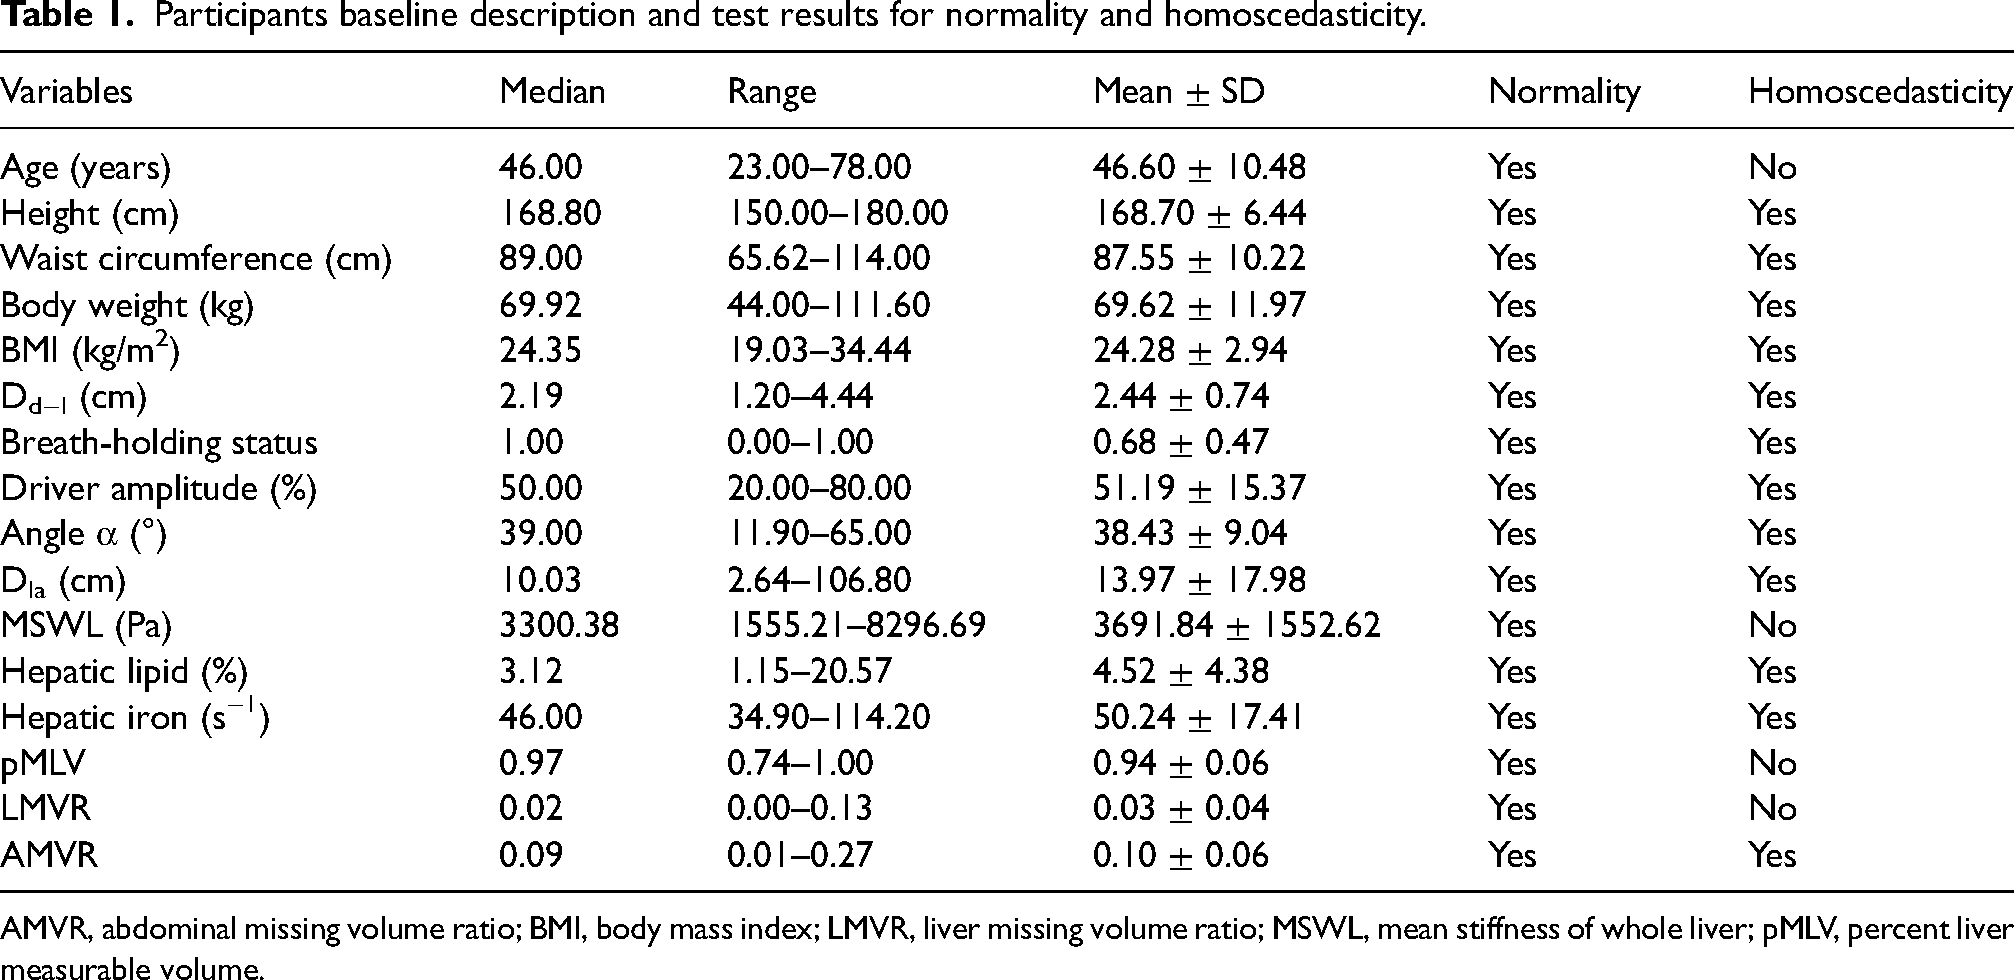
AMVR, abdominal missing volume ratio; BMI, body mass index; LMVR, liver missing volume ratio; MSWL, mean stiffness of whole liver; pMLV, percent liver measurable volume.
MRE equipment and technical parameters
Participants underwent MR elastography while in a supine position. A 19-cm drum driver was placed near the right liver lobe. An elastic band fastened the passive driver to the body, and a 7.6-m flexible vinyl chloride tube with a 1.9-cm inner diameter connected it to an MRE active driver system (WK810-B; Resoundant, Rochester, MN, USA). 3.0-T MRI equipment (SIGNA Architect; GE, Boston, MA, USA) with a 70-cm bore and 16-channel torso radiofrequency coil array was used. The MRE parameters were as follows: mechanical frequency = 60 Hz; sequence = 2D-SE-EPI-MRE (MR TOUCH); TR/TE = 1000.32/59.5 ms; field of view (FOV) = 30–42 cm; slice thickness = 7 mm; breath-hold = 11–16 s; driver amplitude setting (5) = <57 kg or BMI <20 kg/m2 = 30% (20%–40%), 57–75 kg or BMI = 20–25 kg/m2 = 40% (30%–50%), >75 kg or BMI >25 kg/m2 = 60% (50%–80%). The MR technician, following the assessment method recommended by Pepin (5), determined whether driver amplitude adjustments were necessary by observing the phase diagram and elastogram with a 95% confidence map. When adjustments were deemed necessary, the technician attempted to finetune the initial amplitude either upward or downward by 5%–10%, while closely monitoring the resulting changes in image quality. If the participants were cooperative and willing to continue, the technician even explored amplitude variations within the range of 10%–30%, striving to obtain sufficient image quality information within a limited time frame (17 min) to establish an individualized amplitude model.
A multi-model direct inversion algorithm (Mayo Clinic, Rochester, MN, USA) autonomously analyzed waveform diagrams on the imaging equipment to generate four-layer elastograms showing liver stiffness distribution and 95% confidence maps. Breath-holding training, parameter modification, and scan for liver MRE took 123.00 s (range 101.00–166.75 s).
Two radiologists (with 12 and 7 years of experience, respectively) defined the regions of interest (ROIs) for pMLV, liver missing volume ratio (LMVR), AMVR, MSWL, hepatic lipid, and hepatic iron on four-layer elastograms with the 95% confidence map. In addition, lateral deflection of the passive driver with respect to the human sagittal plane (angle α), lateral displacement distance (Dla), and the distance from the passive driver on the skin surface to the liver edge (Dd−l) were measured using T1-weighted imaging by the two readers. The clinical history was unknown to the readers. The data from the two readers were archived for intraclass correlation coefficient (ICC) analysis.
Measurement of liver MRE quality control indicators
We reviewed DICOM images and created a database using Radiant DICOM Viewer software (version 2021.2.2; Medixant, Poznan, Poland). Using a 3D vernier and liver anatomy data from the fusion image (elastogram with the 95% confidence map + magnitude diagram), the image ROI was precisely identified (avoiding the gallbladder fossa, the 1-cm area under the liver capsule, and the main vessel structures). The calculation formula and measurement diagram of pMLV, LMVR, AMVR, angle α, Dla, and Dd−l are as follows (Fig. 1):

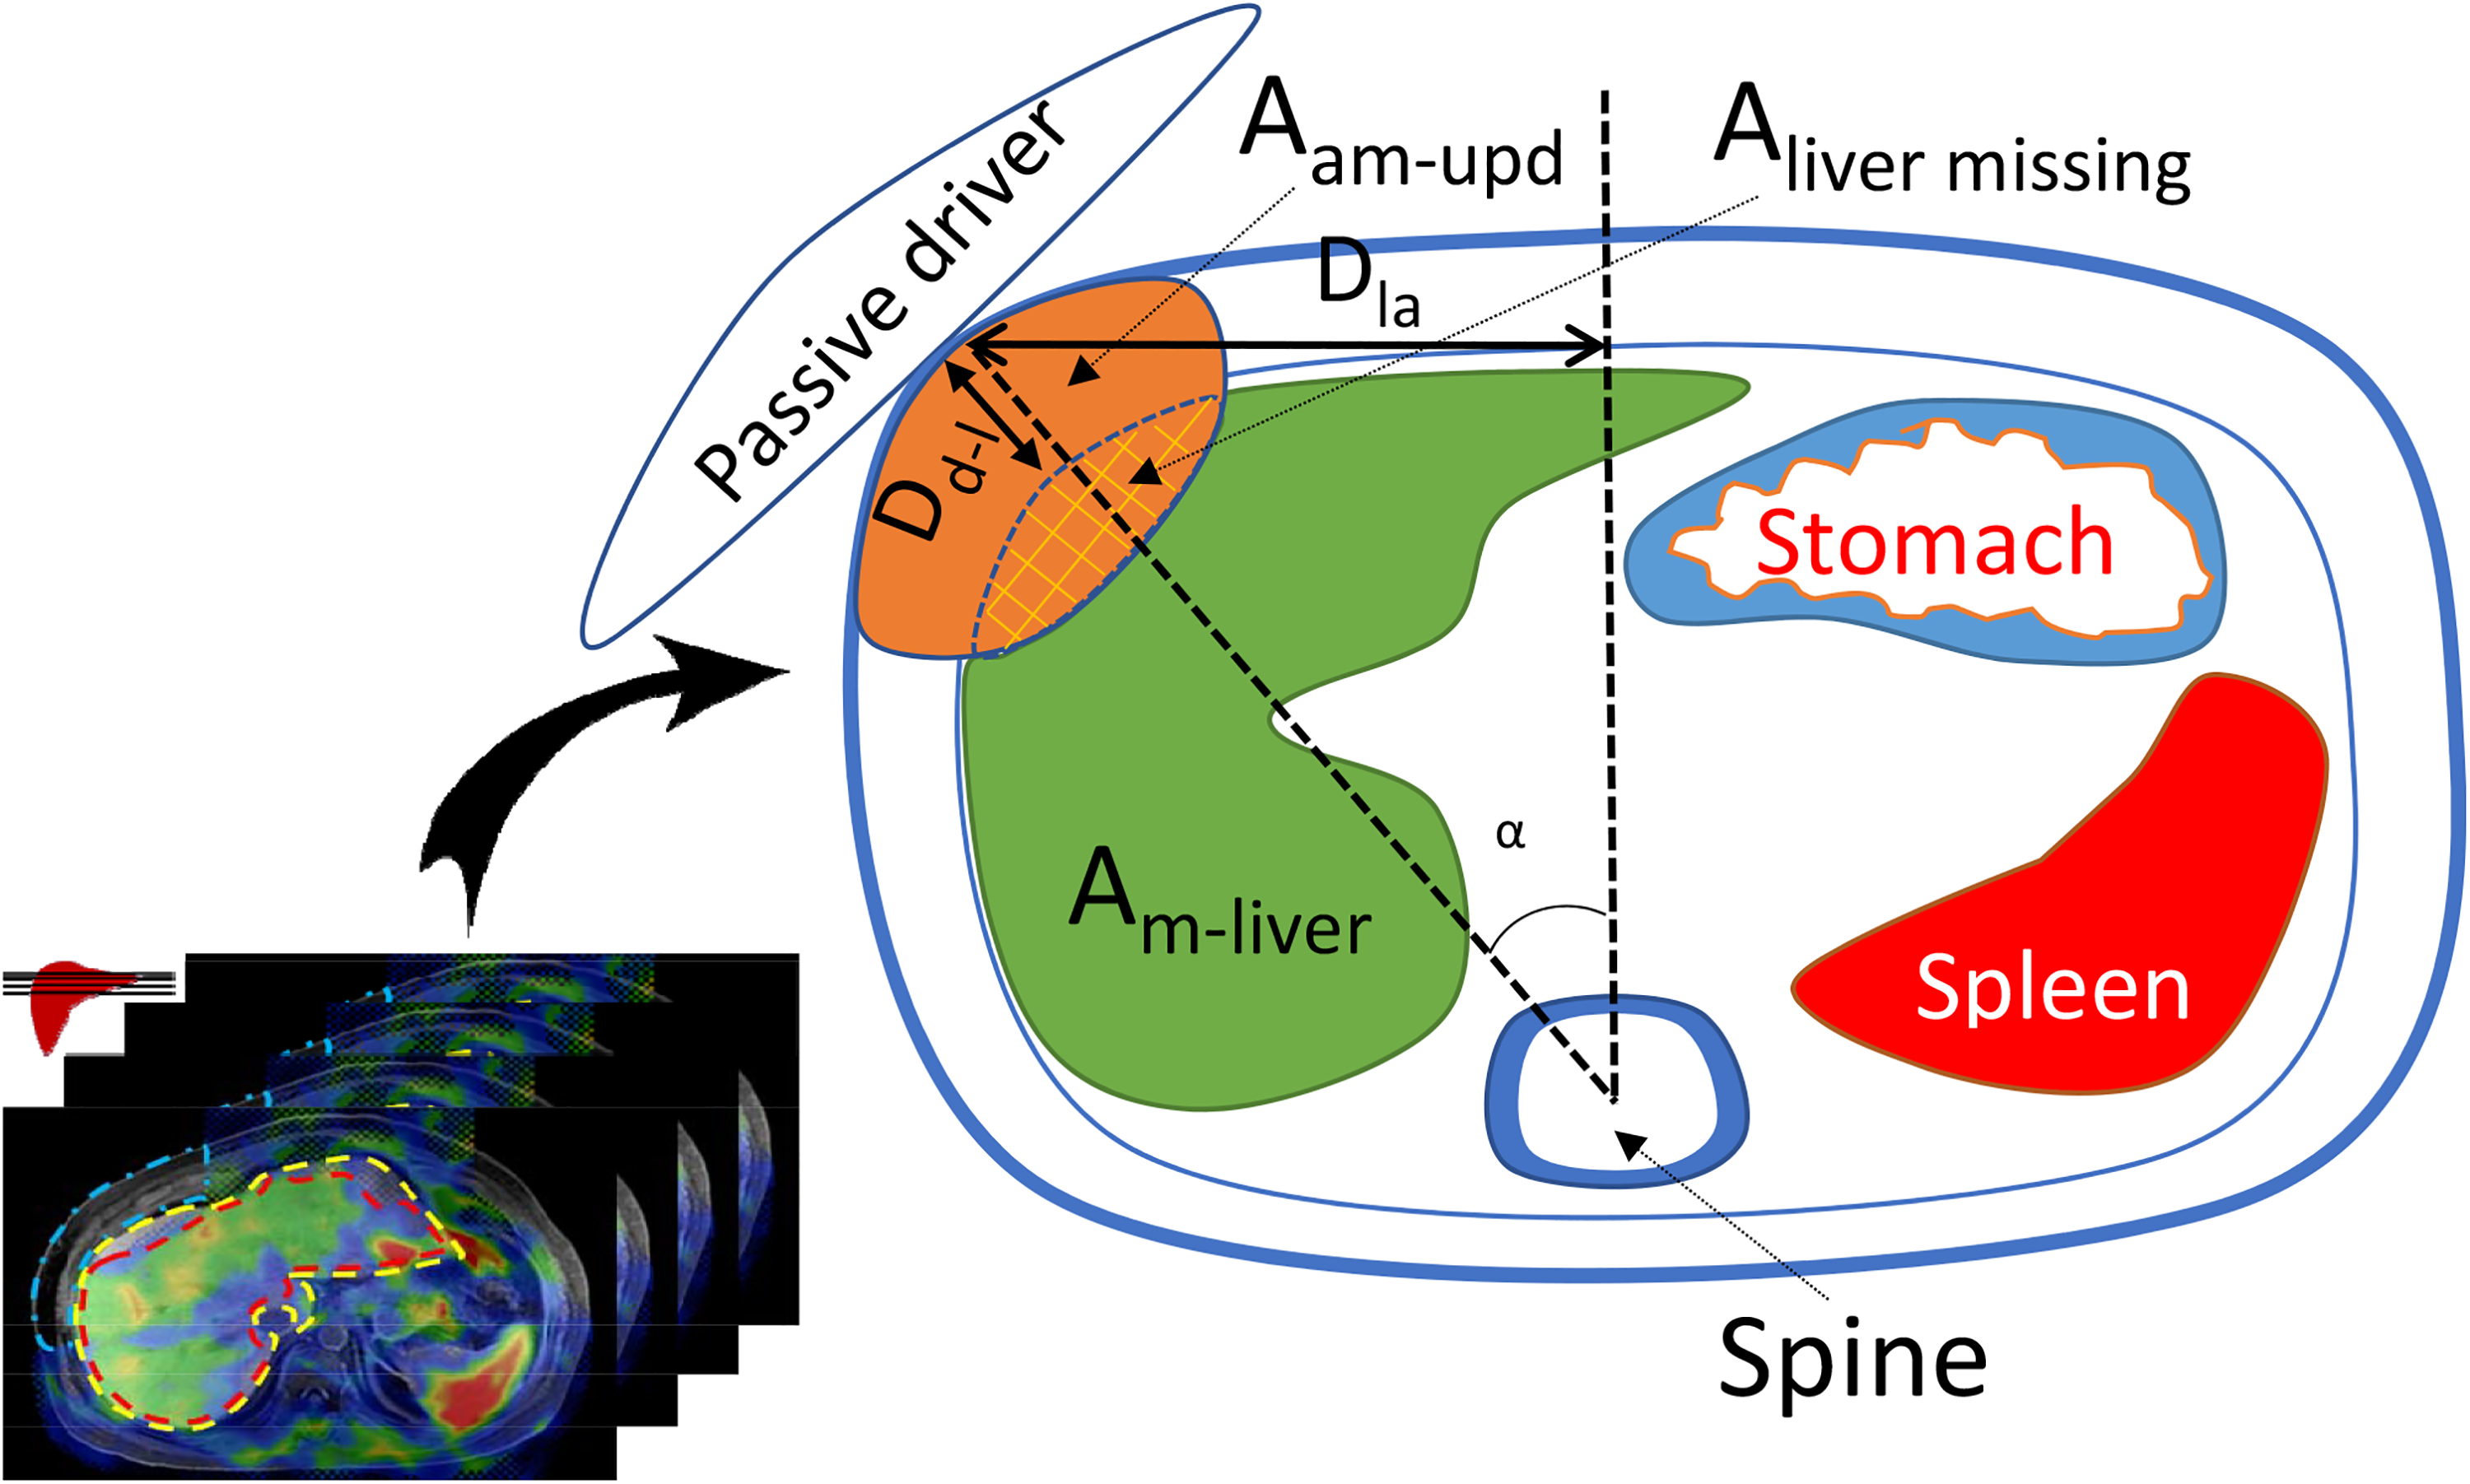
Measurement diagram of AMVR, LMVR, pMLV, angle α, Dla, and Dd−l. AMVR, abdominal missing volume ratio; LMVR, liver missing volume ratio; pMLV, percent liver measurable volume.
LMVR is the liver missing volume ratio, Am−liver is the measurable area of the liver, and Aa−liver is the anatomical area of the liver.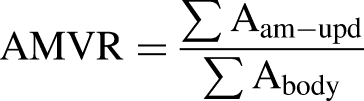
Statistical methods
SPSS Statistics (version 21.0; IBM Corp., Armonk, NY, USA) and Orange data mining software (version 3.35.0) (8) were used for the statistical analysis.
In the first round of variable screening, variables that did not satisfy the normal distribution, had uneven variances, and were not related to the driver amplitude were excluded. In the second round of variable screening, Lasso regression analysis was used to exclude variables with zero standardized regression coefficients. For the included independent variables, an ICC analysis was performed.
Eight linear regression models were developed using the driver amplitude as the dependent variable and the selected variables as independent variables. The independent variables were deleted individually, from small to large, based on the standardized Lasso regression coefficient, and tenfold cross-validation was employed to evaluate the accuracy of the models. Mean square error (MSE), root mean square error (RMSE), mean absolute error (MAE), and R2 were used as evaluation indices. The model with the largest R2 was subjected to the F test, VIF test, and D-W test to re-verify its rationality.
Results
Driver amplitude
There were 41 successful participants with one amplitude attempt, 10 participants with two amplitude attempts, six participants with three amplitude attempts, and four participants with four amplitude attempts. The mean driver amplitude of end-expiratory breath-holding was 60.27% ± 12.51%, and that of end-inspiratory breath holding was 47.00% ± 14.64%. The driver amplitude showed significant statistical differences under different breath-holding states (t = 4.55, P <0.001).
ICC analysis
AMVR, LMVR, pMLV, MSWL, angle α, Dla, Dd−l, hepatic lipid, and hepatic iron all had significant P values <0.001 based on ICC analysis, and the correlation coefficient was in the range of 0.901–0.999, indicating that the reliability of the data was high.
Spearman correlation
Variables associated with driver amplitude were as follows: pMLV; AMVR; LMVR; waist circumference; body weight; BMI; breath-holding status; Dd−l; Dla; and angle α (Table 2). The following variables had no correlation with driver amplitude: age; height; MSWL; hepatic lipid; hepatic iron; r values were −0.121, 0.027, −0.114, 0.156, and 0.181, and P values were 0.245, 0.797, 0.273, 0.130, and 0.079, respectively.
Results of Spearman’s correlation coefficient analysis.
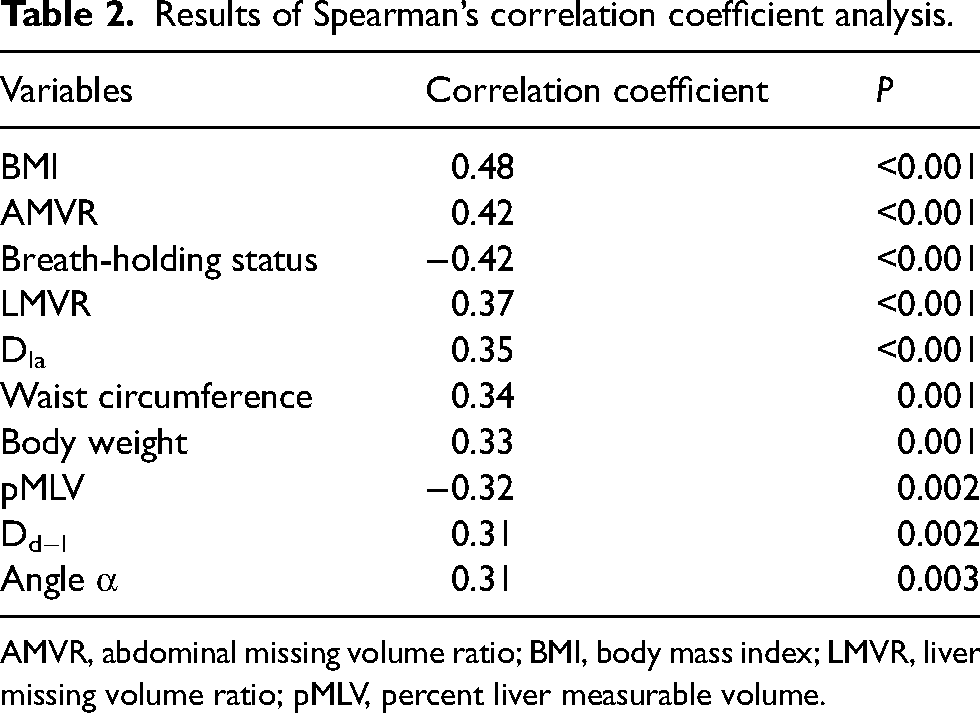
AMVR, abdominal missing volume ratio; BMI, body mass index; LMVR, liver missing volume ratio; pMLV, percent liver measurable volume.
Lasso regression
As shown in Fig. 2, λ = 0.04 and log(λ) = −3.21 were determined to minimize the MSE. Lasso regression results showed that based on the standardized coefficient of variables (Table 3), the variable intercept term, AMVR, Dd−l, BMI, angle α, waist circumference, body weight, Dla, and breath-holding status were retained, while the variables pMLV and LMVR were deleted.

Lasso regression cross validation diagram (a) and model regression coefficient diagram (b).
Results of Lasso regression analysis.
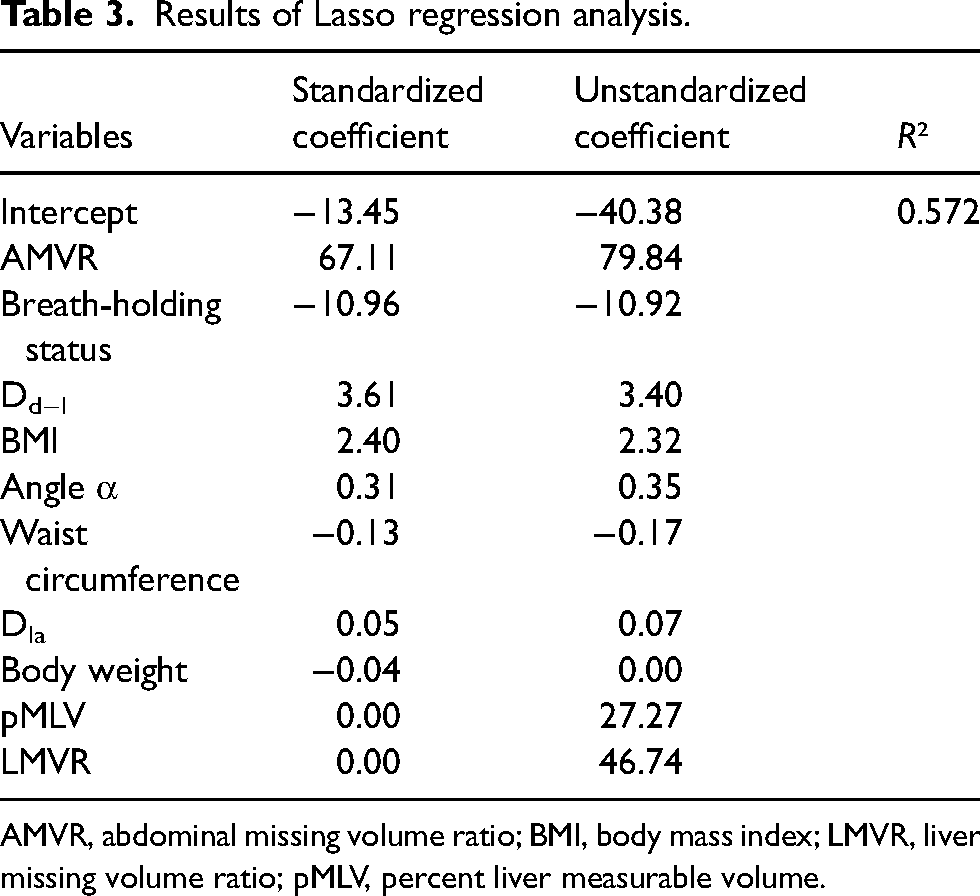
AMVR, abdominal missing volume ratio; BMI, body mass index; LMVR, liver missing volume ratio; pMLV, percent liver measurable volume.
Optimal model screening
After deleting independent variables individually from small to large based on the standardized regression coefficient of Lasso regression, eight linear regression models for the prediction of driver amplitude were established. The efficacy of each model was tested using a tenfold cross-validation method, and model 4 was the most effective linear regression model for the prediction of driver amplitude (Table 4).
Comparison of the efficacy of eight linear regression models for predicting driver amplitude.

MSE, RMSE, MAE, and R2 were the mean values after tenfold cross-verification.
AMVR, abdominal missing volume ratio; BMI, body mass index; MAE, mean absolute error; MSE, mean square error; RMSE, root mean square error.
Revalidation of the optimal model
Based on the analysis of the F test results for model 4, a P value <0.001 indicated statistical significance, indicating that model 4 fit the requirements. VIF were all <5, indicating that there was no multicollinearity issue with the model. In addition, the D-W value was close to 2, indicating that there was no autocorrelation in the model (Table 5).
Revalidation of the optimal driver amplitude prediction model.
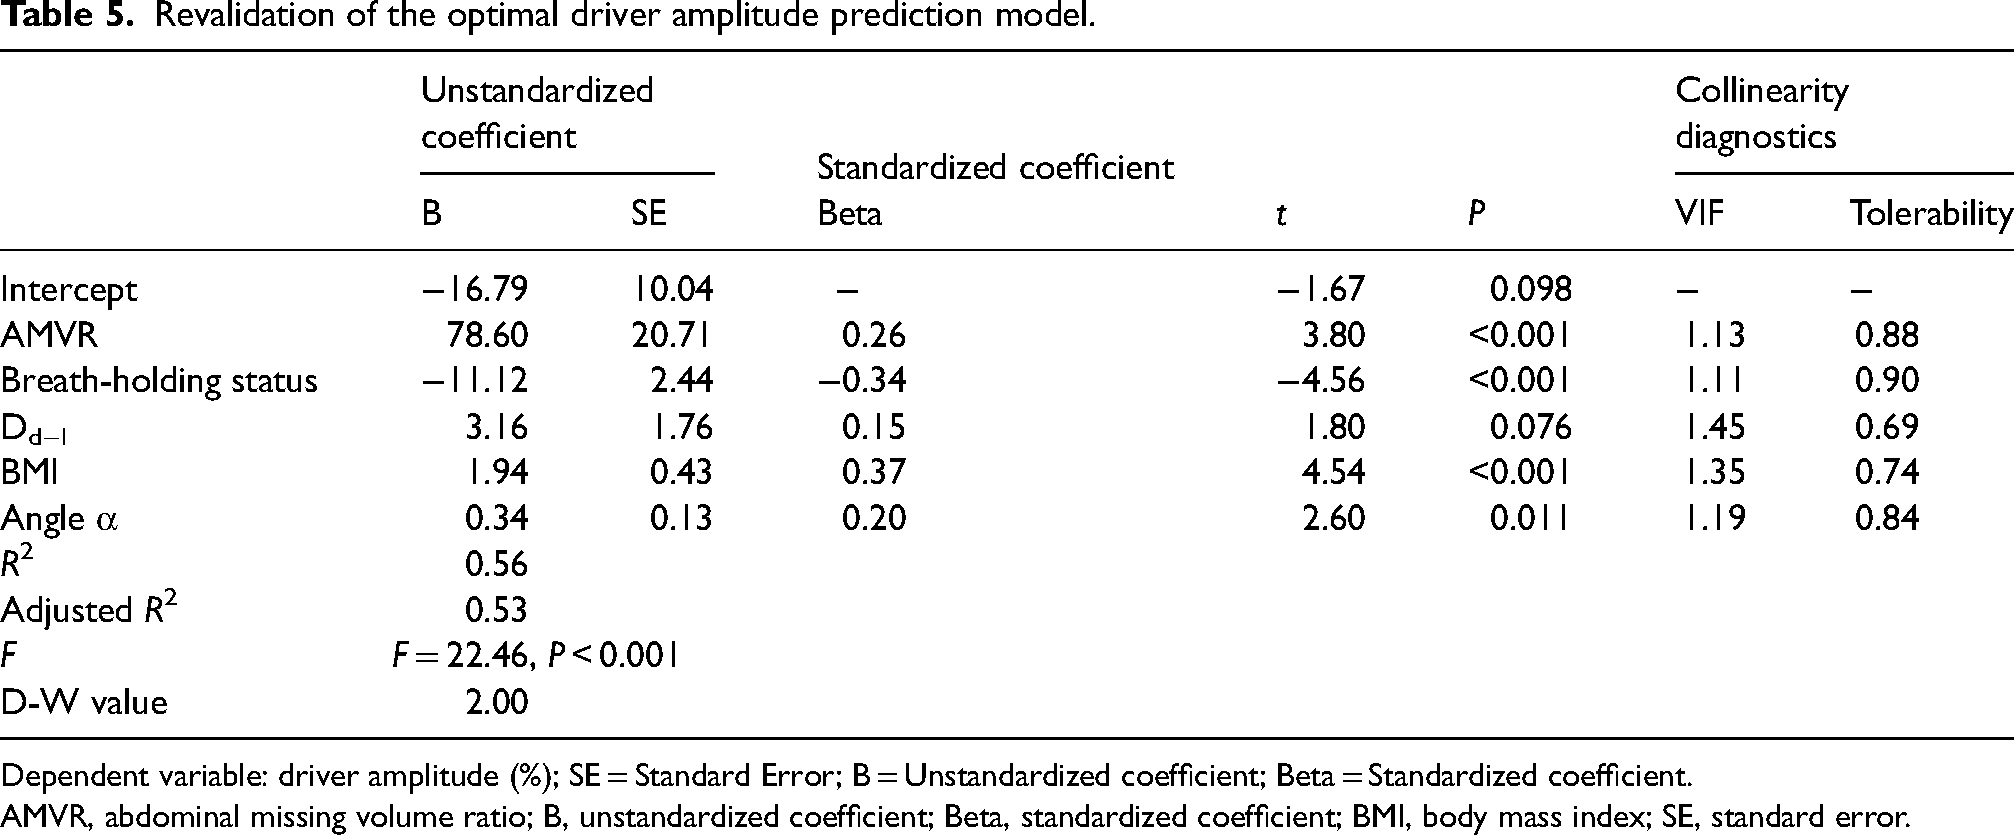
Dependent variable: driver amplitude (%); SE = Standard Error; B = Unstandardized coefficient; Beta = Standardized coefficient.
AMVR, abdominal missing volume ratio; B, unstandardized coefficient; Beta, standardized coefficient; BMI, body mass index; SE, standard error.
Discussion
MRE scans of the liver often necessitate multiple trial scans due to varying standards for driver amplitude settings (3–5,9–12). Consequently, the determination of individualized amplitudes presents a critical clinical challenge. Building upon previous research and our own experience, we contend that liver MRE images should aim for optimal pMLV (3,13,14) and minimize AMVR. In this study, we employed driver amplitude-related variables to develop an optimal linear regression model, which holds the potential to enhance the quality and efficiency of hepatic MRE examinations and may address the historical inadequacies in driver amplitude settings in past research (Fig. 3).

Self-contrast case: a 44-year-old man with liver cirrhosis, BMI 20.0 kg/m2, waist circumference 76 cm, body weight 55 kg, Dd−l 1.63 cm, Dla 10.24 cm, angle α 39.4°, breath-holding at the end of expiration. Model 4 predicted an amplitude of 29.4%. The higher amplitude was 60% (a–c), the same as that from three months previously (BMI 25 kg/m2, body weight 102 kg), and the lower amplitude of the scan design was 30% (d–f), which was an approximate value of the predicted amplitude 29.4%. (a) In the phase diagram, there is a noticeable high phase shift occurring just below the passive driver due to intravoxel phase dispersion. (b) The color wave diagram illustrates clear waves in the liver, with the second red wave indicating a dark area. (c) The fusion diagram (T1-weighted imaging + elastogram with 95% confidence map) reveals tissue defects in the right anterior abdomen (AMVR = 0.03), while the liver's measurable area remains complete (pMLV = 100%), and the MSWL was 8.30 kPa. (d) Conversely, at a 30% amplitude, the phase diagram shows a reduction in the degree of phase shift in the right anterior abdomen. (e) The color wave diagram demonstrates clear intra-liver waves, and the dark area within the red wave is reduced. (f) The fusion diagram indicates a decrease in tissue defects in the right anterior abdomen (AMVR = 0.01), with the liver's measurable area remaining complete (pMLV = 100%) and an MSWL of 6.92 kPa. The liver stiffness measurements at both driver amplitudes suggest F4 fibrosis or cirrhosis. AMVR, abdominal missing volume ratio; BMI, body mass index; LMVR, liver missing volume ratio; MSWL, mean stiffness of whole liver; pMLV, percent liver measurable volume.
Lorton et al. (11) conducted a study on liver MRE in pediatric patients and recommended the application of quantitative analysis to determine the appropriate driver amplitude. Initially, our intention was to incorporate three quantitative parameters, namely pMLV, LMVR, and AMVR, based on elastogram with a 95% confidence map to facilitate quality control in liver MRE (3). However, during the Lasso regression analysis, both pMLV and LMVR were identified as non-contributory variables and were subsequently excluded from consideration. As a result, our formulation of linear regression models for the prediction of driver amplitude was refined to exclusively encompass the AMVR parameter. Notably, both Spearman correlation analysis and Lasso regression demonstrated a positive correlation between driver amplitude and AMVR.
In this study, participants were instructed to hold their breath at the end of expiration, resulting in an observed decrease in AMVR. This response was associated with several physiological changes: relaxation of the abdominal band (9), weakening of shear waves, and a concurrent reduction in AMVR. These findings suggest that the act of holding one's breath at the end of expiration has a discernible impact on abdominal band relaxation, shear wave strength, and the measured AMVR variables in the study. Based on the standardized regression coefficient of “breath-holding status” in model 4, it can be inferred that increasing the driver amplitude by approximately 11% is advisable when a participant holds their breath at the end of inspiration to achieve a relatively satisfactory MRE image. For quality control, when holding one's breath at the end of inspiration, prioritizing the improvement of pMLV is crucial, rather than focusing on reducing AMVR.
According to the Lasso regression analysis, the absolute value of the standardized coefficient for body weight was lower than that for BMI (0.04 < 2.4). In contrast, model 3 (R2 = 0.487), which was derived from model 2 (R2 = 0.477) by excluding body weight as a factor, exhibited superior predictive performance. Therefore, we posit that predicting driver amplitude using BMI, as opposed to body weight, is a simpler way to obtain MRE images with lower AMVR. This conclusion aligns with the findings of Mori et al. (15), who also emphasized the suitability of BMI as a measure for assessing physical constitution. Similarly, Lorton et al. (11) proposed that utilizing BMI in a study provides an advantage in distinguishing participants with the same body mass but differing heights.
After removing the independent variable, waist circumference, model 4 demonstrated an improved predictive performance, suggesting that waist circumference does not contribute to the driver amplitude prediction model, whereas Dd−l is associated with driver amplitude. This finding aligns with that of Ballard et al. (3), who similarly asserted the association between Dd−l and the quality of liver MRE. In comparison to waist circumference, the abdominal wall tissue beneath the passive driver is directly affixed to the passive driver; thus, Dd−l plays a crucial function in the missing area under the passive driver.
In line with the study by Joshi et al. (9), it was found that increasing the Dla of a passive driver could enhance the technical success rate of liver MRE. However, the Lasso regression analysis revealed that the standardized coefficient for Dla was 0.053, which remained an order of magnitude lower than that of angle α (0.311). Furthermore, the removal of Dla from model 1 resulted in an improvement in prediction efficacy (R2 = 0.474 to 0.477).
In contrast, when angle α was removed from model 4 to create model 5, the prediction efficacy decreased (R2 = 0.492 to 0.469), indicating that Dla carries less significance than angle α in the context of the study. Angle α should be retained in the model, as both Dla and angle α can serve as representations of participant body size, and they exhibit collinearity. It is noteworthy that as angle α increases, the passive driver tilts to the right, suggesting that participants are larger from a different perspective. When compared to BMI, we assert that angle α is a valuable supplementary indicator for characterizing local body size.
In model 4, AMVR, breath-holding status, Dd−l, BMI, and angle α were integrated to facilitate individualized amplitude design. Collecting information regarding breath-holding status and BMI is relatively straightforward, whereas acquiring data for Dd−l and angle α requires the involvement of technicians who must perform measurements on abdominal MR images after routine scanning. However, AMVR is a parameter unique to liver MRE scans, and its measurement process is tedious. When implementing model 4 for customizing amplitude designs in liver MRE practice, it is reasonable to consider an AMVR value of 0 as the optimal state. Consequently, gathering data on participants’ breath-holding status, Dd−l, BMI, and angle α during or before routine abdominal MR scans can be achieved without overburdening MR technicians or causing undue time constraints.
The present study has some limitations. The study did not encompass additional quantitative metrics related to MRE quality, including hot spot occurrence rates, subjective waveform scores, and the count of ideal waves. Furthermore, it is important to note that these findings are derived from a single-center and single-equipment model, which may limit their generalizability.
In conclusion, the individualized amplitude prediction model based on AMVR, breath-holding status, Dd−l, BMI, and angle α is a valuable tool in liver MRE examination.
Supplemental Material
sj-docx-1-acr-10.1177_02841851241228188 - Supplemental material for Individualized driver amplitude in liver MR elastography: a linear regression study
Supplemental material, sj-docx-1-acr-10.1177_02841851241228188 for Individualized driver amplitude in liver MR elastography: a linear regression study by Ya-nan Zhai, Nian-jun Liu, Xiao-xiao Wen, Xin Zhuang, Jian-lin Li, Xiao-cheng Wei and Shun-lin Guo in Acta Radiologica
Footnotes
Acknowledgments
I would like to express my heartfelt gratitude to Lei Jun-qiang and Wang Gang, both of whom are my esteemed colleagues, for their exceptional support throughout my endeavor. Their invaluable advice and unwavering support were instrumental in enabling me to successfully complete my entire project. I am also deeply thankful to the research team for their collaboration and assistance in gathering the necessary data for my study.
Declaration of conflicting interests
The author(s) declared no potential conflicts of interest with respect to the research, authorship, and/or publication of this article.
Funding
The author(s) disclosed receipt of the following financial support for the research, authorship, and/or publication of this article: This work was supported by the Internal Research Foundation of the First Hospital of Lanzhou University (grant number ldyyyn2021-104).
