



Abstract
Background
The use of dual-energy X-ray absorptiometry (DEXA) and quantitative computed tomography (QCT) methods are important for the diagnosis and follow-up of osteoporosis, and are used especially in cases to determine the degree of osteoporosis and the risk of fracture, monitoring the effectiveness of the treatment applied.
Purpose
To compare the parameters measured using the DEXA method from the lumbar (L1-L4) vertebrae and the Hounsfield unit (HU) values measured with QCT at the same levels among young adults and the elderly.
Material and Methods
The study included 155 patients (age range = 26–93 years). A total of 57 (36.8%) patients (age range = 26–64 years) were defined as the first group, and 98 (63.2%) patients (aged ≥65 years) were defined as the second group. T-test and correlation analysis were performed to compare bone mineral density (BMD), T score, and HU values measured using DEXA and QCT.
Results
A statistically significant difference was found between T score, lumbar total BMD, and HU values according to age and sex (P < 0.05). When the values measured from lumbar vertebrae were compared using both DEXA and CT, a high correlation was found between them.
Conclusion
In the study, it was observed that QCT attenuation measurements of the lumbar spine measured between different age groups provided reliable results in terms of BMD scanning, as in DEXA. It should be noted that QCT has a longer imaging time and higher radiation dose compared to DEXA, and unnecessary scans should be avoided.
Introduction
Osteoporosis is defined as a systemic skeletal disease characterized by low bone mass and deterioration of the micro-architectural structure of bone tissue, which results in increased bone fragility and susceptibility to fracture. This disease, which is often referred to as the “silent epidemic,” remains asymptomatic until fractures develop in several people; therefore, early diagnosis is very important (1–5).
Although osteoporosis is a bone disease that is more frequently seen in elderly patients, there are different factors that affect skeletal fragility in addition to age. These can be listed as genetics, nutrition, vitamin and mineral deficiency, lifestyle choices, smoking history, hormonal production, and medications (6).
Fractures (especially hip fractures) cause morbidity and mortality. The incidence of fractures increasing exponentially with age causes very high costs for health services. At younger ages, fractures in other regions occur more frequently than hip fractures and should not be neglected (7,8). Since osteoporosis is usually diagnosed when the first fracture occurs, the treatment of osteoporosis has generally focused on reducing the rate of bone loss in the elderly. Interventions to optimize bone deposition before it reaches its peak become important in planning early preventive strategies for osteoporosis (2,9). In childhood, avoiding risk factors, such as balanced nutrition, physical activity and smoking, and in adulthood, early recognition of osteoporosis followed by timely and effective treatment can reduce the risk of fracture. Lifestyle changes such as physical activities, calcium and vitamin D intake, and quitting smoking play an important role in the treatment of osteoporosis (10,11).
Bone density is an important parameter in describing bone strength. It is expressed as grams of mineral per area or volume and is determined by the amount of peak bone mass and bone loss in any given individual (12). Measurement of bone mineral density (BMD) is used as the main method for the assessment of osteoporosis and to estimate fracture risk. The BMD value used for the clinical diagnosis of osteoporosis can be measured with various techniques and in different regions such as the hip and lumbar vertebra (13,14).
The use of imaging methods is important for the diagnosis and follow-up of osteoporosis. Imaging methods are used especially in cases to determine the degree of osteoporosis and the risk of fracture, monitoring the effectiveness of the treatment applied. Different clinical techniques are available for BMD measurement, including dual-energy X-ray absorptiometry (DEXA), quantitative computed tomography (QCT), quantitative ultrasonography, and magnetic resonance imaging (MRI) techniques (15).
BMD measurement, which is widely used in diagnosis and determination of fracture risk, is accepted as the most reliable method for deciding on treatment and evaluating the effectiveness of treatment (1,2,16).
For the diagnosis of osteoporosis with DEXA, bone density can be evaluated from different measurement sites such as the lumbar spine and proximal hip (17). In particular, QCT of the lumbar vertebrae is becoming more common as an alternative to DEXA in the evaluation of bone mineral density. QCT is an alternative method to DEXA. Different advantages of QCT over DEXA have been described in the literature. While the mineral mass per unit bone volume cannot be measured directly with DEXA, it can only be measured with QCT. Special scanning protocols are used in clinical CT scanners to measure volumetric bone density in QCT. The QCT is capable of providing three-dimensional (3D) BMD information (mg/cm3) compared to two-dimensional DEXA information (g/cm2). Unlike DEXA, QCT is less susceptible to the adverse effects of confounding factors, such as changes in bone size and overlying densities such as osteophytes, aortic calcification, and high body mass index (BMI) (18–22). Furthermore, QCT can selectively measure trabecular or cortical bone density depending on the region of interest (ROI), whereas DEXA cannot distinguish between different bone architectures. Trabecular bone is more metabolically active than cortical bone and is a more sensitive marker for changes in bone strength (22).
The aim of the present study was to compare the parameters (T score, BMD, total area) measured with the DEXA method from the lumbar (L1-L4) vertebrae and the Hounsfield unit (HU) values measured with CT at the same levels among young adults and the elderly. In addition, based on the results obtained, the aim was to determine whether the use of a CT device instead of a DEXA device was necessary in terms of radiation in the diagnosis of osteoporosis in young adults.
Material and Methods
Data were collected from a single health center. The retrospective study was conducted with 155 patients who underwent both DEXA and abdominal CT tests between 2014 and 2020. The study was approved by the Health Sciences Centre Ethical Committee (protocol no.: 26/08/2021-36).
Patients
A total of 155 patients aged 26–91 years were included in the study. Of the total patients studied, 143 (92.3%) were female and 12 (7.7%) were male. The age range of the female participants was 26–93 years, and the age range of the male participants was 47–86 years. Among the patient groups, 57 (36.8%) patients aged 26–64 years were defined as the first group, and 98 (63.2%) patients aged ≥65 years were defined as the second group. Statistical analyses were performed.
Dual X-ray absorptiometry
DEXA, an imaging technique based on the attenuation of X-rays at different energies as they pass through tissues, was used. DEXA was performed using the pencil-beam scanner Lunar DPX-L Bone Densitometer (Lunar Corporation, Madison, WI, USA). Areal BMD was measured at the lumbar spine (anteroposterior L1-L4). The World Health Organization (WHO) classification was determined by measuring the BMD (g/cm2) and T-Z scores of the lumbar (L1-L4) vertebrae with DEXA (Fig. 1a). In 1994, the WHO described that normal was up to −1.0 SD, osteopenia between −1 and −2.5 SD, and osteoporosis was below −2.5SD (23). Statistically, 68% of repeat measurements were 1 ± 0.010 g/cm² for AP spine L1-L4.
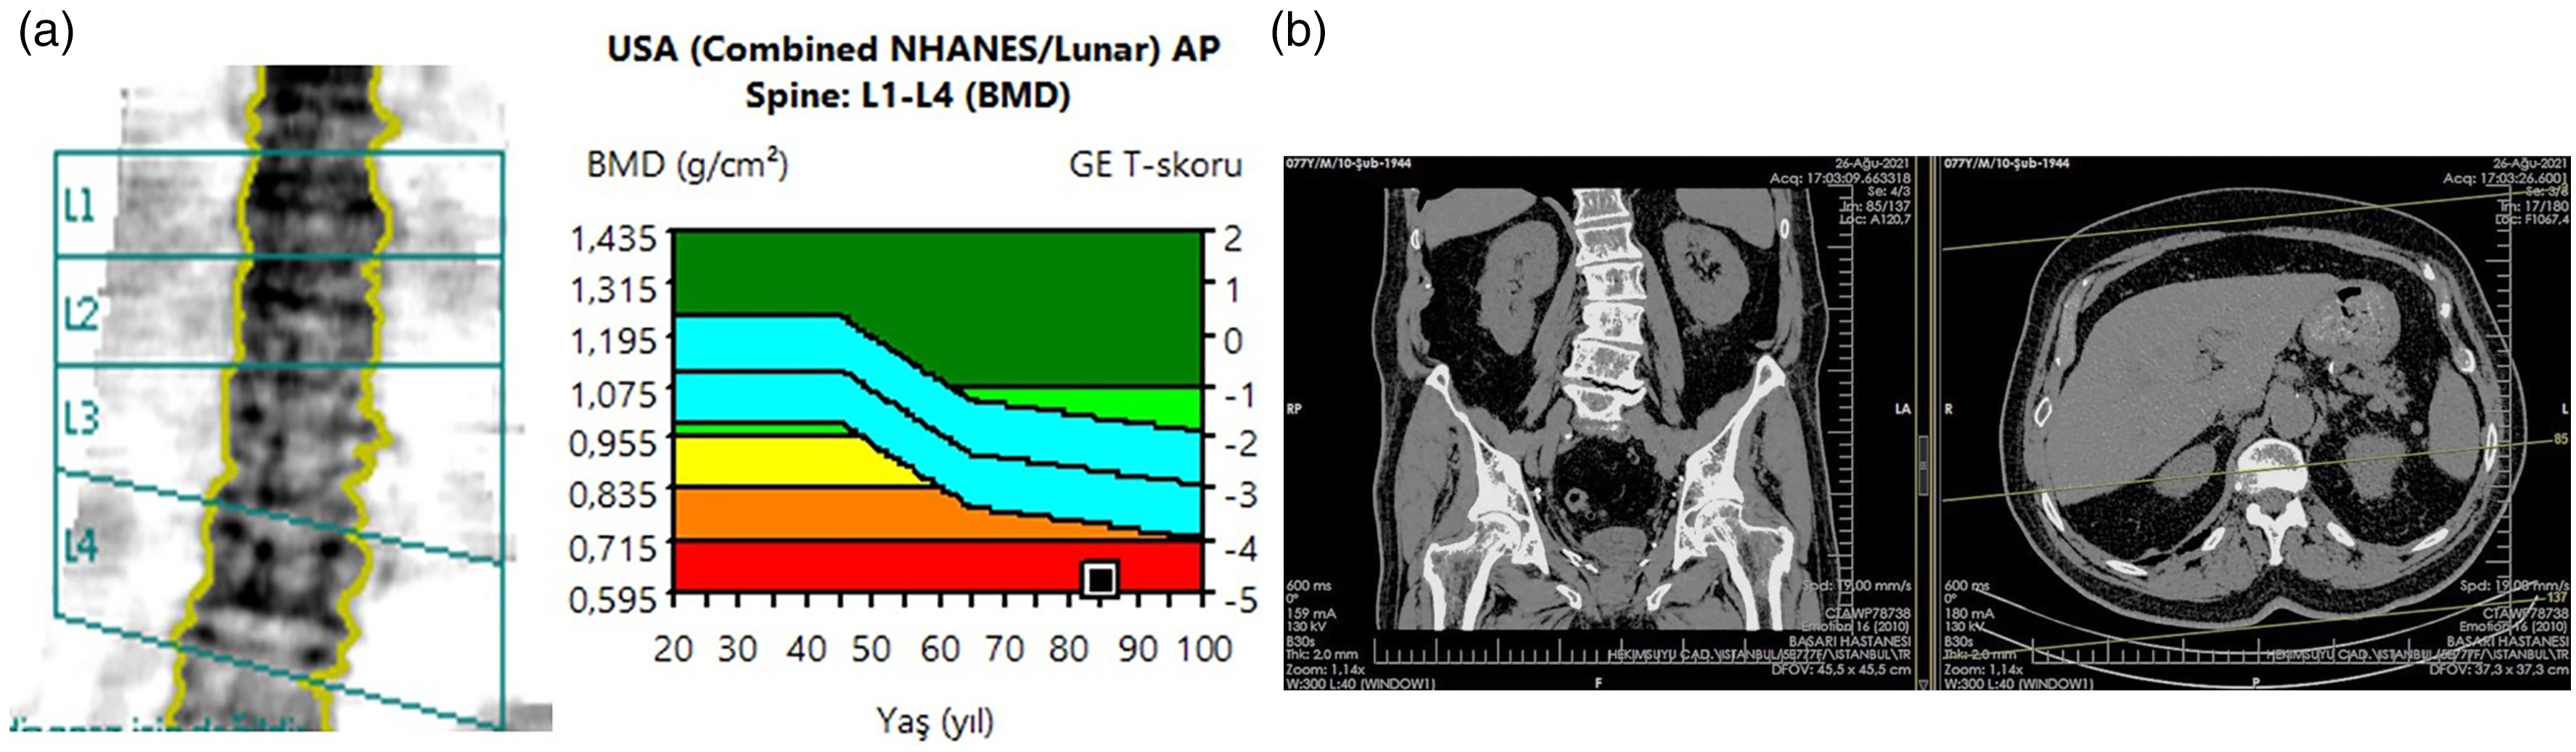
(a) The result obtained using DEXA and CT. (b) The result obtained with the DEXA device from the L1-L4 region of an old patient. CT imaging of another patient with osteoporosis according to DEXA (T = −2.5) and QCT (BMD = 0.860 mg/cm3). CT, computed tomography; DEXA, dual-energy computed tomography.
Quantitative computed tomography
Volumetric vertebral BMD was determined using the Somatom Emotion 16 Slice (Siemens AG, Forchheim, Germany). The device was calibrated daily to ensure the accuracy of the measurements. The scanning parameters for the QCT were as follows: 130 kV; 182 mAs; 100 ms; and 0.80 pitch (Fig. 1b). HU values of the L1, L2, L3, and L4 vertebrae were measured and averaged. BMD measurements in QCT were calculated using HU values read over ROIs determined in three-dimensional sections of the patient's hip and lumbar spine (Fig. 2).
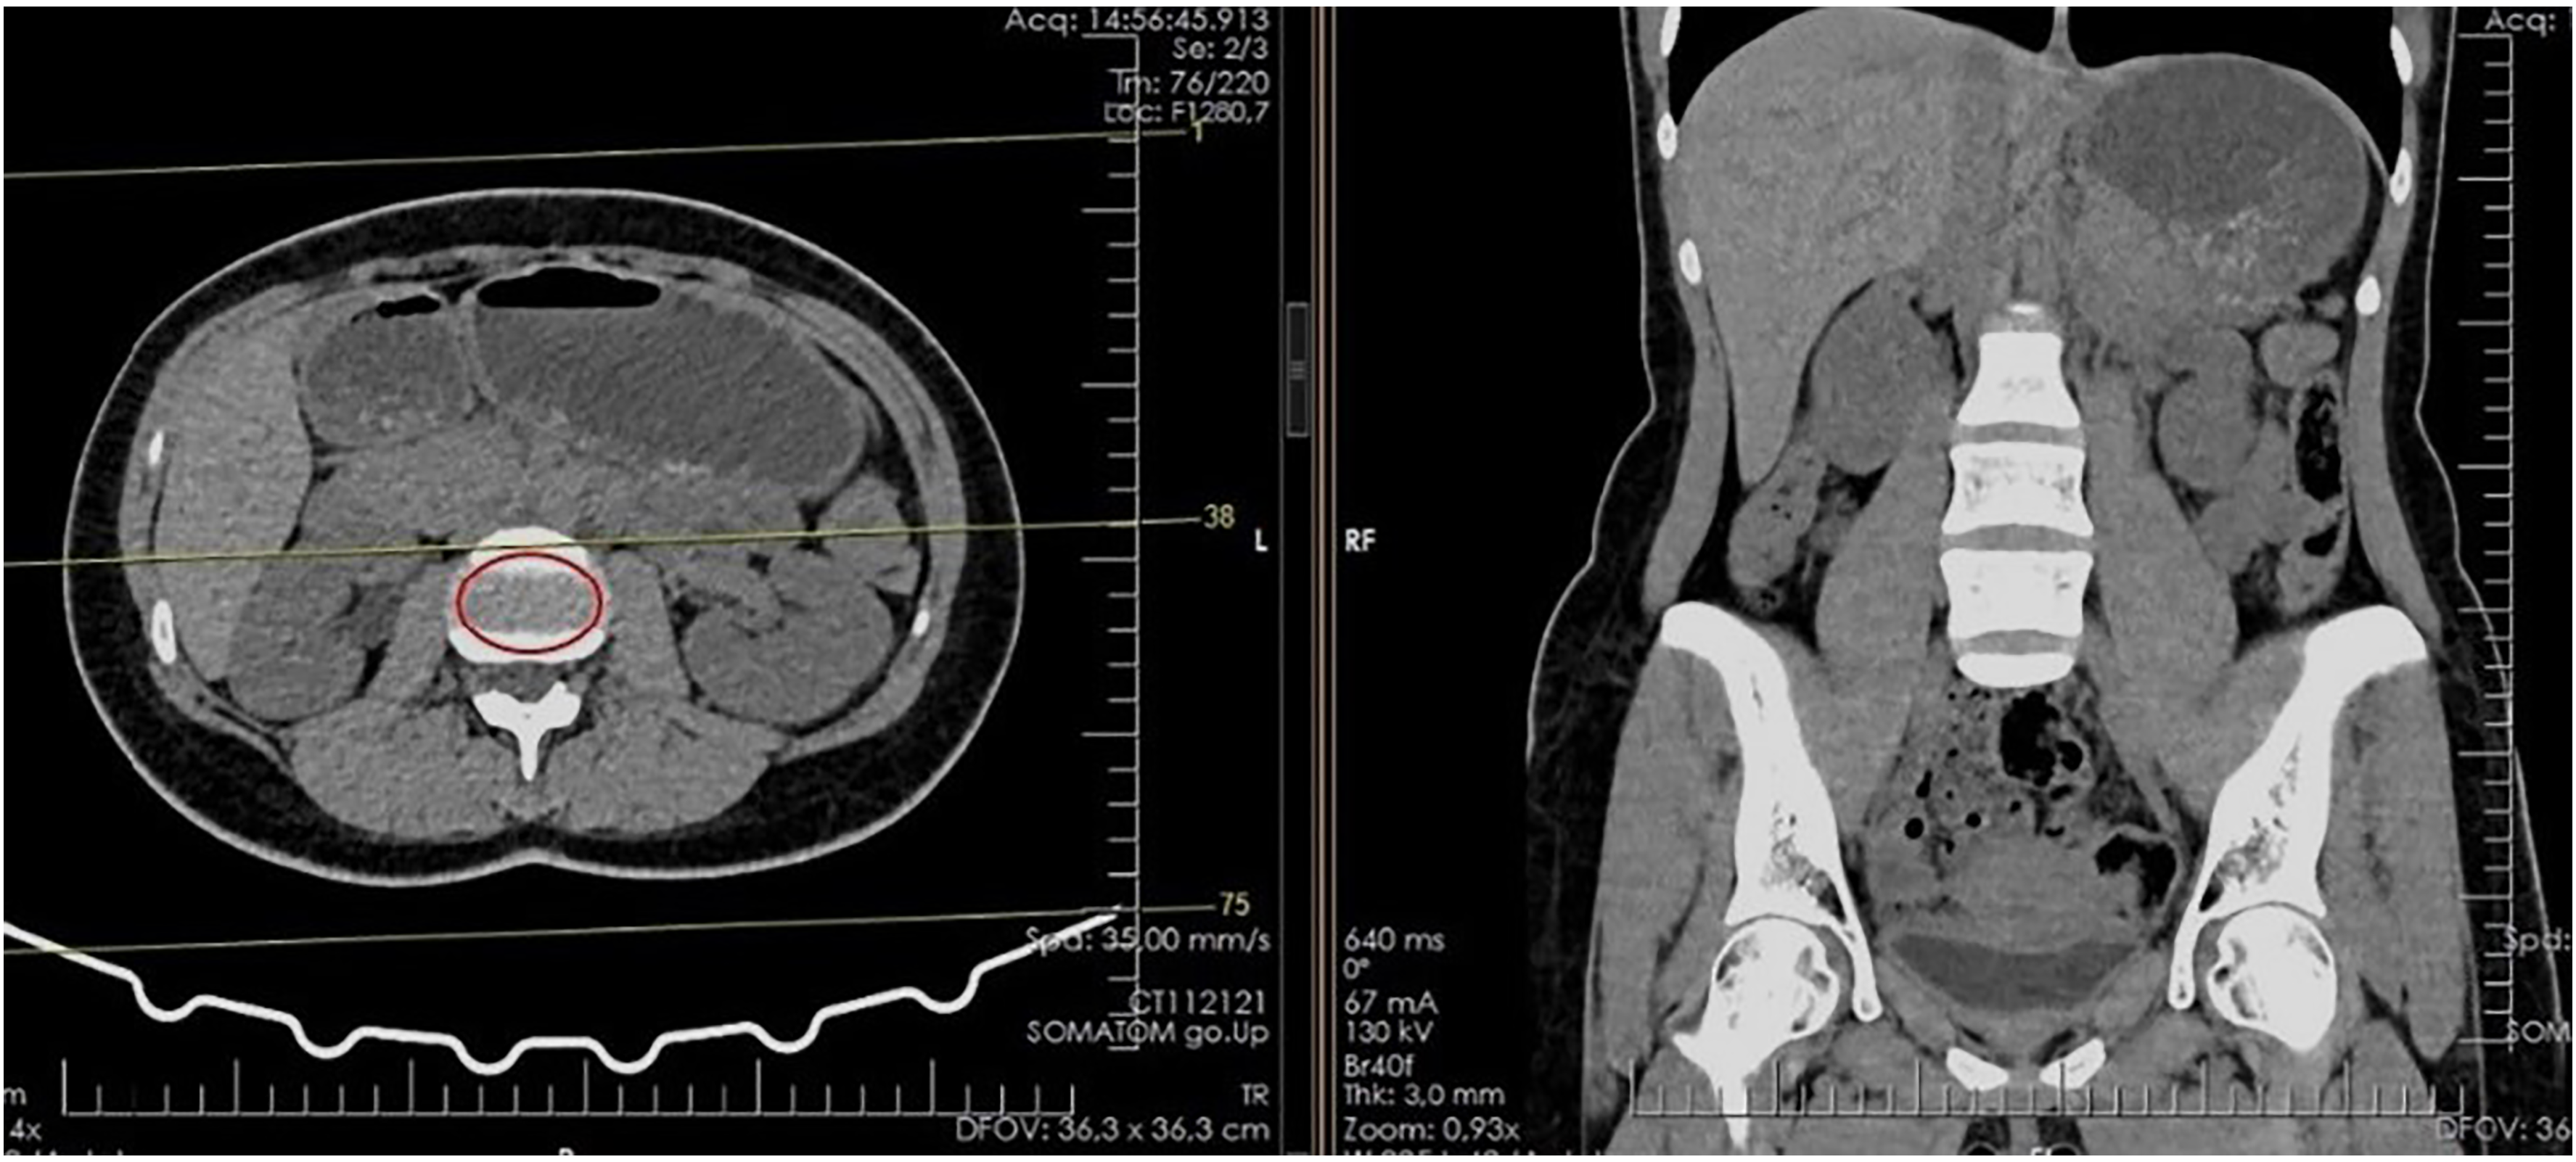
HU measurement from region of interest established to fill the lumbar vertebral body.
Statistical analysis
All analyses were performed using the SPSS version 25 (IBM Corp., Armonk, NY, USA). A P value <0.05 was considered to be statistically significant. A descriptive analysis was used to present the data as mean and standard deviation (mean ± SD). T-test, ANOVA, and a correlation analysis were performed to compare the values measured using DEXA and QCT. Student t-tests were used to compare male patients and female patients in the two different age groups, and the ANOVA was used to compare more than two samples.
Results
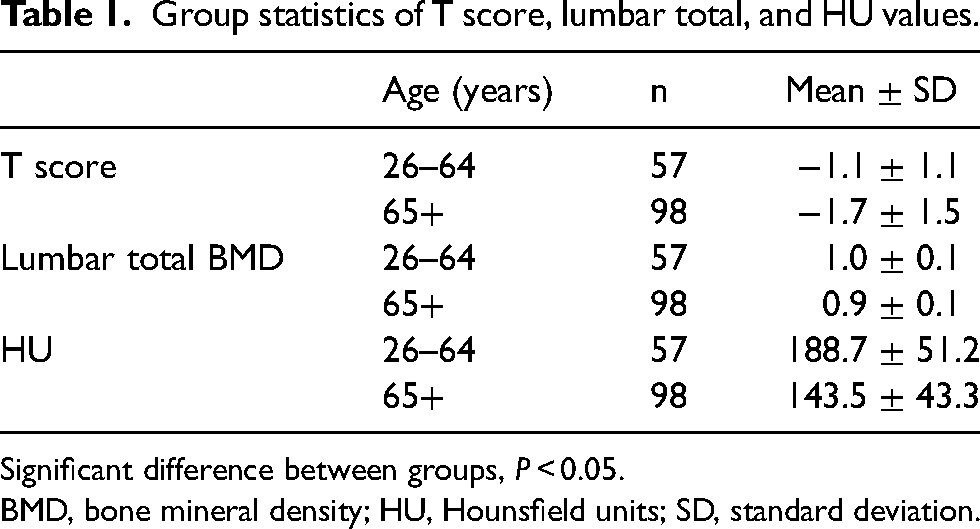
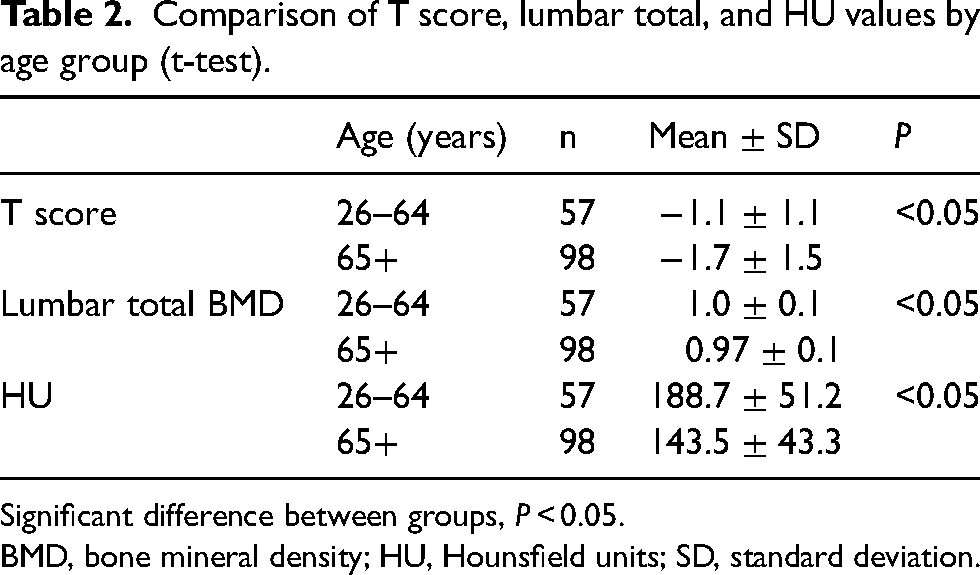
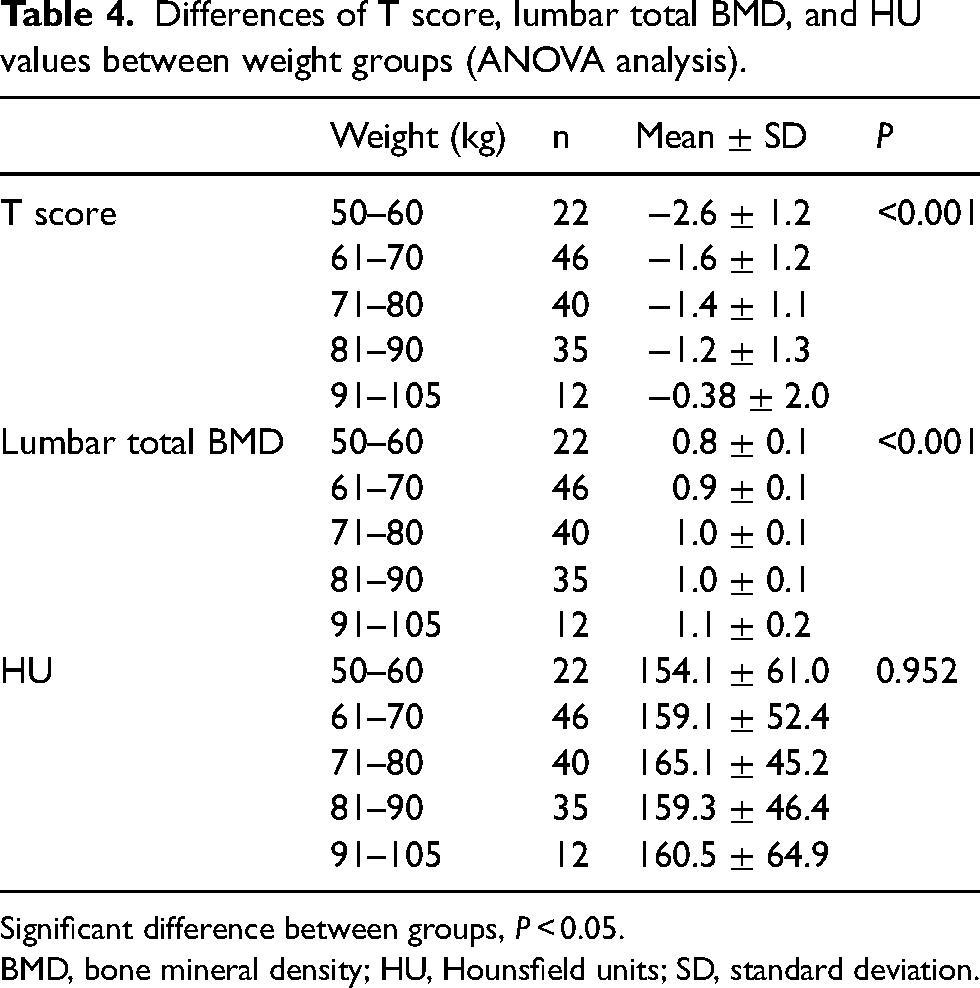
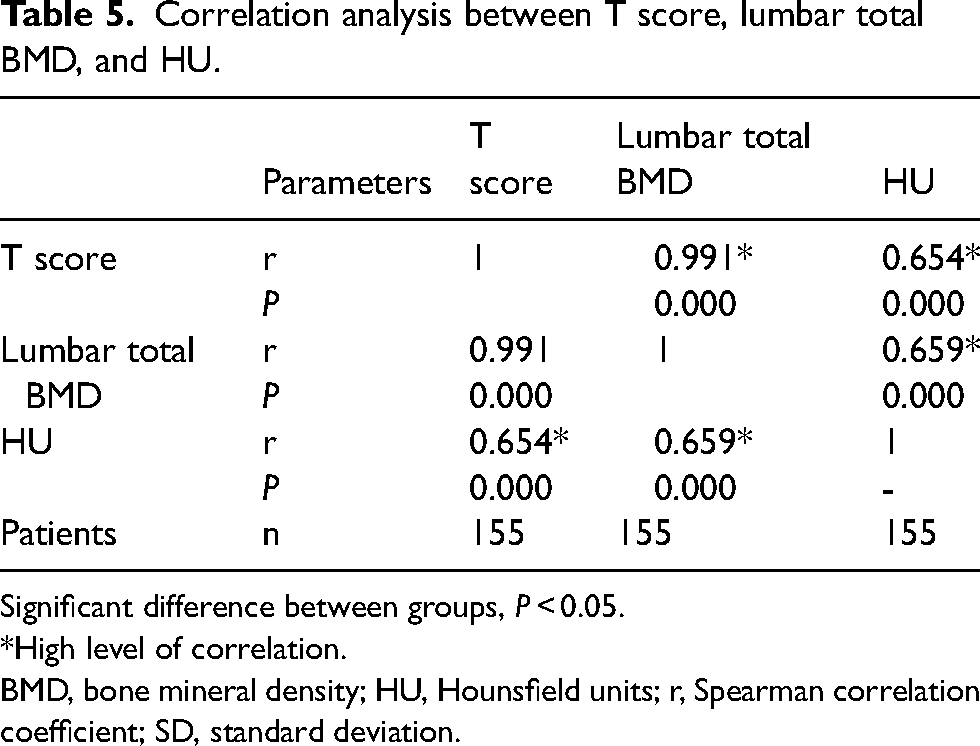
Descriptive statistics obtained by measuring T score, lumbar total, and QCT HU values in L1-L4 vertebrae of all patients are shown in Table 1. The mean T score of the two groups was −1.1 ± 1.1 and −1.7 ± 1.5, respectively. The mean total BMD of the two groups was 1.0 ± 0.1 and 0.9 ± 0.1, respectively. The mean HU of the groups was 188.7 ± 51.2 and 143.5 ± 43.3, respectively (Table 1). The t-test was performed to determine the differences in T score, lumbar total BMD, and HU values of all patients for comparison by age and sex (Tables 2 and 3). A statistically significant difference was found between T score, lumbar total BMD, and HU values according to age and sex (P < 0.05). T score, lumbar total BMD, and HU values were found to be higher in the group of male participants aged 24–64 years in terms of sex. A correlation analysis were performed between T score, lumbar total BMD, and HU values, and the correlation coefficients are given in Table 4. The weight of the study participants was in the range of 50–105 kg. An ANOVA test was applied to these patients by forming five different groups according to their weight distribution. There were 22 patients weighing 50–60 kg, 46 patients weighing 60–70 kg, 40 patients weighing 71–80 kg, 35 patients weighing 81–90 kg, and 12 patients weighing 91–105 kg. Since the weight distribution of the patients examined was within normal limits, no significant difference was found (Table 4).
Group statistics of T score, lumbar total, and HU values.
Significant difference between groups, P < 0.05.
BMD, bone mineral density; HU, Hounsfield units; SD, standard deviation.
Comparison of T score, lumbar total, and HU values by age group (t-test).
Significant difference between groups, P < 0.05.
BMD, bone mineral density; HU, Hounsfield units; SD, standard deviation.
Comparison of T score, lumbar total BMD, and HU values by sex (t-test).

Significant difference between groups, P < 0.05.
BMD, bone mineral density; HU, Hounsfield units; SD, standard deviation.
Differences of T score, lumbar total BMD, and HU values between weight groups (ANOVA analysis).
Significant difference between groups, P < 0.05.
BMD, bone mineral density; HU, Hounsfield units; SD, standard deviation.
The correlation coefficient was obtained as between T score and lumbar total BMD, between T score and HU, and between lumbar total BMD value and HU value (Table 5). These values were found to be 0.991, 0.654, and 0.659, respectively.
Correlation analysis between T score, lumbar total BMD, and HU.
Significant difference between groups, P < 0.05.
*High level of correlation.
BMD, bone mineral density; HU, Hounsfield units; r, Spearman correlation coefficient; SD, standard deviation.
Discussion
The prevalence of low bone mass and the deterioration of the microarchitecture of bone cause osteoporosis with increasing age (6). The treatment of osteoporosis is mainly focused on reducing the rate of bone loss in the elderly (9). There are different methods available for determining fracture risk and assessing skeletal status and osteoporosis. These methods are mostly based on measurement of bone mineral content (BMC) and BMD. The most common of these methods is DEXA, which is typically used in the posteroanterior and lateral lumbar spin, proximal femur, and forearm. QCT is an alternative to DEXA as it has advantages, such as overcoming the projection limitations of DEXA and allowing a selective measurement of trabecular bone in the spine. Moreover, QCT of the lumbar spine is recognized as a sensitive tool for the non-invasive measurement of BMD (24). Identifying HU in the lumbar spine using abdominal CT scans provides an advantage for the diagnosis of osteoporosis (25). Some conditions, such as significant changes in body composition, assuming a uniform ratio of adipose or non-fatty tissue in the ROI, artifacts due to changes in the distance from the X-ray source to the fan-beam detector, cause the results to be obtained with DEXA to be misleading. In such cases, the use of QCT as an alternative method also provides an advantage in terms of bone measurement (26,27).
When the results of the studies in the literature (9,22,28–32) are examined, it has been observed that they support our study. Yu et al. evaluated the lateral spine radiographs (T4-L4) of 240 postmenopausal women (mean age = 63.7 ± 6.9 years) for the presence of vertebral fractures. Posteroanterior DEXA and lateral DEXA measurements (L2-4) and QCT measurements of the lumbar spine (T12-L3 or L1-14) were taken of 240 patients and the results were compared. It was concluded that low bone density as measured by QCT, PA-DEXA, or L-DEXA was significantly associated with the prevalence of vertebral fractures in their study (28).
Salzmann et al. determined possible BMD variations along the lumbosacral spine of the patients who had undergone undergoing lumbar fusion surgery in their study and evaluated the correlation between the clinically used L1-L2 mean and the remaining lumbosacral vertebral levels. It was concluded that the clinically used standard L1-L2 BMD mean was a useful measure of bone amount of the entire lumbosacral spine in the patients who had undergone lumbar spinal fusion (22). Lochmüller et al. compared the capabilities of clinically available densitometric measurement techniques to assess vertebral strength in elderly individuals. It was concluded that a combination of cortical and trabecular density (QCT) provides the best estimate of the lumbar spine, and significantly better estimates of lumbar cortical density (QCT) and DEXA than trabecular density (QCT) (29). Gilsanz et al. concluded that they provided reference standards for quantitative CT bone measurements in children and young adults that can help diagnose, prevent, and treat pediatric metabolic bone disorders (9). A different study compared the L1-L2-L3-L4 vertebral body DEXA T scores and BMD values with CT densitometry HU values measured in the same regions. It was concluded that there was a statistically significant correlation between DEXA results and lumbar vertebra CT HU values (30). Khoo et al. showed that BMD results obtained using QCT software were highly correlated with the results obtained from a planar DEXA device (31). When the values measured from lumbar vertebrae were compared with both DEXA and CT, a high correlation was found between them (Table 5).
In some studies (26,27,32), BMI was taken instead of weight. It has been stated that the sensitivity of DEXA may change with the increase of BMI, and this sensitivity would be adversely affected, especially in an obese population. In such a case, it has been stated that measuring volumetric BMD (vBMD) with QCT is advantageous. Therefore, as observed in our study, we concluded that weight should not be considered a stand-alone criterion; BMI should be calculated and more accurate results could be obtained by comparing the results obtained.
In conclusion, it was observed that non-contrast QCT attenuation measurements in lumbar vertebrae in different age groups were effective and compatible with each other in terms of BMD screening, as in DEXA. Our results also show an inverse correlation between the BMD and ages in the study. QCT and DEXA scans have different features. It is known that DEXA is easier to use than QCT but is less sensitive to changes in bone marrow fat. In addition, while a two-dimensional image is obtained using DEXA, a volumetric image is obtained using QCT. It has been shown that the two methods can be used in bone measurement when sorted in terms of such different properties. It should be noted that QCT has a longer imaging time and higher radiation dose compared to DEXA, and unnecessary scans should be avoided. In addition, it was concluded that the weight was not considered as a stand-alone criterion in terms of affecting HU results, but instead BMI measurements were required.
Footnotes
Acknowledgments
The authors thank Hatay Mustafa Kemal University's language editing services.
Data availability
Research records (the patient's radiological or demographic information) will be kept for at least 5 years. Since the study was a retrospective study, the data were taken from the hospital system.
Declaration of conflicting interests
The authors declared no potential conflicts of interest with respect to the research, authorship, and/or publication of this article.
Funding
The authors received no financial support for the research, authorship, and/or publication of this article.
