
Abstract
Background
Extracellular free water (FW) has important roles in the occurrence and development of white matter hyperintensity (WMH).
Purpose
To explore the correlations between FW and WMH burden.
Material and Methods
A prospective analysis was conducted using magnetic resonance imaging (MRI) data from 126 individuals. WMH burden was determined based on WMH volumes and Fazekas scores from deep and periventricular white matter hyperintensity (DWMH and PWMH, respectively) in fluid-attenuated inversion recovery (FLAIR) images. FW values were taken from diffusion tensor imaging (DTI).
Results
Univariate analysis showed that FW values were correlated with WMH burden, including WMH volumes and DWMH and PWMH Fazekas scores (P < 0.05). After multivariate analysis, FW values were correlated with WMH volumes and DWMH and PWMH Fazekas scores when adjusted for age and hypertension (P < 0.05).
Conclusion
Using MRI, increasing extracellular FW was related to WMH burden.
Keywords
Introduction
White matter hyperintensity (WMH) on brain imaging has been identified as an important marker of cerebral small vessel disease (1). WMH has not only been identified as a significant predictor of increased stroke probability (2) but is also associated with gait stability and cognitive dysfunction (3–5). However, the specific pathogenesis of WMH is not well defined. The study of WMH and its associated pathophysiological changes is important in the diagnosis and management of cerebral small vessel disease.
In previous studies, increased extracellular free water (FW) is associated with Alzheimer's disease (AD) and cognitive dysfunction (6,7). Similar to some AD pathogenesis traits, such as blood–brain barrier disruption (8), chronic ischemic injury in cerebral white matter (9), and neuroinflammation (10), these factors may also be associated with WMH development and contribute to increased extracellular FW. In addition, deep collateral venous dysfunction may cause elevated upstream venous pressure (11), which causes poor interstitial fluid stagnation and an increase in extracellular fluid (12). Furthermore, some studies report that high signals on fluid-attenuated inversion recovery (FLAIR) images is also associated with abnormally elevated extracellular FW (13). Therefore, we hypothesize that increased extracellular FW is associated with WMH burden.
Diffusion tensor imaging (DTI) is a non-invasive imaging and postprocessing technology, developed in recent years, and is based on diffusion-weighted imaging to observe and track white matter fiber bundles. There are several ways to postprocess DTI; a more recent diffusion measure is FW, which measures diffusion signal fractions as indicated by isotropically unrestricted water, and estimates values from a regularized bi-tensor model. FW values can reflect extracellular FW levels in brain tissue (14). Therefore, the main purpose of this research is to use multimodal magnetic resonance imaging (MRI) to explore the relationship between increased extracellular FW and WMH burden and determine possible WMH mechanisms.
Material and Methods
Participants
Clinical and imaging data was collected from 126 individuals, who experienced headache, dizziness, sleep disorders, and transient ischemic attack, and who visited our neurology department between March and September 2022. The inclusion criteria were as follows: (i) age > 40 years; (ii) typical WMH presence on FLAIR images; and (iii) the presence of at least one vascular risk factor, such as diabetes, hypertension, smoking, and hyperlipidemia. The exclusion criteria were as follows: (i) severe cerebral artery stenosis or occlusion; (ii) non-ischemic demyelinating lesions (infection, metabolism, genetic factors, etc.); (iii) no WMH on T2 FLAIR images; (iv) the presence of acute infarction, brain tumor, or cerebral hemorrhage; and (v) contraindications to MRI (Fig. 1).
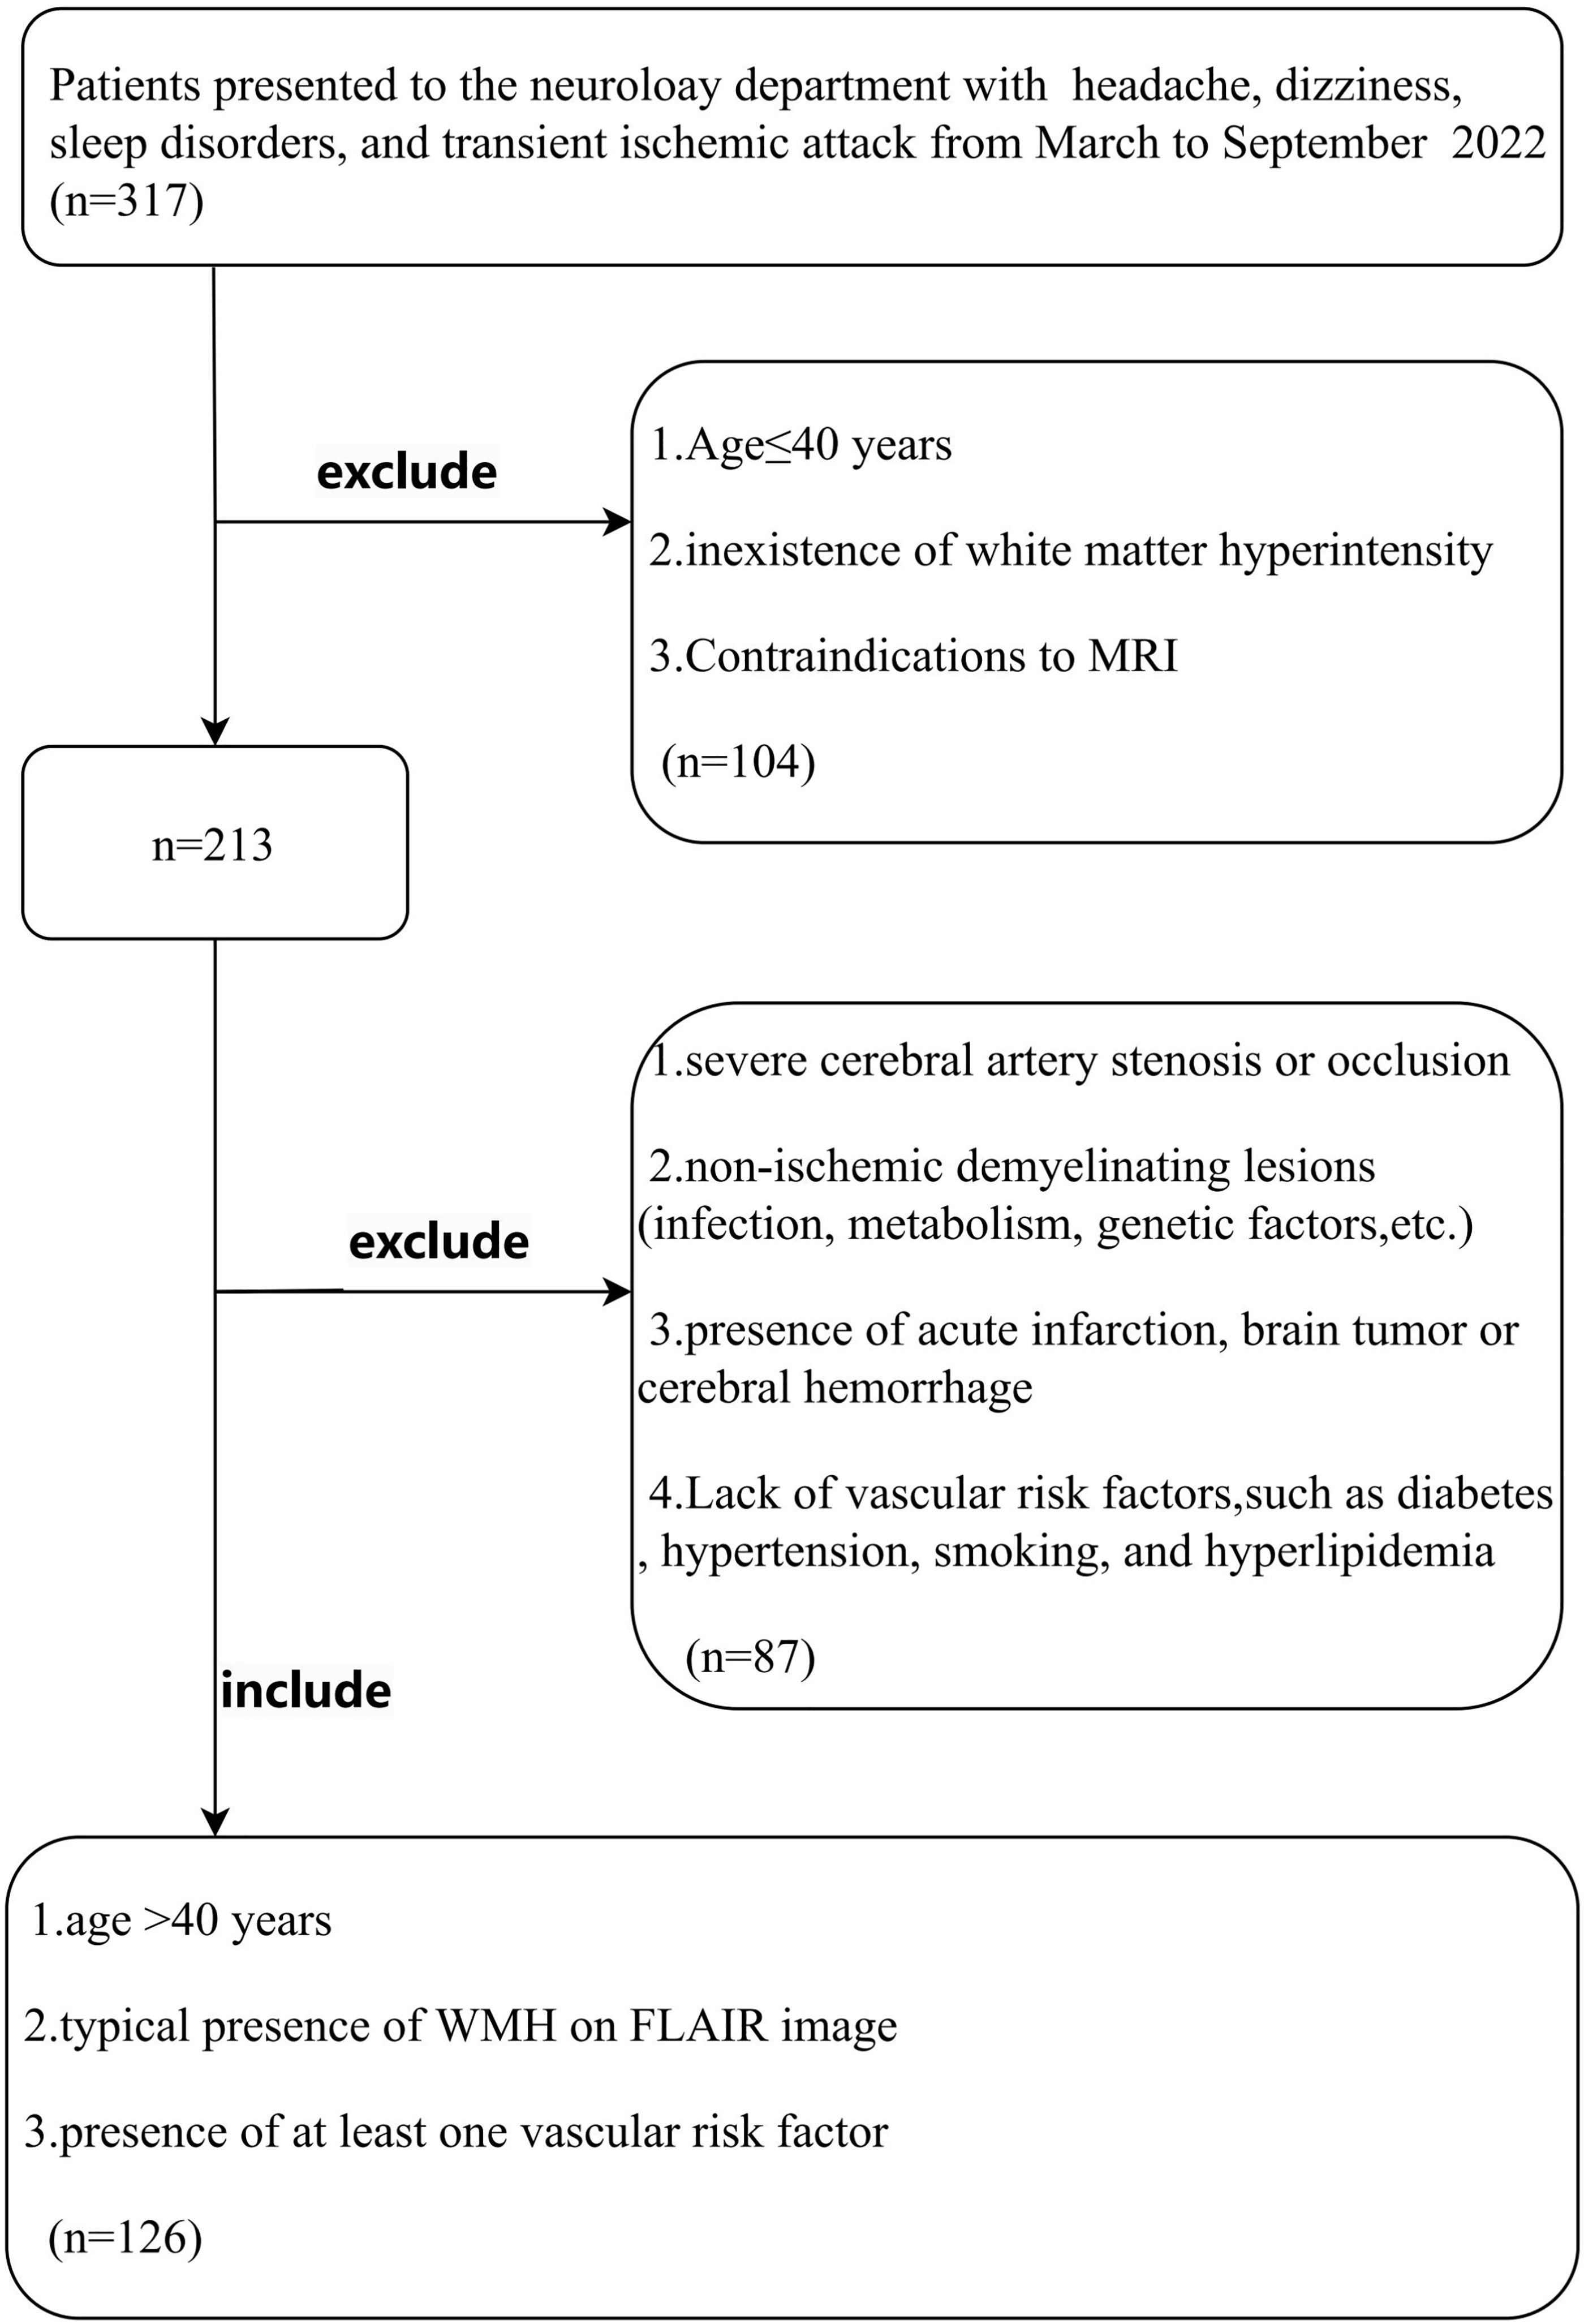
Flow chart showing participant selection in this study.
This study was approved by the Lishui Hospital of Traditional Chinese Medicine affiliated with Zhejiang Chinese Medical University. All the participants signed the informed consent. All clinical studies were conducted in accordance with the principles of the Declaration of Helsinki.
Clinical information
Baseline clinical information was gathered, including sex, age, and vascular risk factors (e.g. smoking, diabetes, hyperlipidemia, and hypertension).
MRI protocol
Multimodal MRI included DTI, three-dimensional (3D) T1-weighted (T1W) imaging, and FLAIR images, and was performed on a 1.5-T scanner (MAGNETOM Aera; Siemens, Erlangen, Germany). FLAIR parameters were as follows: repetition time (TR) = 6500 ms; echo time (TE) = 95 ms; field of view (FOV) = 23 × 23 cm; and matrix = 256 × 256. 3D T1W imaging parameters were as follows: TR = 2000 ms; TE = 2.8 ms; FOV = 23 × 23 cm; and matrix = 256 × 256. DTI parameters were as follows: TR = 3600 ms; TE = 95 ms; FOV = 23 × 23 cm; matrix = 128 × 128; diffusion directions = 30; and b-values = 0, 1,000, and 2000 s/mm2.
WMH Fazekas scores
WMH is defined as abnormal signals in periventricular or deep white matter hyperintensity (PWMH and DWMH, respectively), mainly appearing as high-intensity signals on FLAIR images and equal or low-intensity signals on T1W imaging. PWMH or DWMH Fazekas scores are generally in the range of 0–3 points (Fig. 2) (15).
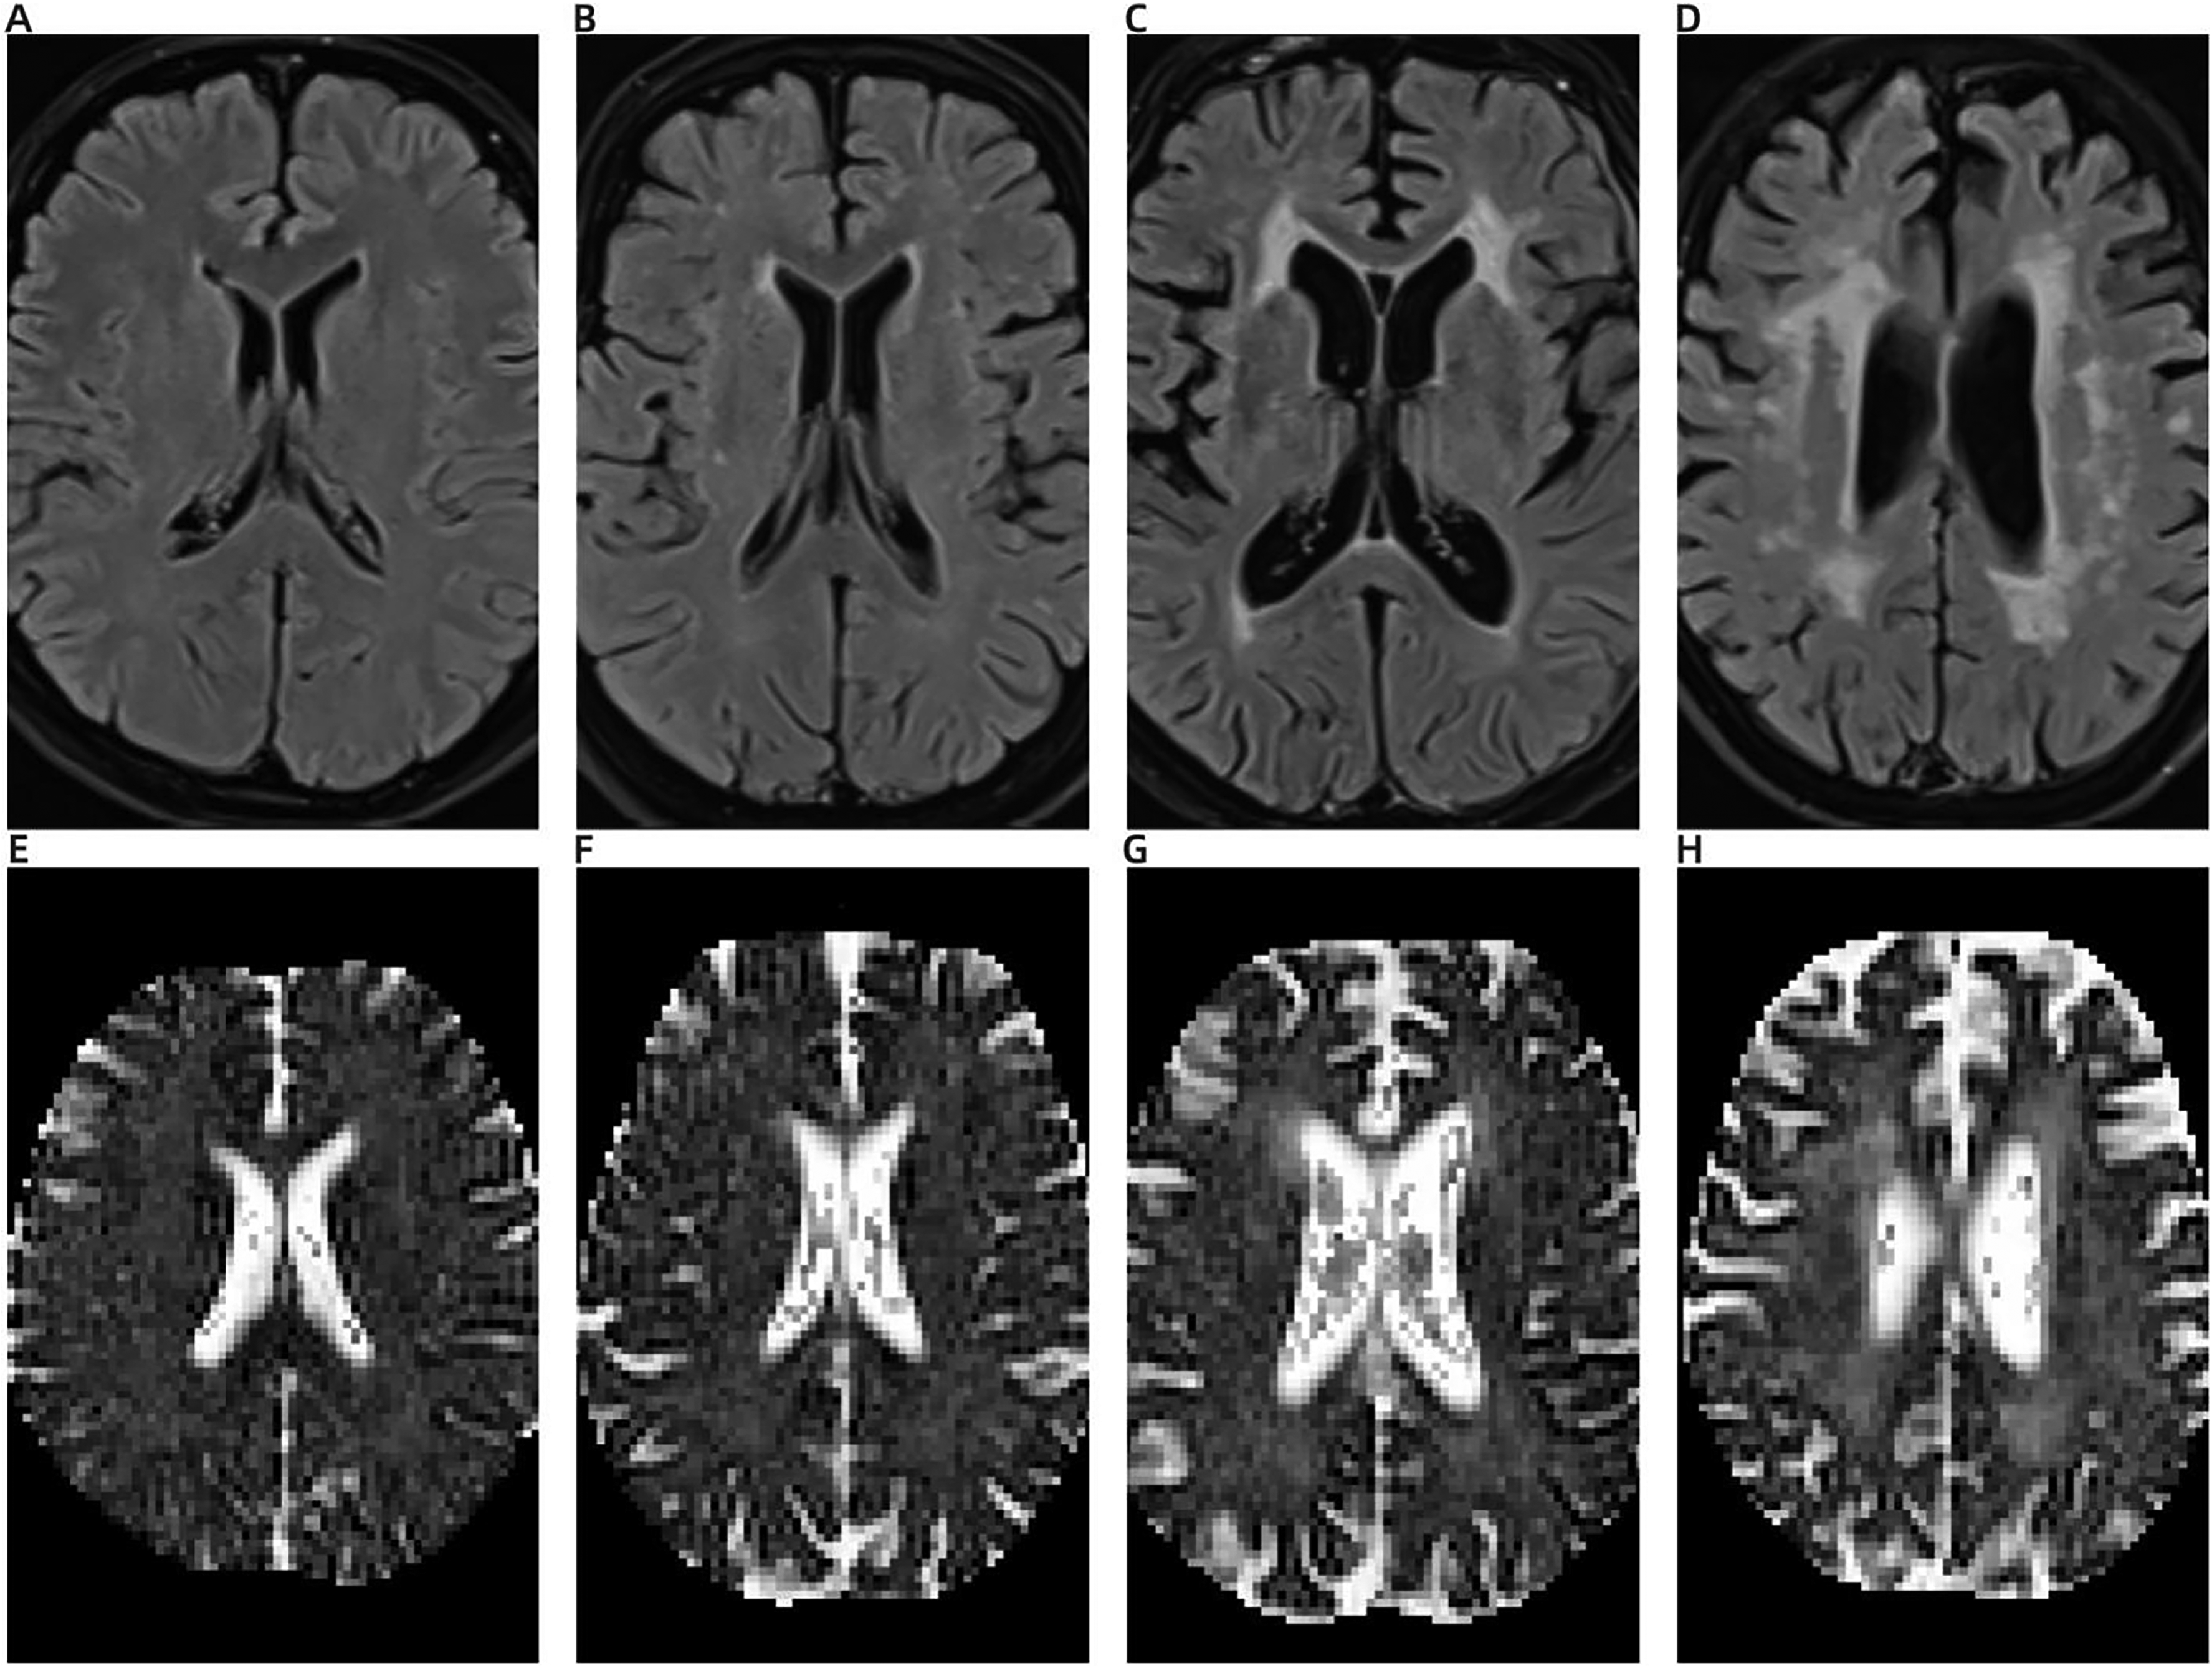
The PWMH Fazekas scoring system and corresponding FW values. (A) No lesion; the PWMH Fazekas score is 0 and the corresponding FW value is 0.21 (E). (B) Cap or pencil-like thin layer high signals; the PWMH Fazekas score is 1 and the corresponding FW value is 0.23 (F). (C) Smooth halo-like high signals; the PWMH Fazekas score is 2 and the corresponding FW value is 0.25 (G). (D) Irregular patchy high signals; the PWMH Fazekas score is 3 and the corresponding FW value is 0.26 (H). FW, free water; PWMH, periventricular white matter hyperintensity.
WMH volumes
WMH volumes were calculated based on FLAIR sequences; images were transferred to NIFTI format using MRIcron software and the skull was stripped using the FSL BET function. Both 3D T1W and FLAIR sequences were fitted and analyzed, and WMH masks were generated using the FSL BIANCA function. A binary WMH mask was obtained using a threshold = 0.5 (16). WMH volumes were calculated after WMH masks were manually corrected by a neuroradiologist using ITK-SNAP software.
FW in white matter
First, DTI images were preprocessed and mainly included denoising, artifact removal, and EPI correction. Next, an extracellular FW map was generated using DIPY software (https://dipy.org/) in a FW elimination two-compartmental model (17). 3D T1W images were further registered to a b = 0 (b0) image. For each participant, average white matter FW was determined using a white matter mask segmented by co-registered 3D T1W images using the FSL FAST function (Fig. 3). FW values ranged from 0 to 1 and corresponded to extracellular FW content, with larger values reflecting larger extracellular FW levels.
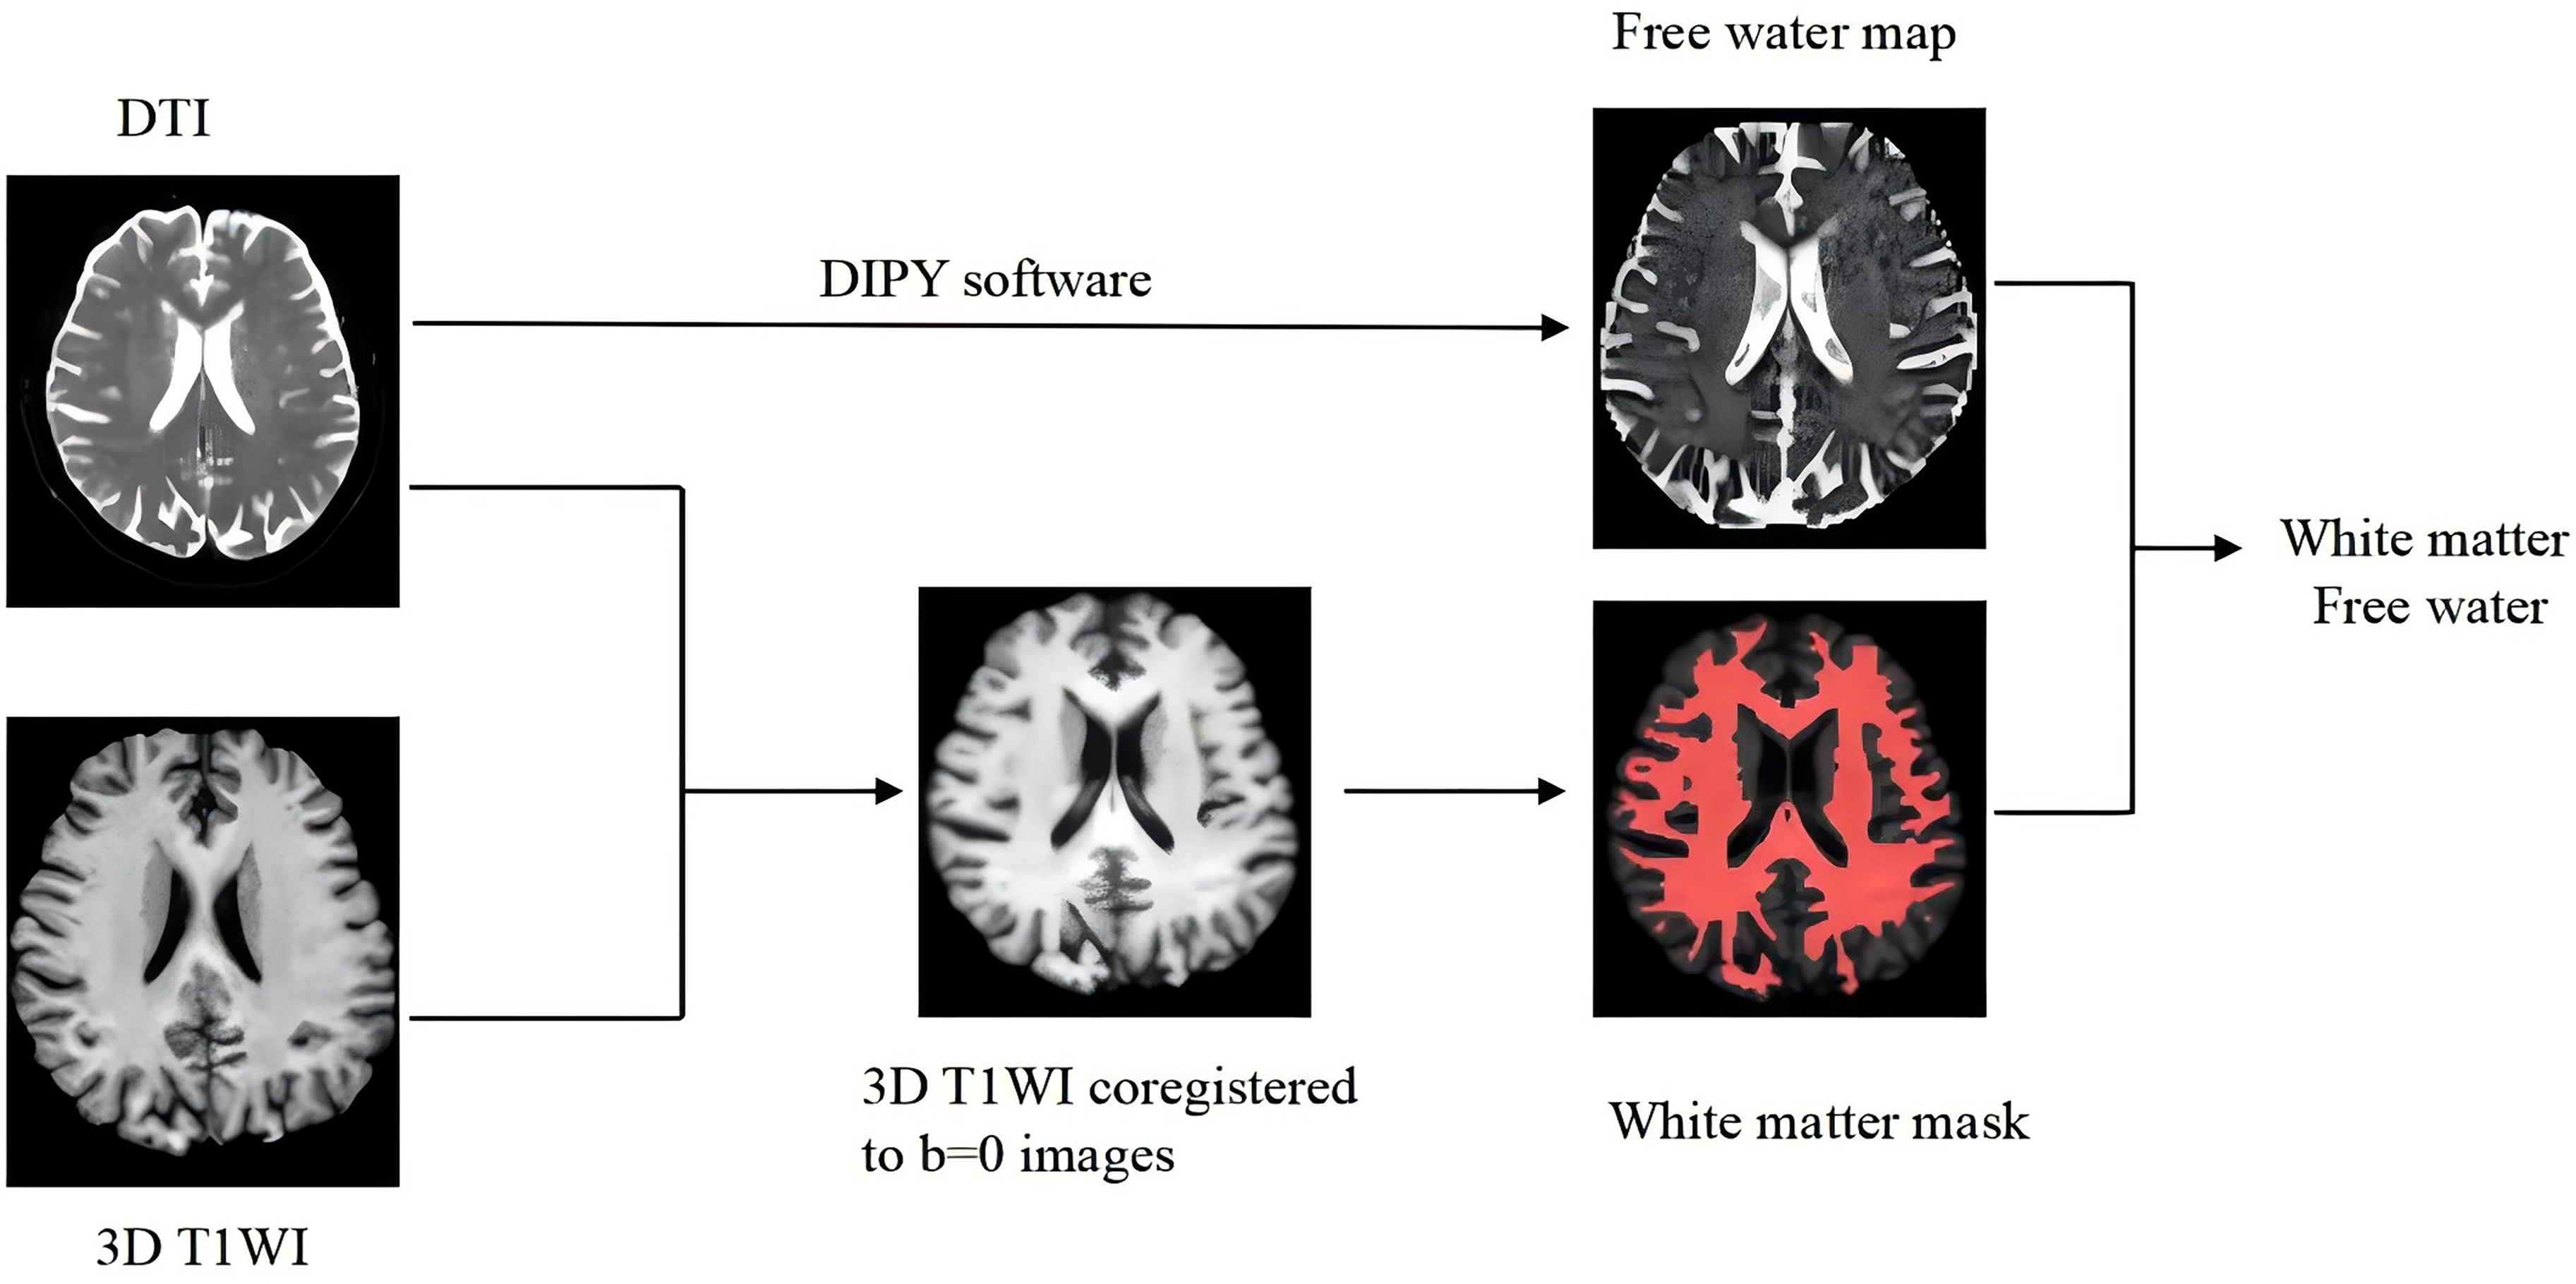
Illustration of processing pipeline of image registration, generation of white matter mask, and free water map.
Statistical analysis
Categorical variables were described by percentage, normally distributed variables were described as means ± standard deviations (SD), and non-normal variables were described by median (interquartile range [IQR]). During the research process, ordinal regression analysis was conducted on variables to determine the relationship between clinical indicators and FW in PWMH and DWMH patient groups. The relationships between clinical profiles and FW and WMH volumes were checked through linear regression analysis. Factors with a threshold value of P < 0.2 in univariate analysis were then tested in multivariate analysis to identify independent risk factors for WMH burden. Statistical analyses were conducted using SPSS version 20 (SPSS Inc., Chicago, IL, USA), with P < 0.05 indicating statistical significance.
Results
Baseline characteristics
We used MRI data from 126 individuals (59 men [46.8%]; mean age = 59.6 ± 11.5 years). In our cohort, 67 (53.2%) patients had hypertension, 21 (17.7%) had diabetes, 34 (27.0%) had hyperlipidemia, and 29 (23.0%) were smokers. The mean WMH volume was 12.16 ± 12.66 mL and the mean FW value was 0.24 ± 0.01 (Table 1).
Baseline characteristics of the included participants.
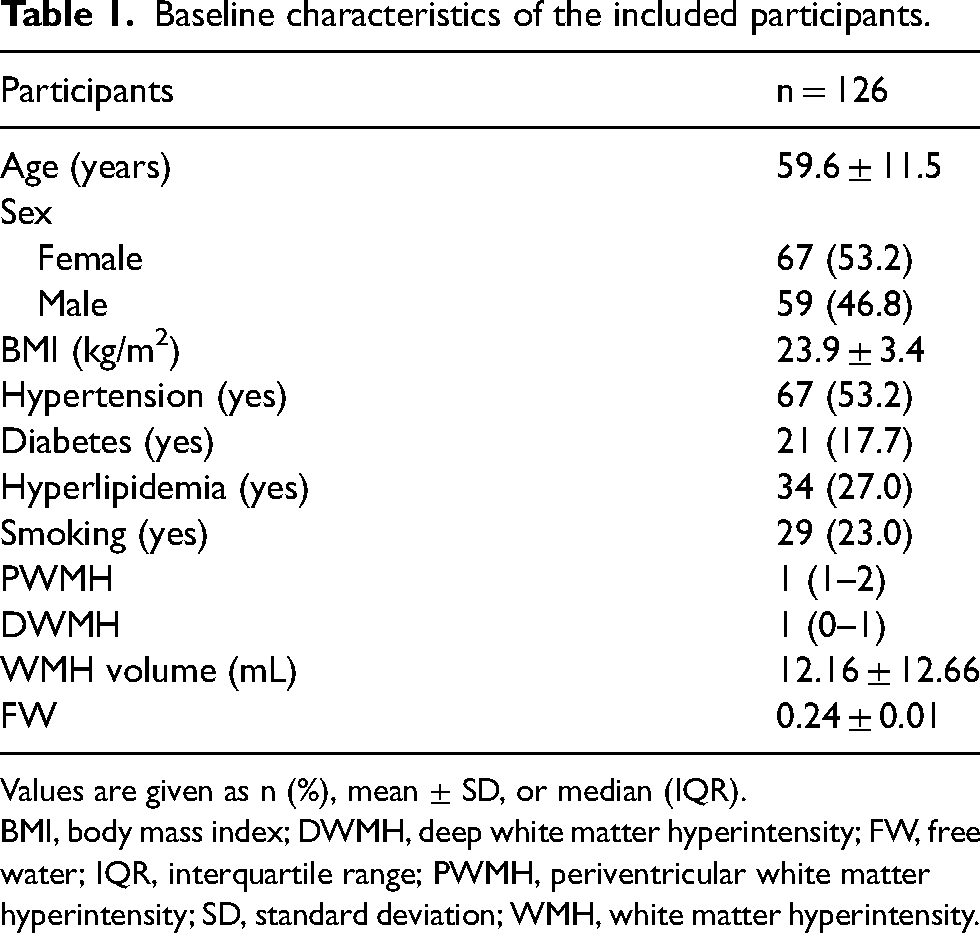
Values are given as n (%), mean ± SD, or median (IQR).
BMI, body mass index; DWMH, deep white matter hyperintensity; FW, free water; IQR, interquartile range; PWMH, periventricular white matter hyperintensity; SD, standard deviation; WMH, white matter hyperintensity.
FW and Fazekas scores for PWMH
In univariate analysis, the PWMH Fazekas score correlated with the FW value, age, and hypertension (P < 0.05), but was not associated with diabetes, sex, hyperlipidemia, and smoking (P > 0.05). After ordinal regression analyses, FW values were correlated with PWMH Fazekas scores when adjusted for age and hypertension (P < 0.05) (Table 2).
Univariate and multivariate analysis of factors influencing the periventricular white matter hyperintensity Fazekas score.
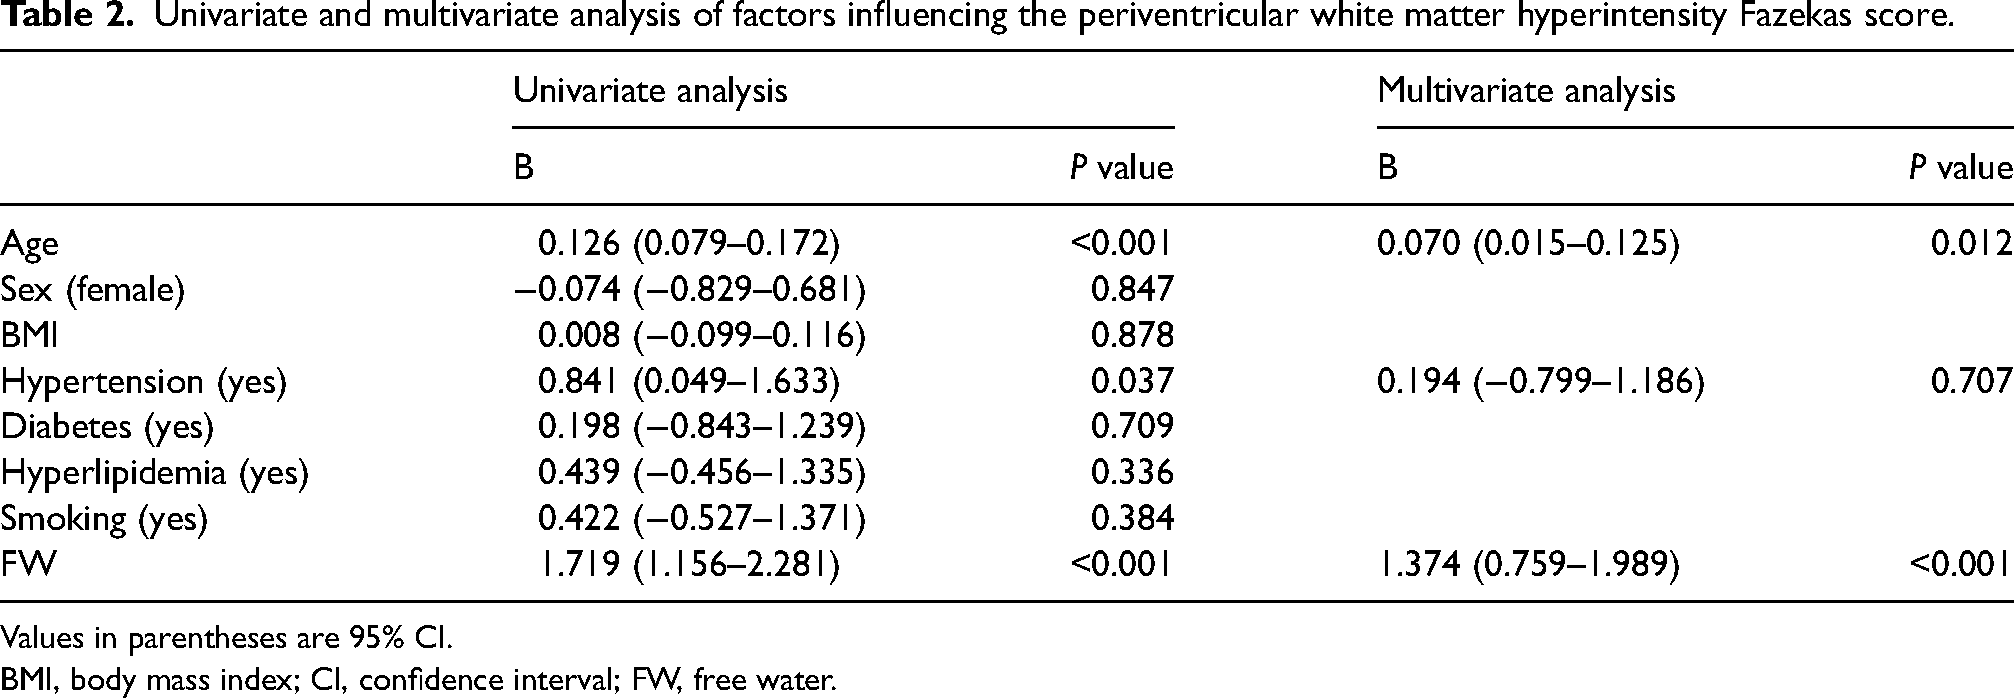
Values in parentheses are 95% CI.
BMI, body mass index; CI, confidence interval; FW, free water.
FW and Fazekas scores for DWMH
Univariate analysis showed that the DWMH Fazekas score was correlated with the FW value, age, and hypertension (P < 0.05), but not with diabetes, sex, hyperlipidemia, and smoking (P > 0.05). After ordinal regression analyses, FW values were correlated with DWMH Fazekas scores when adjusted for age and hypertension (P < 0.05) (Table 3).
Univariate and multivariate analysis of factors influencing the deep white matter hyperintensity Fazekas score.
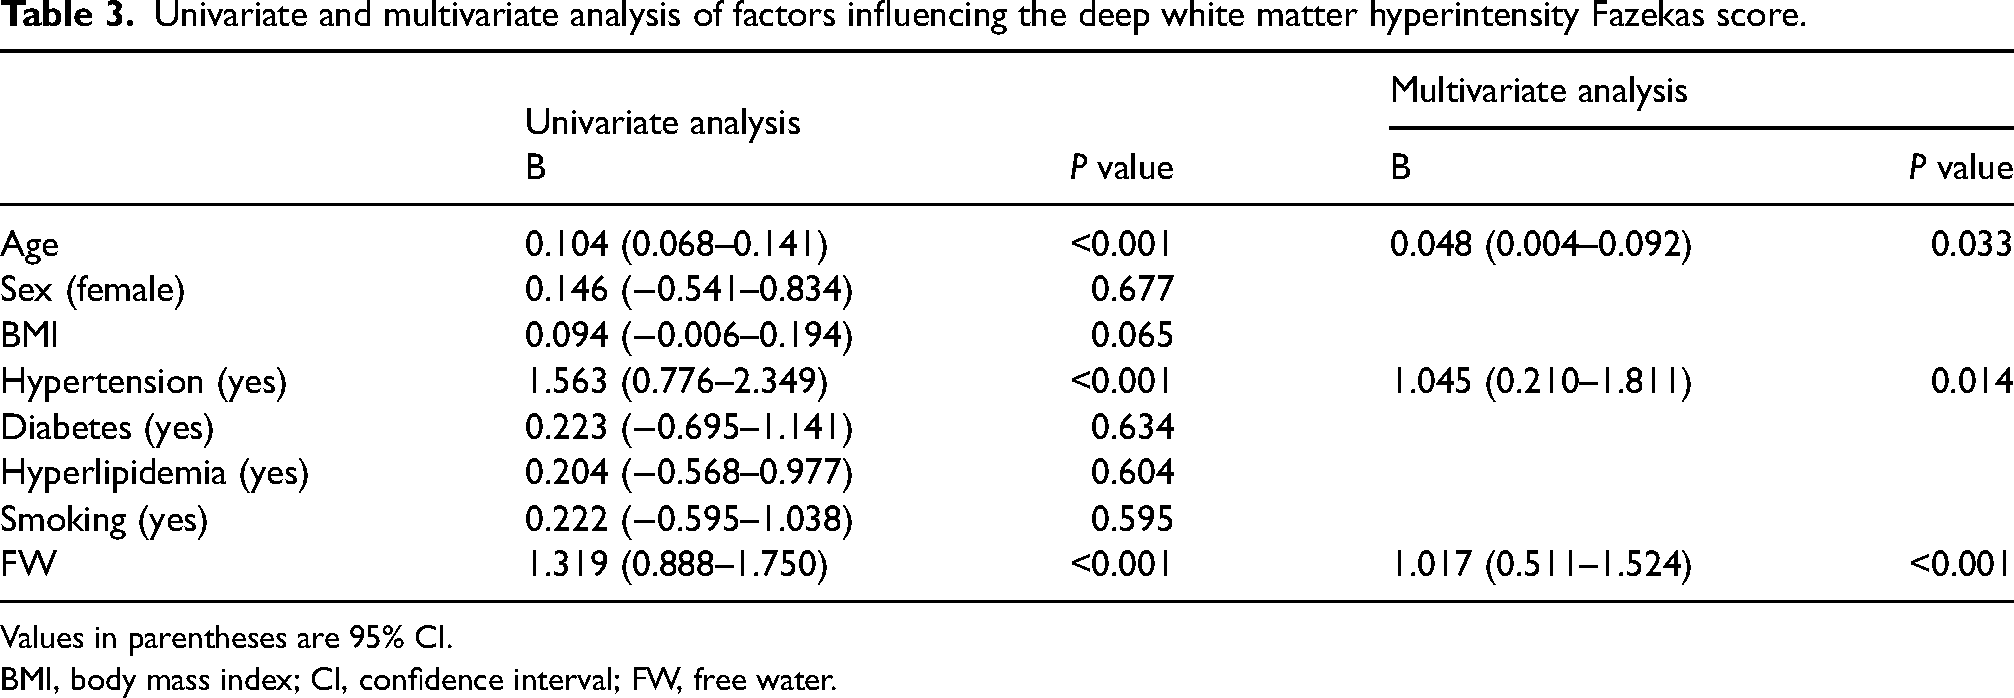
Values in parentheses are 95% CI.
BMI, body mass index; CI, confidence interval; FW, free water.
FW and WMH volumes
After univariate analysis, WMH volumes were associated with age and the FW value (P < 0.05), but showed no relationship with hypertension, sex, diabetes, smoking, and hyperlipidemia (P > 0.05). After linear regression analyses, FW values were correlated with WMH volumes when adjusted for age and hypertension (P < 0.05) (Table 4).
Univariate and multivariate analysis of factors influencing white matter hyperintensity volumes.
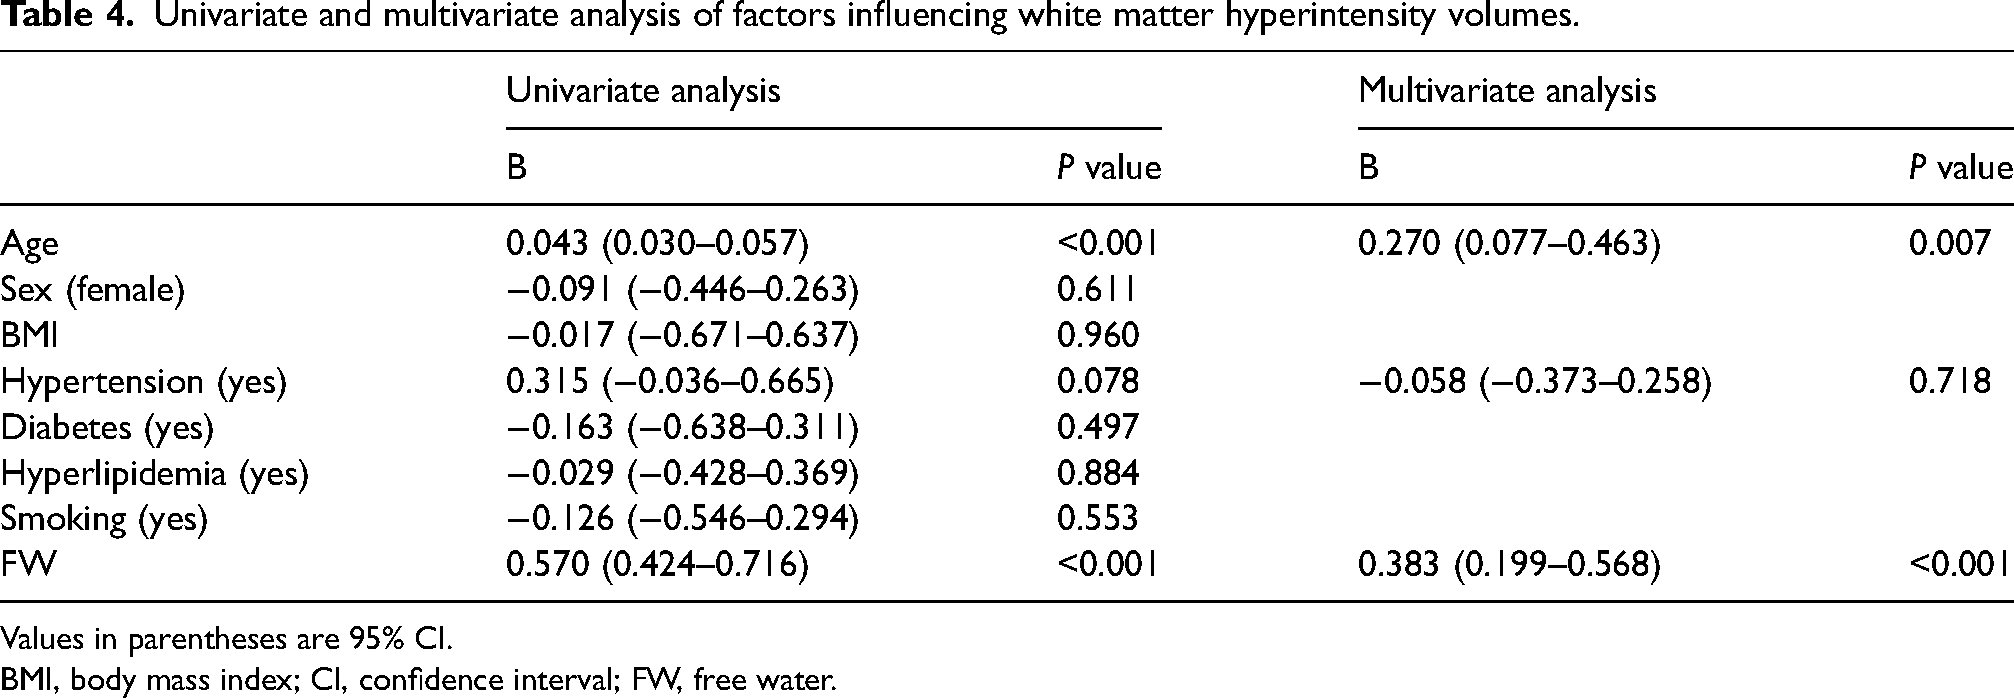
Values in parentheses are 95% CI.
BMI, body mass index; CI, confidence interval; FW, free water.
Discussion
From our analysis, FW values are not only correlated with DWMH and PWMH Fazekas scores, but also with increased WMH volumes. Thus, in our cohort, increased extracellular FW is correlated with WMH severity, and may be involved in WMH progression.
WMH is an imaging finding. By MRI, WMH is mainly located around lateral ventricles and manifests as low intensity signals on T1W imaging and high-signal shadows on FLAIR images (18). Based on MRI principles, we speculate that these findings reflect collected water volumes. Specifically, the greater the water volume, the greater the range of signal abnormalities on FLAIR images. However, previous research (19) also indicated that microstructural changes are already present in white matter, even from normal MRI signals. We selected whole-brain white matter FW as the study object because it more accurately predicted PWMH and DWMH pathogenesis.
Increased extracellular FW mechanisms in WMH are complex, with arteriovenous dysfunction speculated as one putative cause. Arterial stiffness increases with advancing age and is influenced by vascular risk factors. Such increased vascular stiffness subjects microvessels to increased pulsatile energy, which in turn alters capillary wall pressure and causes blood–brain barrier dysfunction, ultimately pushing more fluid into the interstitium (20). In terms of the venous system, deep medullary vein dysfunction has essential roles in WMH (21,22). Long-term deep medullary vein narrowing increases vascular permeability, which allows more lytic materials to enter the interstitium. In addition, increased venous pressure may lead to increased resistance to cerebrospinal fluid (CSF) absorption and increased CSF leakage into the interstitium (22).
Dysfunction of the glymphatic system also causes an increase in extracellular FW accumulation. The glymphatic system removes metabolic waste by exchanging CSF with the interstitial fluid (23,24). When the glymphatic system is dysfunctional, increased impedance leads to a diminished exchange of CSF between the vascular and the interstitial spaces and an abnormal fluid build-up in the perivascular space. Because of the decreased exchange of CSF and interstitial fluid, hazardous metabolites, such as αβ protein and plasma protein, are cleared less effectively. These plasma proteins are toxic to myelin and axons, leading to neuroinflammatory reactions and additional increases in cerebral interstitial fluid volumes (25).
The relationship between dysfunction of the arteriovenous and glymphatic systems and the pathogenesis of WMH has been studied (24,26). Although the exact pathophysiological mechanism is unclear, we hypothesized that increased extracellular FW may mediate this relationship. Initial increases in extracellular FW, caused by arteriovenous and glymphatic dysfunction, may trigger mildly interstitial edema in white matter that may lead to microenvironment changes and do not affect performance on the MRI signal. With aggravated arteriovenous and lymphatic system dysfunction, brain interstitial fluid volumes are further increased. The greater the interstitial fluid volume, the greater the range of signal abnormalities on FLAIR images and the higher the WMH burden. This may involve WMH pathogenesis, but this will be the focus of future research.
The present study has some limitations. First, it was a single-institution study with a relatively small sample size. Future studies should include data from multiple centers. Second, long-term follow-up is necessary to clarify the dynamic relationship between changes in extracellular FW and the WMH burden, even the occurrence of stroke or cognitive impairment.
In conclusion, increased extracellular FW volumes are associated with WMH burden, which is the comprehensive reaction of different pathophysiology of WMH.
Footnotes
Declaration of conflicting interests
The authors declared no potential conflicts of interest with respect to the research, authorship, and/or publication of this article.
Funding
The authors disclosed receipt of the following financial support for the research, authorship, and/or publication of this article: This study was jointly supported by State Administration of Traditional Chinese Medicine and Zhejiang Administration of Traditional Chinese Medicine (grant no. GZY-ZJ-KJ-23097) and Commonwealth Science and Technology Program of Lishui City (grant no. 2021ZDYF16).