



Abstract
Background
Giving contrast material before 1H-magnetic resonance spectroscopy (MRS) could enhance the precision of locating the lesion of interest. However, evidence indicates that contrast material might influence the outcomes of MRS.
Purpose
To verify the effect of gadolinium-based contrast agent (GBCA) on MRS in normal white matter.
Material and Methods
A total of 34 patients were referred for brain magnetic resonance imaging (MRI) with GBCAs, and they underwent single-volume MRS before and after administering contrast material. Those patients had the MRS voxel placed at the right frontal normal white matter, which remained consistent across all examinations. Measurements were taken for the integral concerning N-acetyl aspartate (NAA), choline (Cho), creatine (Cr and Cr2), and myo-inositol (Ins) in all examinations.
Results
NAA (P = 0.0313) and Cho (P = 0.0094) had a significant decrease in their integral after intravenous GBCA administration. No significant differences were found between the pre- and post-contrast MRS studies for Cr, Cr2, and Ins.
Conclusion
Intravenous GBCA can alter NAA and Cho integrals in normal white matter. Therefore, brain 1H-MRS should precede intravenous GBCA administration to avoid the potential impact of contrast material on peak integrals.
Introduction
The use of 1H-magnetic resonance spectroscopy (MRS) in clinical settings has increased due to the wider availability of commercial software and the possibility of reimbursement (1). Some theoretical and experimental evidence suggests that MRS should be performed before contrast administration to avoid the effect of gadolinium on metabolite peaks (2). On the other hand, other authors propose that MRS should be done after administering gadolinium (3). Abnormal enhancement after contrast administration can help localize the lesions of interest. Therefore, in many cases, it would be advantageous to perform MRS after contrast administration (3,4). The aim of the present study was to investigate whether administering gadolinium-based contrast agents (GBCAs) influences the metabolite peaks of MRS in the normal brain area.
Material and Methods
Participants
A total of 34 participants who underwent brain contrast-enhanced MRI were recruited. The exclusion criteria included large, abnormal lesions in the frontal lobes or nearby regions, which may affect the MRS sampling.
The study was conducted in accordance with the Declaration of Helsinki (as revised in 2013). The study was approved by the Ethics Committee of the University of Medicine and Pharmacy, Hue University, Vietnam. Approval number: H2023/478. All patients gave written informed consent.
MRS protocol
The examinations were conducted using a Siemens Magnetom Amira 1.5 T system (Siemens Healthcare, Erlangen, Germany) equipped with the standard 1H-MRS acquisition software Syngovia E11 provided by the manufacturer. The 16-channel head/neck coil was used to acquire the MRI/MRS signal.
Single-volume spin-echo point-resolved spectroscopy was employed for all patients, with parameters set as follows: repetition time (TR) = 1500 ms; echo time (TE) = 30 ms; and an average of 128 (Table 1). Patients were scanned in a headfirst supine position. Anatomic sequences were performed following an institutional standard protocol, and the localizer image for the MRS voxel was chosen from the anatomic images. Details on each sequence's duration are given in Table 2.
SVS sequences parameters.
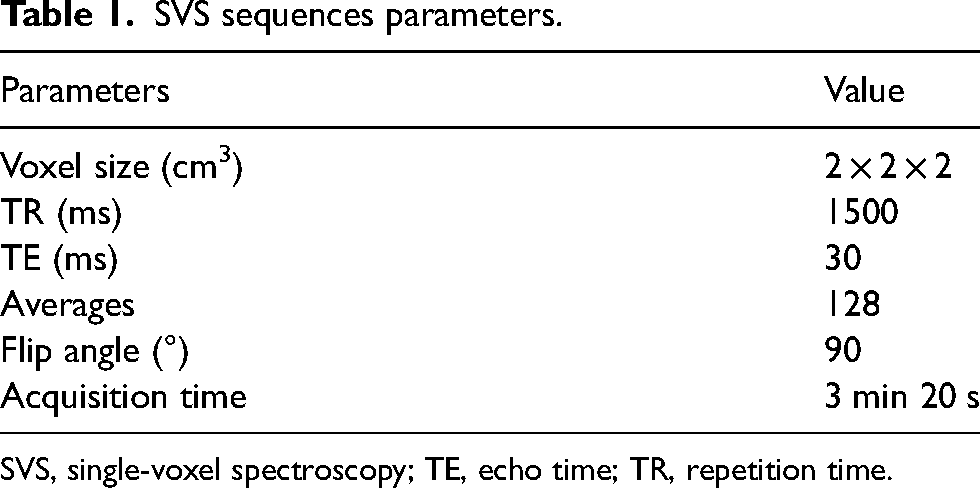
SVS, single-voxel spectroscopy; TE, echo time; TR, repetition time.
The approximate delay between GBCA administration and the start of the MRS sequence.

GBCA, gadolinium-based contrast agent; IV, intravenous; MRS, magnetic resonance spectroscopy; SVS, single-voxel spectroscopy; T1W, T1-weighted.
Regions of interest (ROIs) measuring 2 × 2 × 2 cm (8 cm3) were meticulously placed at the right frontal normal white matter. To ensure consistency, the MRS sequence used for the pre-contrast examination was replicated for the post-contrast acquisition, maintaining identical voxel positioning between the pre- and post-contrast measurements as long as the patient remained stationary. The MRS voxel was surrounded by six saturation bands to optimize the shimming and water suppression (Fig. 1).

MRS voxel planned at the right frontal lobe surrounded by six saturation bands. The MRS voxel was placed in the right frontal normal white matter using a series of localizing images: T1W in the sagittal plane (left), FLAIR in the coronal plane (middle), and T2W in the axial plane (right). FLAIR, fluid-attenuated inversion recovery; MRS, magnetic resonance spectroscopy; T1W, T1-weighted; T2W, T2-weighted.
A rapid bolus injection of 0.1 mmol/kg of GBCAs (Gadovist; Bayer Pharma AG, Leverkusen, Germany) was administered, followed immediately by a 20-mL saline flush through a contrast injector at a rate of 2.5 mL/s. Motion artifacts on the imaging acquisitions were monitored. Image subtractions were performed between the last imaging sequence at the end of the study and the initial imaging sequence (obtained just before spectroscopic measurements) to detect any potential patient movement during the examination. Patients showing signs of motion were excluded from our study.
The examinations were conducted before and after the intravenous administration of GBCAs. On average, the post-contrast MRS scan started 5 min after the intravenous GBCA administration (Table 3). For all data acquisition, water suppression was conducted utilizing a series of three chemical-shift-selective pulses with predefined flip angles, aiming to retain a considerable amount of residual water in the spectrum. Then, high-order shim was applied, followed by automatic local shim adjustment. Linewidths (full width at half maximum [FWHM]) and water suppression levels were recorded.
Pre- and post-contrast metabolite integrals.

Cho, choline; Cr, creatine; Cr2, creatine second peak; Ins, myo-inositol; NAA, N-acetyl aspartate.
Statistical analysis
Wilcoxon signed-rank tests were employed to compare the metabolite integral and linewidth between pre- and post-contrast MRS. In all statistical tests, P < 0.05 was considered indicative of statistically significant differences. The analyses were conducted using GraphPad Prism version 9.5.0 (GraphPad Software, San Diego, CA, USA).
Results
The study involved 34 participants (17 men, 17 women; median age = 53.4 years; age range = 16–83 years).
After the brain MRI evaluation, 24/34 (70.6%) participants exhibited no evidence of brain metastasis. The remaining 10 (29.4%) had some form of abnormality in areas other than the frontal lobes.
The metabolites assessed in this study were N-acetyl aspartate (NAA), choline (Cho), creatine (Cr) and creatine second peak (Cr2), and myo-inositol (Ins) (Fig. 2). Metabolite integrals are listed in Table 3. Table 4 further illustrates the observed alterations in metabolite linewidth measured by MRS.

MRS voxel placement and the metabolites integral of pre-contrast (left) and post-contrast (right) from the same region in the right frontal lobe. MRS, magnetic resonance spectroscopy.
The MRS metabolites linewidth before and after intravenous GBCA administration.

P value according to the Wilcoxon signed-rank test. The values in bold is the one that statistically significant.
Cho, choline; Cr, creatine; Cr2, creatine second peak; GBCA, gadolinium-based contrast agent; Ins, myo-inositol; MRS, magnetic resonance spectroscopy; NAA, N-acetyl aspartate.
NAA and Cho
Our study found a significant post-contrast reduction in the integral values of NAA and Cho after the administration of GBCAs. Compared to pre-contrast levels, mean NAA integrals showed a statistically significant decrease from 47.75 ± 6.02 to 45.69 ± 6.68 (P = 0.0313). Similarly, mean Cho integrals significantly reduced from 19.44 ± 3.76 to 18.79 ± 3.81 (P = 0.0094) (Table 5, Fig. 3). Our study also found that after the administration of GBCA, there was a statistically significant increase in the linewidth of both NAA and Cho metabolites (Table 4, Fig. 4). Specifically, the mean NAA linewidth increased from 6.85 ± 1.46 to 7.19 ± 1.56 (P = 0.0041), while the mean Cho linewidth increased from 5.72 ± 1.00 to 6.32 ± 1.84 (P = 0.0060).
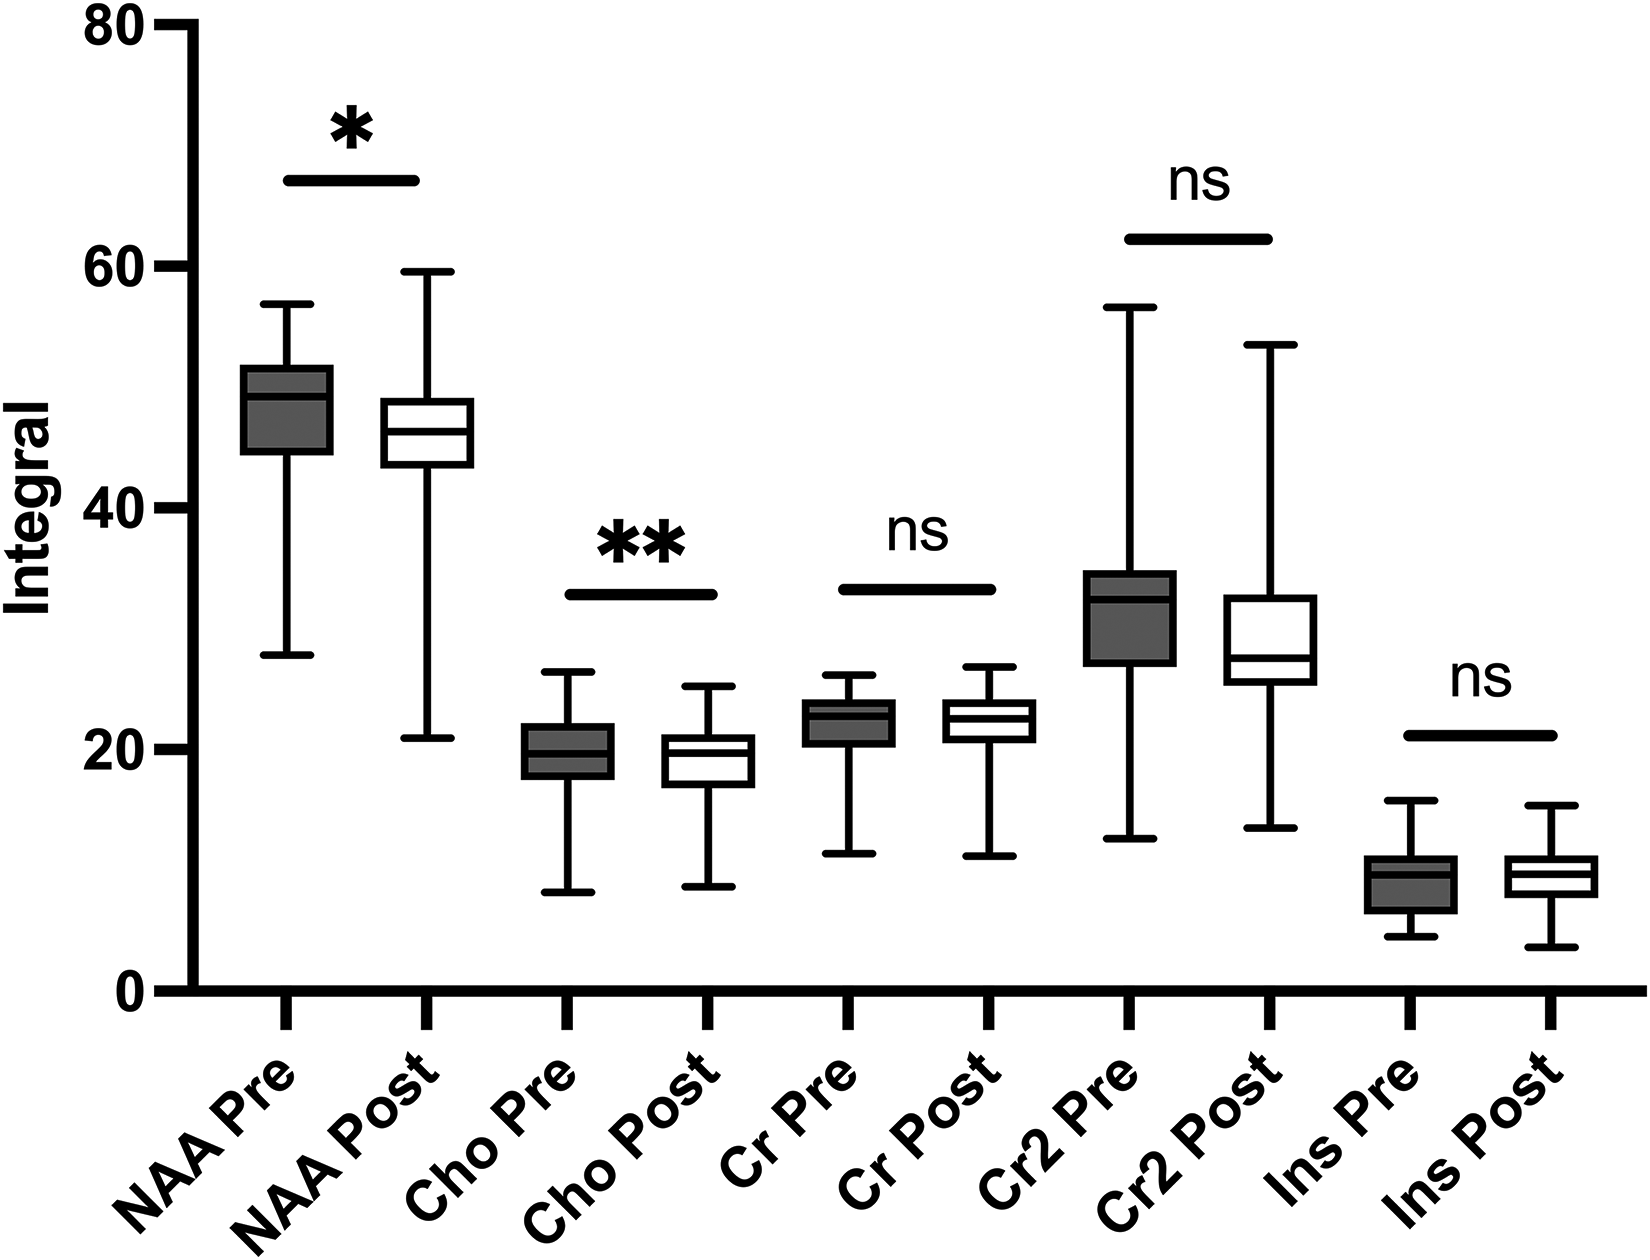
The MRS metabolites integral before and after intravenous gadolinium administration (n = 34). NAA and Cho showed significant changes (*P < 0.05 and **P < 0.01); Cr, Cr2, and Ins showed no significant changes. P value according to the Wilcoxon signed-rank test. Cho, choline; Cr, creatine; Cr2, creatine second peak; Ins, myo-inositol; MRS, magnetic resonance spectroscopy; NAA, N-acetyl aspartate; ns, non-significant.
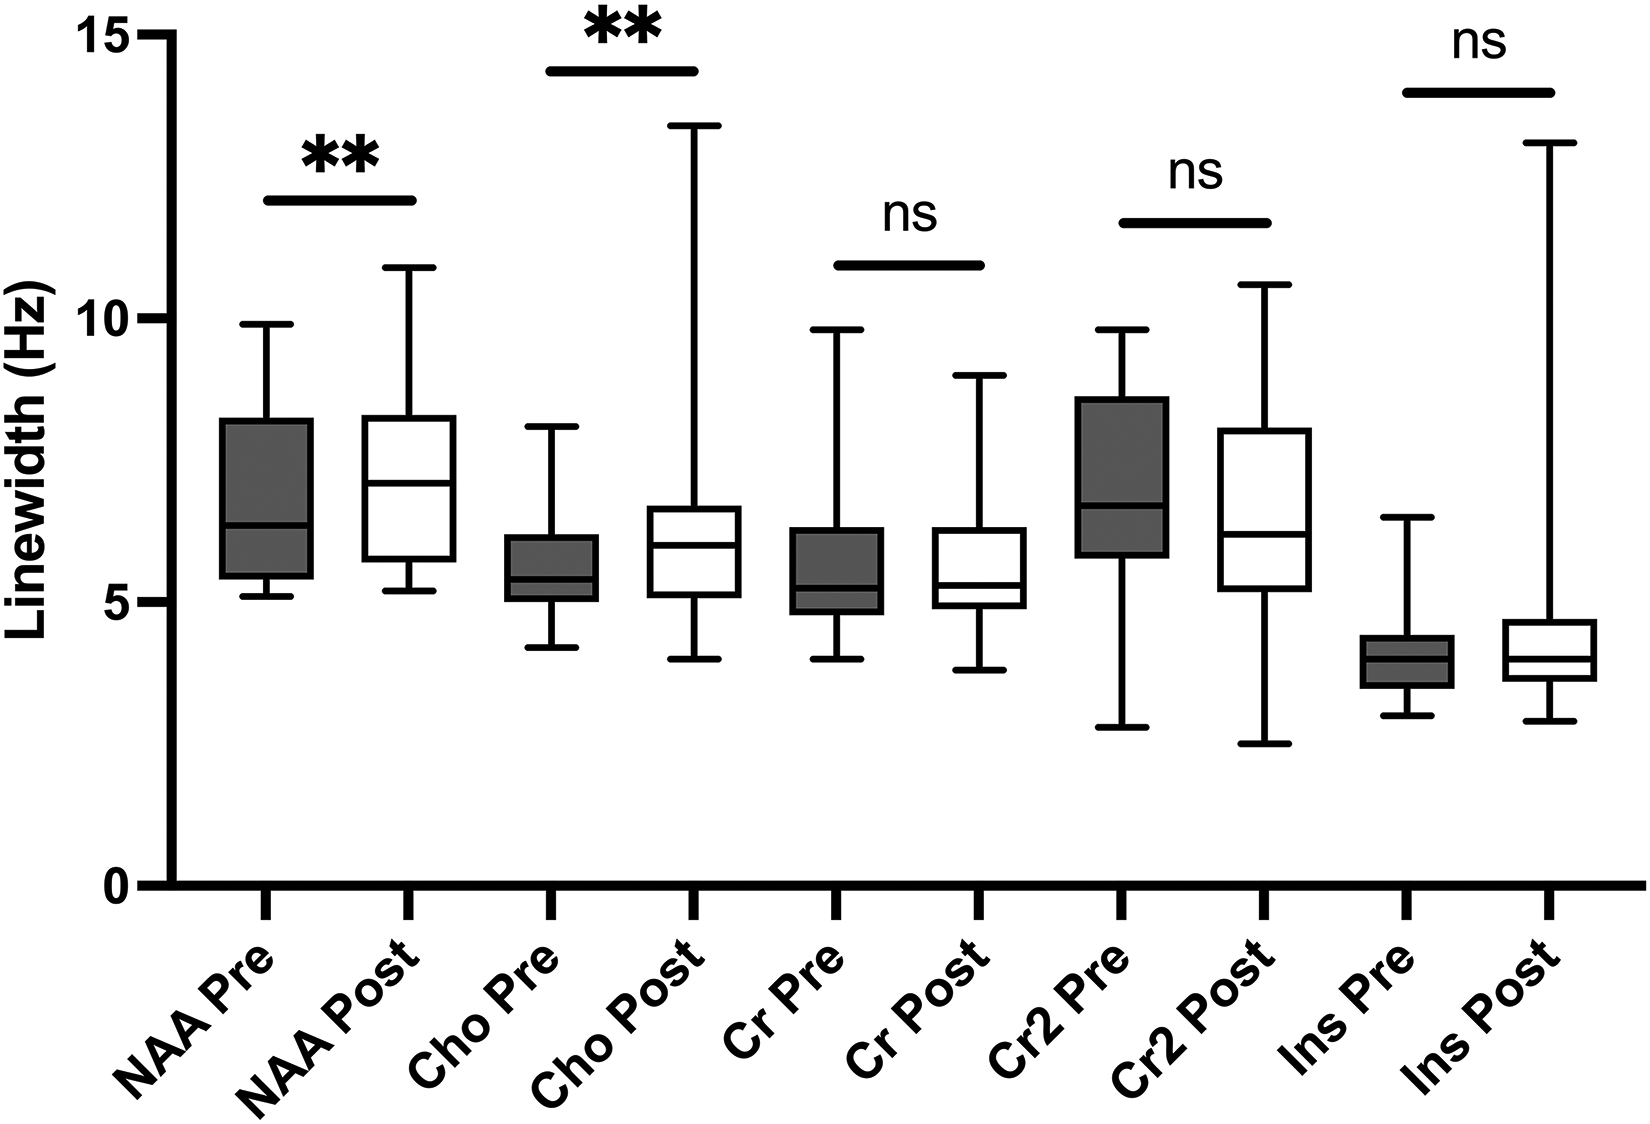
The MRS metabolites linewidth before and after intravenous gadolinium administration (n = 34). NAA and Cho showed significant changes (**P < 0.01); Cr, Cr2, and Ins showed no significant changes. P value according to the Wilcoxon signed-rank test. Cho, choline; Cr, creatine; Cr2, creatine second peak; Ins, myo-inositol; MRS, magnetic resonance spectroscopy; NAA, N-acetyl aspartate; ns, non-significant.
The MRS metabolite integrals before and after intravenous GBCA administration.

P value according to the Wilcoxon signed-rank test. The values in bold is the one that statistically significant.
Cho, choline; Cr, creatine; Cr2, creatine second peak; GBCA, gadolinium-based contrast agent; Ins, myo-inositol; MRS, magnetic resonance spectroscopy; NAA, N-acetyl aspartate.
Cr, Cr2, and Ins
In contrast to the significant reductions seen in NAA and Cho, the levels of Cr, Cr2, and Ins measured using 1H-MRS did not show statistically significant changes after the administration of GBCA. Compared to pre-contrast levels, these metabolites showed no significant difference (P > 0.05): Cr (21.88 ± 3.36 vs. 21.92 ± 3.39; P = 0.4085); Cr2 (30.02 ± 8.89 vs. 31.98 ± 9.67; P = 0.0594); and Ins (9.30 ± 2.80 vs. 9.28 ± 2.85; P = 0.3903) (Table 5, Fig. 3). Moreover, linewidth measurements of these metabolites did not reveal any significant alterations after the administration of GBCA (Table 4, Fig. 4).
Discussion
Our study, which utilized brain MR spectroscopy on 34 patients, observed a decrease in NAA and Cho peak integrals after the intravenous administration of gadolinium. Our findings are in line with those of previous studies (2,5). Using GBCAs in MRI for enhanced tissue visualization can introduce artifacts in MRS. This is due to susceptibility-induced distortions in local magnetic fields caused by GBCAs. As seen in our study, these distortions lead to a broadening of spectral lines, resulting in a perceived decrease in metabolite peak integrals, such as NAA and Cho. However, this broadening effect affects metabolites differently, with Cho being relatively more susceptible than other metabolites due to differences in their inherent T2 relaxation times (6). Metabolites with shorter T2 relaxation times experience more line broadening due to increased interaction with the fluctuating magnetic field caused by gadolinium.
The broadening of spectral lines can have complex effects, causing peaks to decrease (e.g. NAA and Cho) and overlap with neighboring peaks, particularly those with shorter T2 relaxation times. In our study:
- NAA and Cho: the broadening of their peaks may have overlapped with baseline noise or neighboring peaks, leading to an apparent decrease in their integral values. - Cr, Cr2, and Ins: metabolites with longer T2 relaxation times may be less susceptible to the broadening effect. Their broader peaks due to gadolinium might partially overlap with baseline or neighboring peaks, creating a false impression of an increase in their integral values (convolution effect).
It is essential to note that the observed decrease does not indicate actual changes in brain chemistry in healthy individuals, as GBCAs typically do not cross the intact blood–brain barrier in healthy individuals (7). Thus, the observed reduction likely reflects the impact of gadolinium on the MR signal rather than underlying metabolic abnormalities. This underscores the importance of considering the potential confounding effects of GBCAs when interpreting spectroscopic data, especially at longer TEs where the broadening effect is more pronounced.
While Cho typically shows elevated levels in brain tumor MRS due to high cell turnover, using gadolinium contrast in MRI scans can decrease the Cho peak (6). Our study noted a decrease in Cho and NAA in healthy brains after administration of gadolinium, suggesting that brain 1H-MRS before administering GBCAs may be preferable to avoid a possible reduction of detectable metabolites.
The present study has some limitations. First, it only examined single-volume spectroscopy of the brain in the right frontal lobe, limiting generalizability to other brain regions with potentially different metabolic profiles and effects of gadolinium. Second, the study included a relatively small sample size of 34 patients, affecting the generalizability of findings to a larger population. Moreover, the study participants were patients referred for MRI instead of healthy individuals. Lastly, the effects of intravenous GBCAs were only assessed 5 min after administration, which left the long-term impact of GBCAs on brain MRS metabolites unknown. For future phases of this study, we recommend employing multi-voxel MR spectroscopy to assess NAA and Cho levels in various brain regions for a more comprehensive understanding of gadolinium effects across diverse brain areas. Furthermore, conducting the study with a larger sample size would enhance generalizability and strengthen conclusions regarding gadolinium's impact. Investigating the long-term effects of gadolinium administration on brain metabolites through longitudinal studies could provide insights into any delayed consequences. In addition, exploring spectroscopic correction techniques and postprocessing methods to address gadolinium-induced artifacts may help compensate for the broadening effect. Finally, researching alternative GBCAs with different chelating properties to assess their impact on spectroscopic data acquisition is a promising future direction. Alternative GBCAs with reduced susceptibility-induced distortion may offer more reliable spectroscopic data acquisition.
In conclusion, intravenous GBCAs can alter NAA and Cho integrals in normal white matter. Future research with multi-voxel analysis and larger cohorts is needed for a more definitive picture.
Footnotes
Acknowledgments
This work was supported by Hue University under the Core Research Program (Grant No. NCM.DHH.2020.09).
Declaration of conflicting interests
The authors declared no potential conflicts of interest with respect to the research, authorship, and/or publication of this article.
Funding
The authors received no financial support for the research, authorship, and/or publication of this article.
