




Abstract
Background
This study utilized quantitative susceptibility mapping (QSM) to evaluate magnetic susceptibility of brain nuclei in Parkinson's disease (PD).
Purpose
To explore iron deposition patterns in PD and ascertain if these patterns can distinguish between motor subtypes.
Material and Methods
This study enrolled 30 healthy controls and 34 patients with PD categorized mainly into postural instability and gait disorder (PIGD) (n = 12) and tremor dominance (TD) (n = 16). A total of 18 regions of interest were delineated, and a comprehensive classification of nuclei was conducted, including the differentiation of globus pallidus (GP) into its external (GPe) and internal (GPi) segments. All participants underwent brain magnetic resonance imaging.
Results
Notable differences in magnetic susceptibility were identified in bilateral substantia nigra pars reticulate (SNr) and substantia nigra pars compacta (SNc) between PD and HC. Significant differences in QSM values of bilateral GPe, SNr, and SNc-R were found between TD and PIGD. The susceptibility values of bilateral putamen (PUT) were positively correlated with MDS-UPDRSIII score and Hoehn–Yahr scale in PD. QSM values of bilateral PUT and SNc-L showed associations with MDS-UPDRSIII score in TD. QSM values showed associations with MDS-UPDRSIII in bilateral PUT and Hoehn–Yahr scale in PUT-L and TH-L in PIGD.
Conclusion
Pathologic iron deposition exhibits variability across nuclei of PD, with age also influencing this distribution. SN may be meaningful in identifying different subtypes of PD, such as differentiating PD from HC in the future.
Introduction
Parkinson's disease (PD) is the second most prevalent neurodegenerative disorder and is characterized by considerable heterogeneity in its etiology and pathogenesis (1). It can be categorized, according to the Movement Disorders Society—Unified Parkinson's Disease Rating Scale (MDS-UPDRS), into three subtypes: tremor dominant (TD); postural instability and gait disturbance dominant (PIGD); and indeterminate (IM) (1–3). Emerging research indicates that motor symptom-based classifications could impact the progression of motor phenotypes in the later stages of the disease (4,5). Consequently, distinguishing between these motor subtypes presents a considerable challenge for clinicians and researchers, crucial for directing clinical diagnosis and therapeutic decision-making.
The primary pathological feature of PD is the degeneration of dopaminergic neurons in the nigrostriatal system, a process intricately linked to iron deposition (6,7). Dysregulation of iron levels may induce neuronal degeneration and apoptosis (8,9). Specifically in PD, aberrant iron metabolism is a recognized pathogenic mechanism, leading to the degeneration of dopaminergic neurons in the substantia nigra pars compacta (SNc) (10). This degeneration is exacerbated by iron-induced dopamine oxidative stress and α-synuclein protein aggregation (2,8,11). The consequent neuronal loss leads to a reduction in striatal dopaminergic functionality. Numerous studies supported by autopsy findings have confirmed the presence of excessive iron deposition in the brains of individuals with PD (12–16). Quantitative susceptibility mapping (QSM) emerged as a superior technology in brain MRI, possessing higher sensitivity to iron deposition and better resolution than R2 and R2* mapping (17). QSM provides a clearer reflection of the polarization degree of local tissues within the magnetic field and effectively filters out background field disturbances that affect magnetic susceptibility (18,19). The primary objective is to ascertain if QSM can yield quantitative parameters capable of effectively distinguishing between motor subtypes of PD, thereby facilitating earlier diagnosis and more precise therapeutic interventions for patients with PD.
Material and Methods
Participants
This study enrolled a total of 34 patients diagnosed with PD and 30 healthy controls (HC), forming the PD and HC groups, respectively. Participants were recruited at our hospital between June 2020 and December 2022. Comprehensive data including sex, age, motor symptoms, and various assessment scales were collected for all participants. The study was approved by the Ethics Committee of Hulunbuir People's Hospital (Ethical Clearance Reference No. 2020syy-105). All participants provided written informed consent before participating.
Inclusion criteria
The inclusion criteria were as follows: (i) all participants met the 2016 Chinese diagnostic criteria for PD (20); (ii) disease staging adhered to the modified Hoehn–Yahr scale for grading PD; (iii) the severity of bilateral limb symptoms in PD was evaluated using the MDS-UPDRS, Part III score; and (iv) all participants were right-handed.
Exclusion criteria
The exclusion criteria were as follows: (i) patients who had organic brain diseases such as head trauma, stroke, or brain tumors; (ii) central nervous system infections; (iii) metabolic disorders, including hypothyroidism, folic acid, vitamin B12 deficiencies; (iv) neuropsychiatric disorders, such as depression, anxiety disorders, and schizophrenia; and (v) participants exposed to antidopaminergic medications.
Scale evaluation and grouping
In alignment with methodologies established in previous research (21), the categorization of this study is based on the TD/PIGD ratio of the MDS-UPDRS (8,21). Participants were classified into the TD group if their TD/PIGD ratio was ≥1.15. Conversely, a ratio of ≤0.9 led to classification within the PIGD group. Individuals with a ratio in the range of 0.9–1.15 were identified as intermediate (IM). In addition, patients who scored 0 on the PIGD component were assigned to the TD group, whereas those with a TD score of 0 were assigned to the PIGD group (8). Consequently, the final cohort comprised 16 individuals in the TD group, 12 in the PIGD group, and six in the IM group.
Postprocessing
Images were acquired by a 3-T SIGNA Pioneer MRI machine (GE Healthcare, Milwaukee, WI, USA). Participants lay flat on the examination table, with their heads positioned in an eight-channel head and neck coil and were immobilized with pads tucked into their ears. In addition to the conventional sequences (T1W, T2W, and T2-FLAIR imaging), a QSM sequence was included with the parameters presented in Table 1. All images were read by two experienced radiologists.
Parameter of QSM.
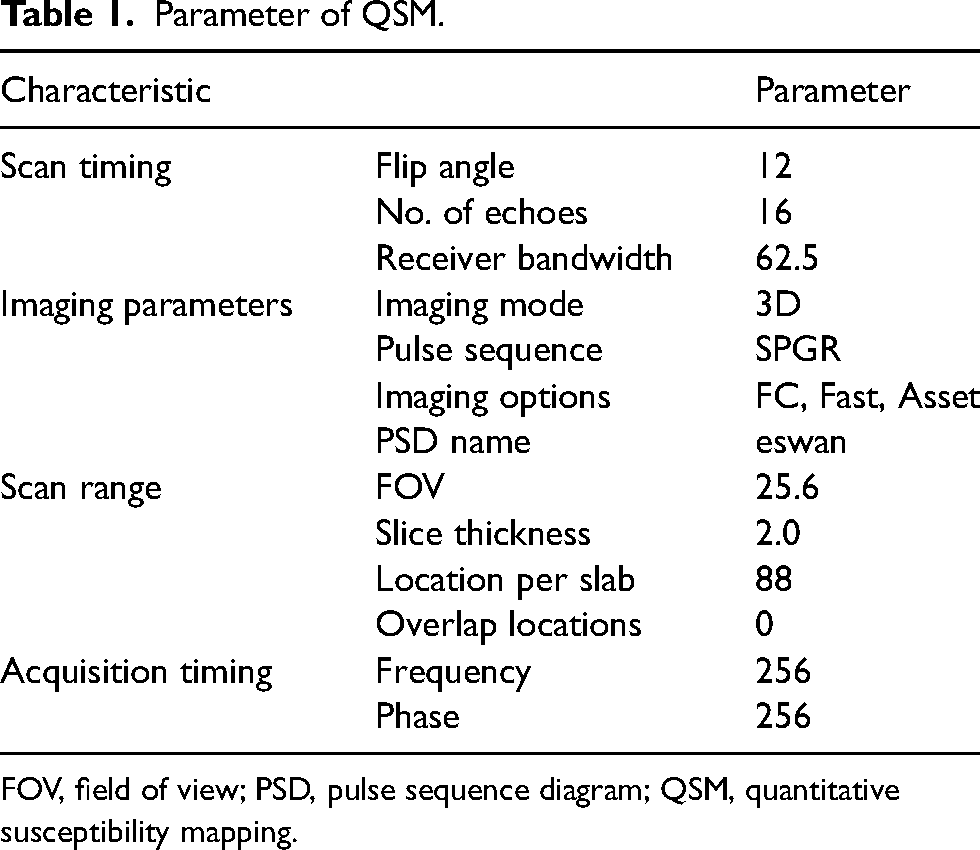
FOV, field of view; PSD, pulse sequence diagram; QSM, quantitative susceptibility mapping.
The GRE magnitude and phase images acquired by the MRI scanner were postprocessed using Matlab R2017a, with the open source package STISuite installed, to obtain QSM images. The latter images were then imported into 3D Slicer 5.2.2 software, where two radiologists manually drew the region of interest (ROIs). The ROI included bilateral caudate nucleus (CN), putamen (PUT), external globus pallidus (GPe), internal globus pallidus (GPi), thalamus (TH), substantia nigra pars reticulate (SNr), substantia nigra pars compacta (SNc), red nucleus (RN), and dentate nucleus (DN). Fig. 1 shows an example of an ROI drawn by a radiologist of a patient. Each of the nuclei's sides was prefixed with “L” for left or “R” for right. Then, the necessary information was extracted from the “segment statistics” section of the 3D Slicer, including QSM value and volume.
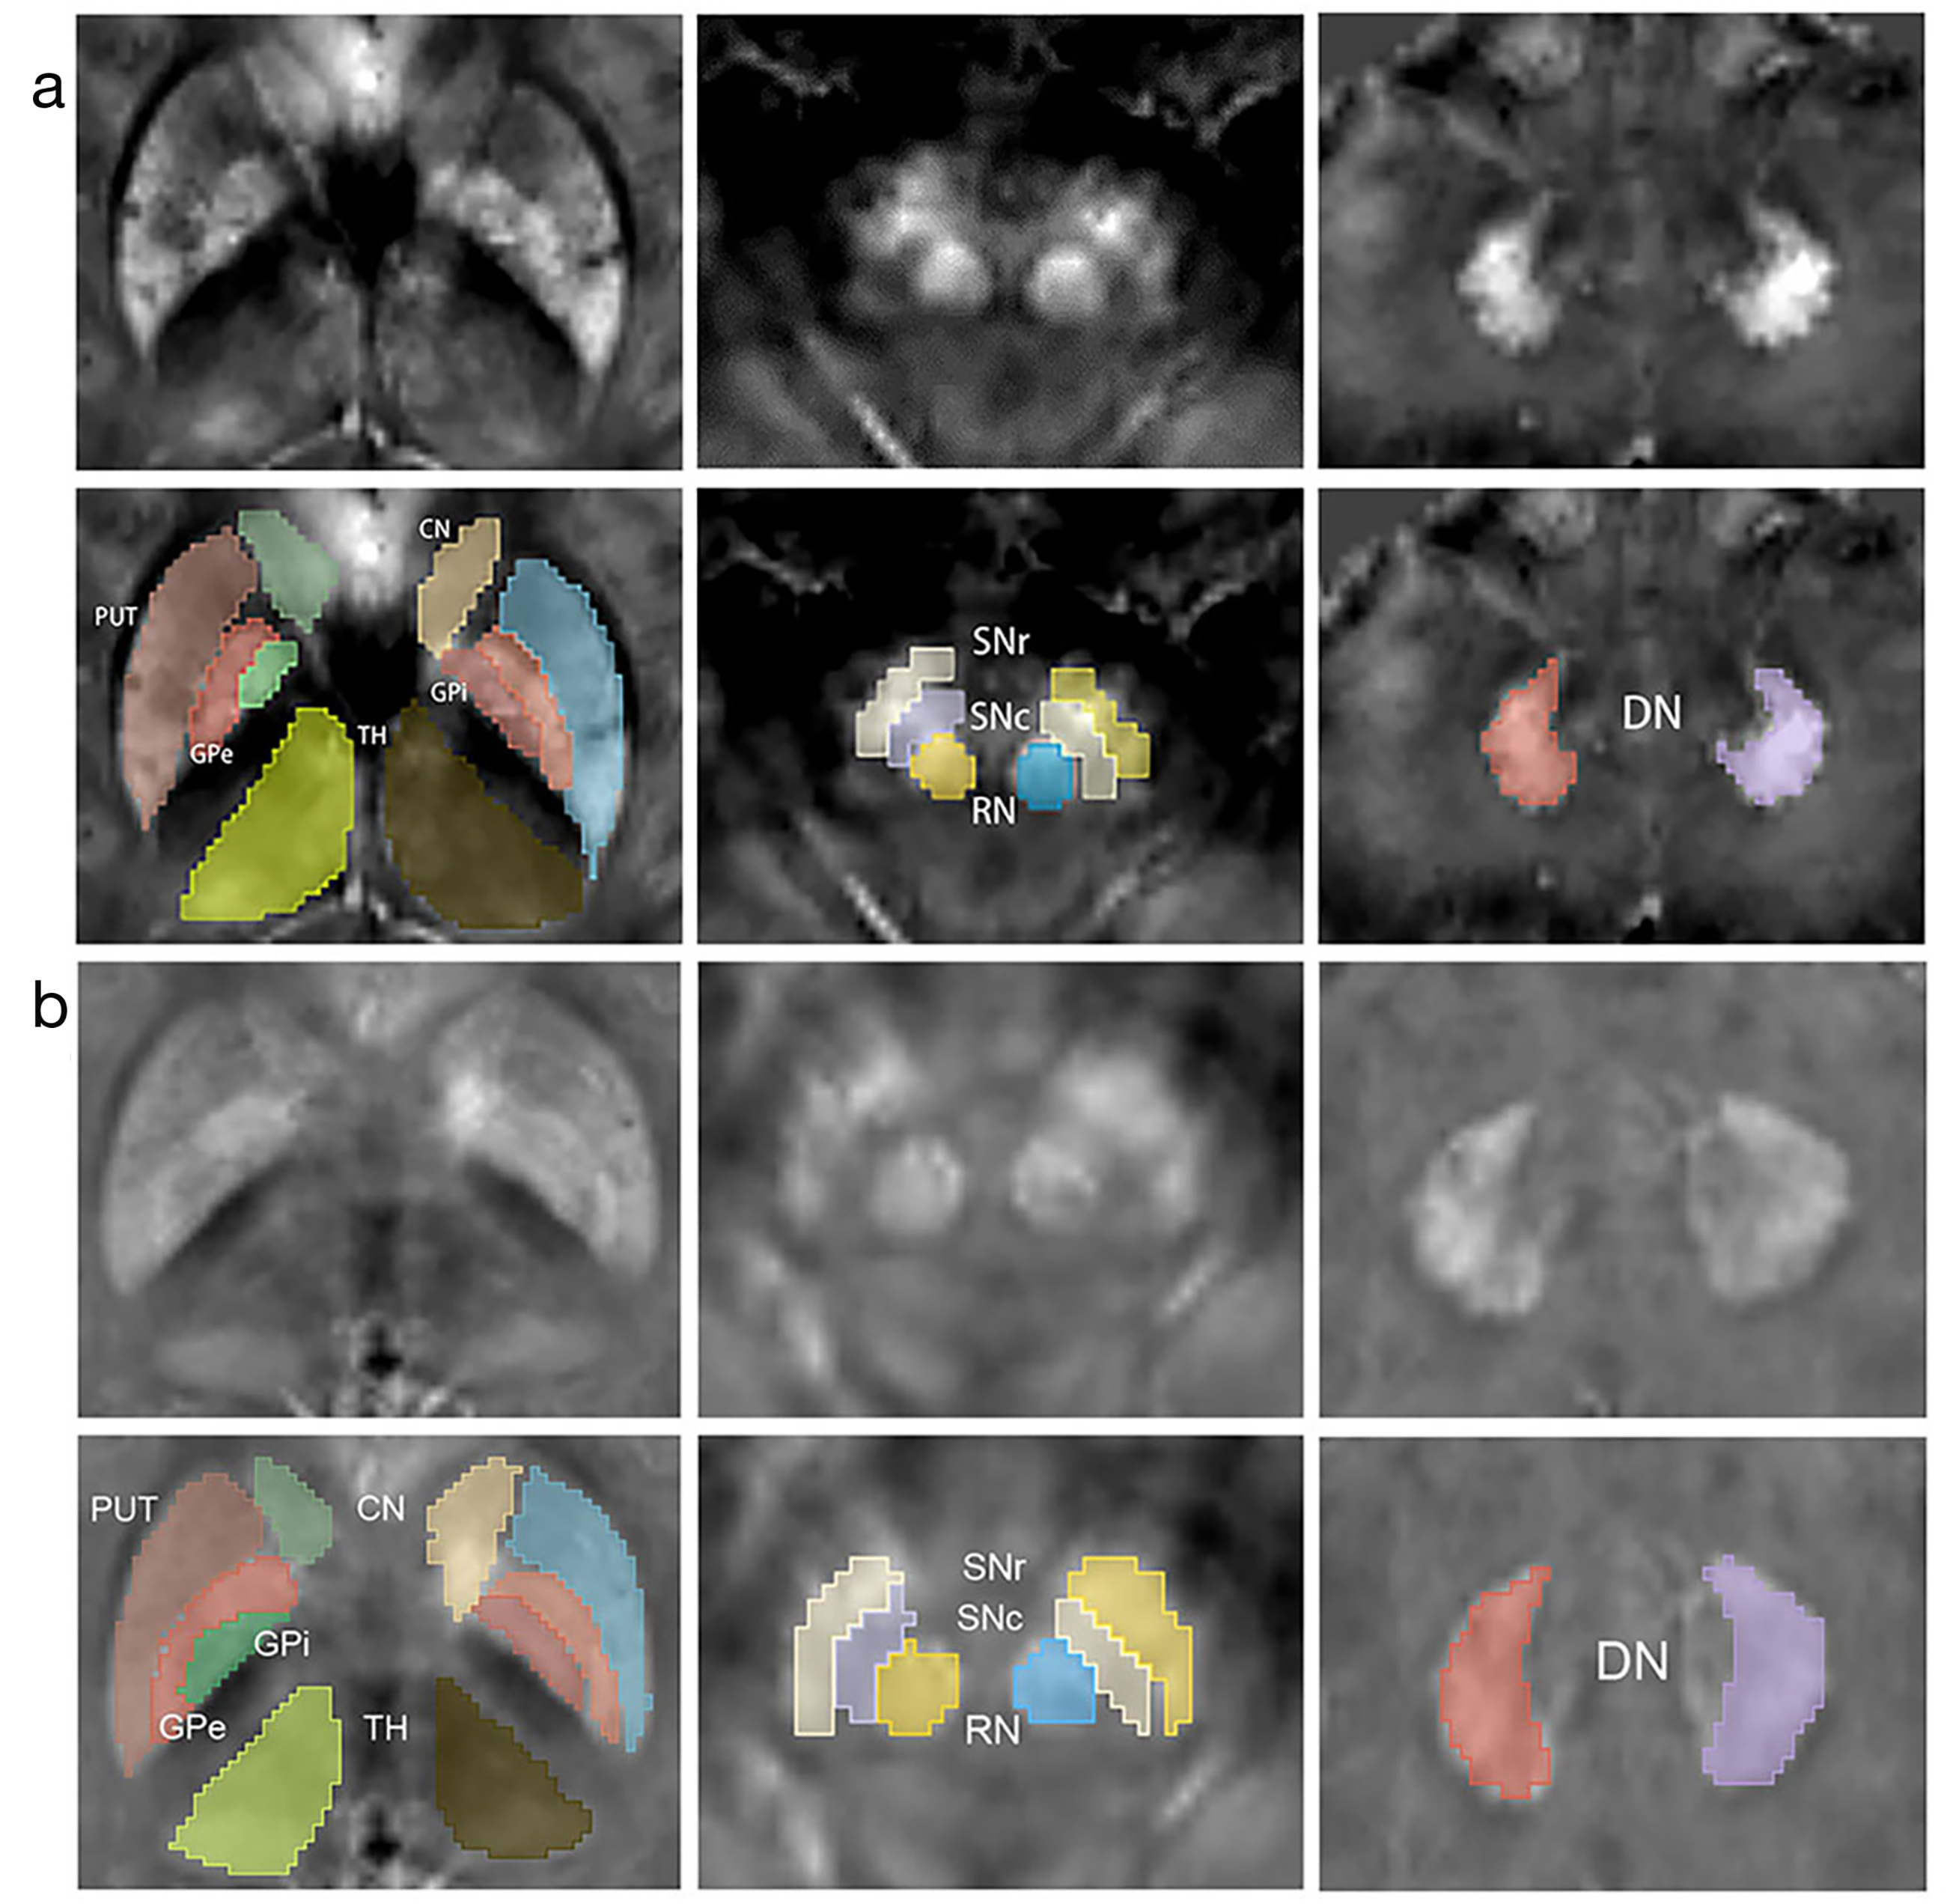
Representative QSM images of nuclei. CN, caudate nucleus; DN, dentate nucleus; GPe, external globus pallidus; GPi, internal globus pallidus; PUT, putamen; QSM, quantitative susceptibility mapping; RN, red nucleus; SNc, substantia nigra pars compacta; SNr, substantia nigra pars reticulate; TH, thalamus.
Statistical analysis
First, the normality of continuous data was assessed using the Shapiro–Wilk test, with results expressed as mean ± standard deviation (x ± SD). Enumeration data, such as sex, were expressed in terms of frequencies and analyzed using the chi-square test. The one-way ANOVA was then used to analyze data between HC and PD groups and within PD subgroups, with age as a covariate due to its significant difference. Post hoc analysis chose the least-significant difference (LSD) method and Bonferroni correction was performed. Furthermore, the relationships between QSM values, MDS-UPDRSIII scores, and the Hoehn–Yahr scale were explored using partial correlation analysis with age as a covariate. A consistency test was performed using the interclass correlation coefficient (ICC). All data were statistically analyzed using SPSS version 23.0 software (IBM Corp., Armonk, NY, USA). Statistical significance was defined by a P <0.05 in general.
Results
The primary data comparisons were presented in Table 2. Age showed a statistical difference between the PD and HC groups (P < 0.001), while sex did not. However, no significant differences were noted in terms of the MDS-UPDRSIII score and Hoehn–Yahr rating scale across subgroups (all P > 0.05).
Demographics of HC and PD groups.
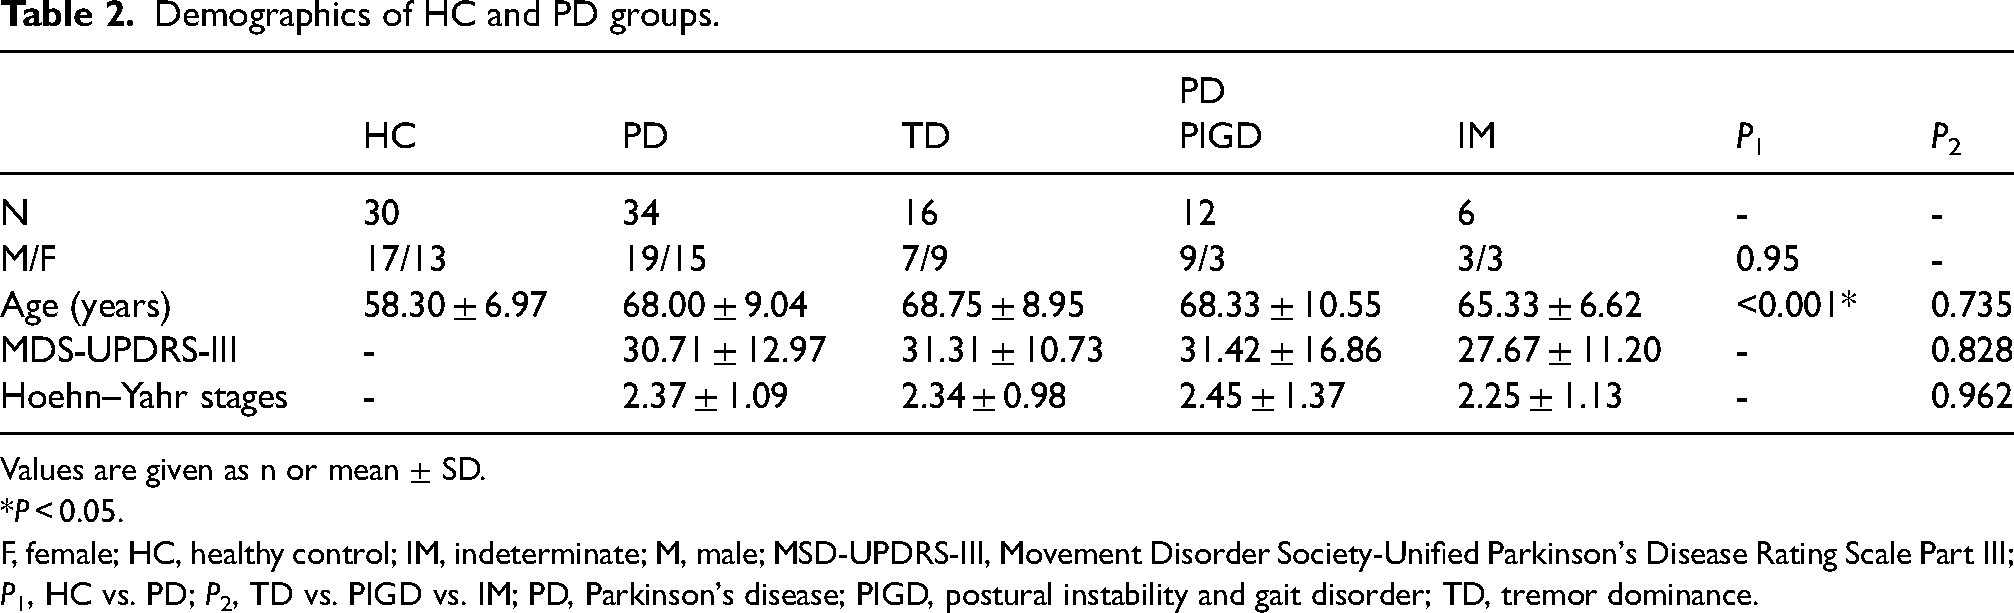
Values are given as n or mean ± SD.
*P < 0.05.
F, female; HC, healthy control; IM, indeterminate; M, male; MSD-UPDRS-III, Movement Disorder Society-Unified Parkinson's Disease Rating Scale Part III; P1, HC vs. PD; P2, TD vs. PIGD vs. IM; PD, Parkinson's disease; PIGD, postural instability and gait disorder; TD, tremor dominance.
In the assessment of QSM values across 18 ROIs, bilateral SNr (L: P = 0.004; R: P = 0.007) and SNc (L: P = 0.035; R: P = 0.028) presented notable differences between PD and HC (Table 3).
Comparison of comparisons of regional QSM values between the HC and PD groups.
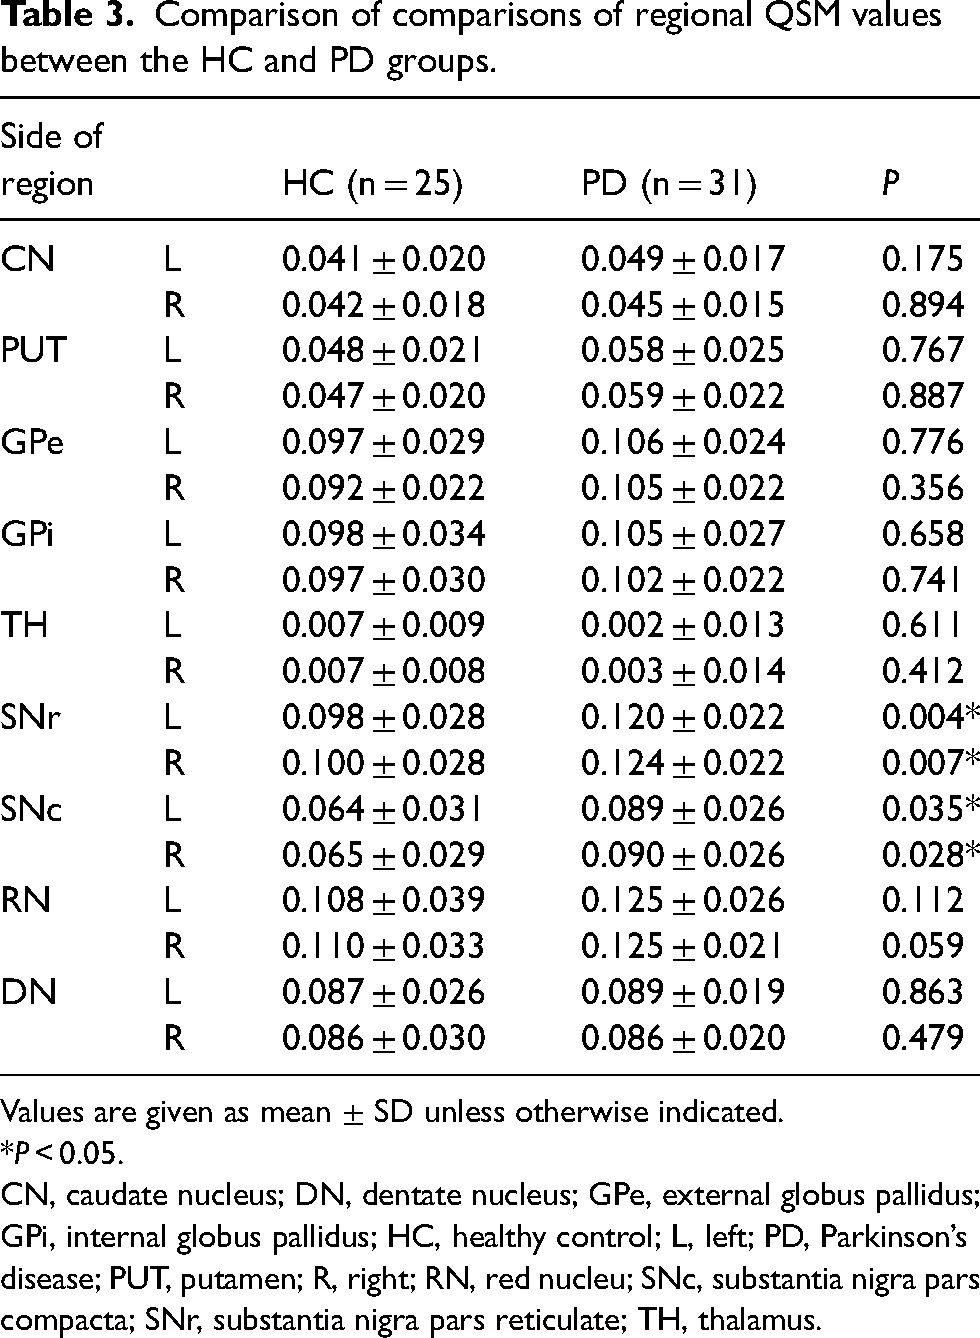
Values are given as mean ± SD unless otherwise indicated.
*P < 0.05.
CN, caudate nucleus; DN, dentate nucleus; GPe, external globus pallidus; GPi, internal globus pallidus; HC, healthy control; L, left; PD, Parkinson’s disease; PUT, putamen; R, right; RN, red nucleu; SNc, substantia nigra pars compacta; SNr, substantia nigra pars reticulate; TH, thalamus.
Within the PD subgroups, remarkable differences in the QSM values of bilateral GPe (L: P = 0.046; R: P = 0.032), SNr (L: P = 0.021; R: P = 0.002), and SNc-R (P = 0.037) were observed between the TD and PIGD groups. In addition, the QSM value of GPe-R (P = 0.021) and bilateral SNr (L: P = 0.012; R: P = 0.027) in the TD was significantly decreased compared with IM. In addition, no meaningful discrepancies emerged between PIGD and IM (Fig. 2).
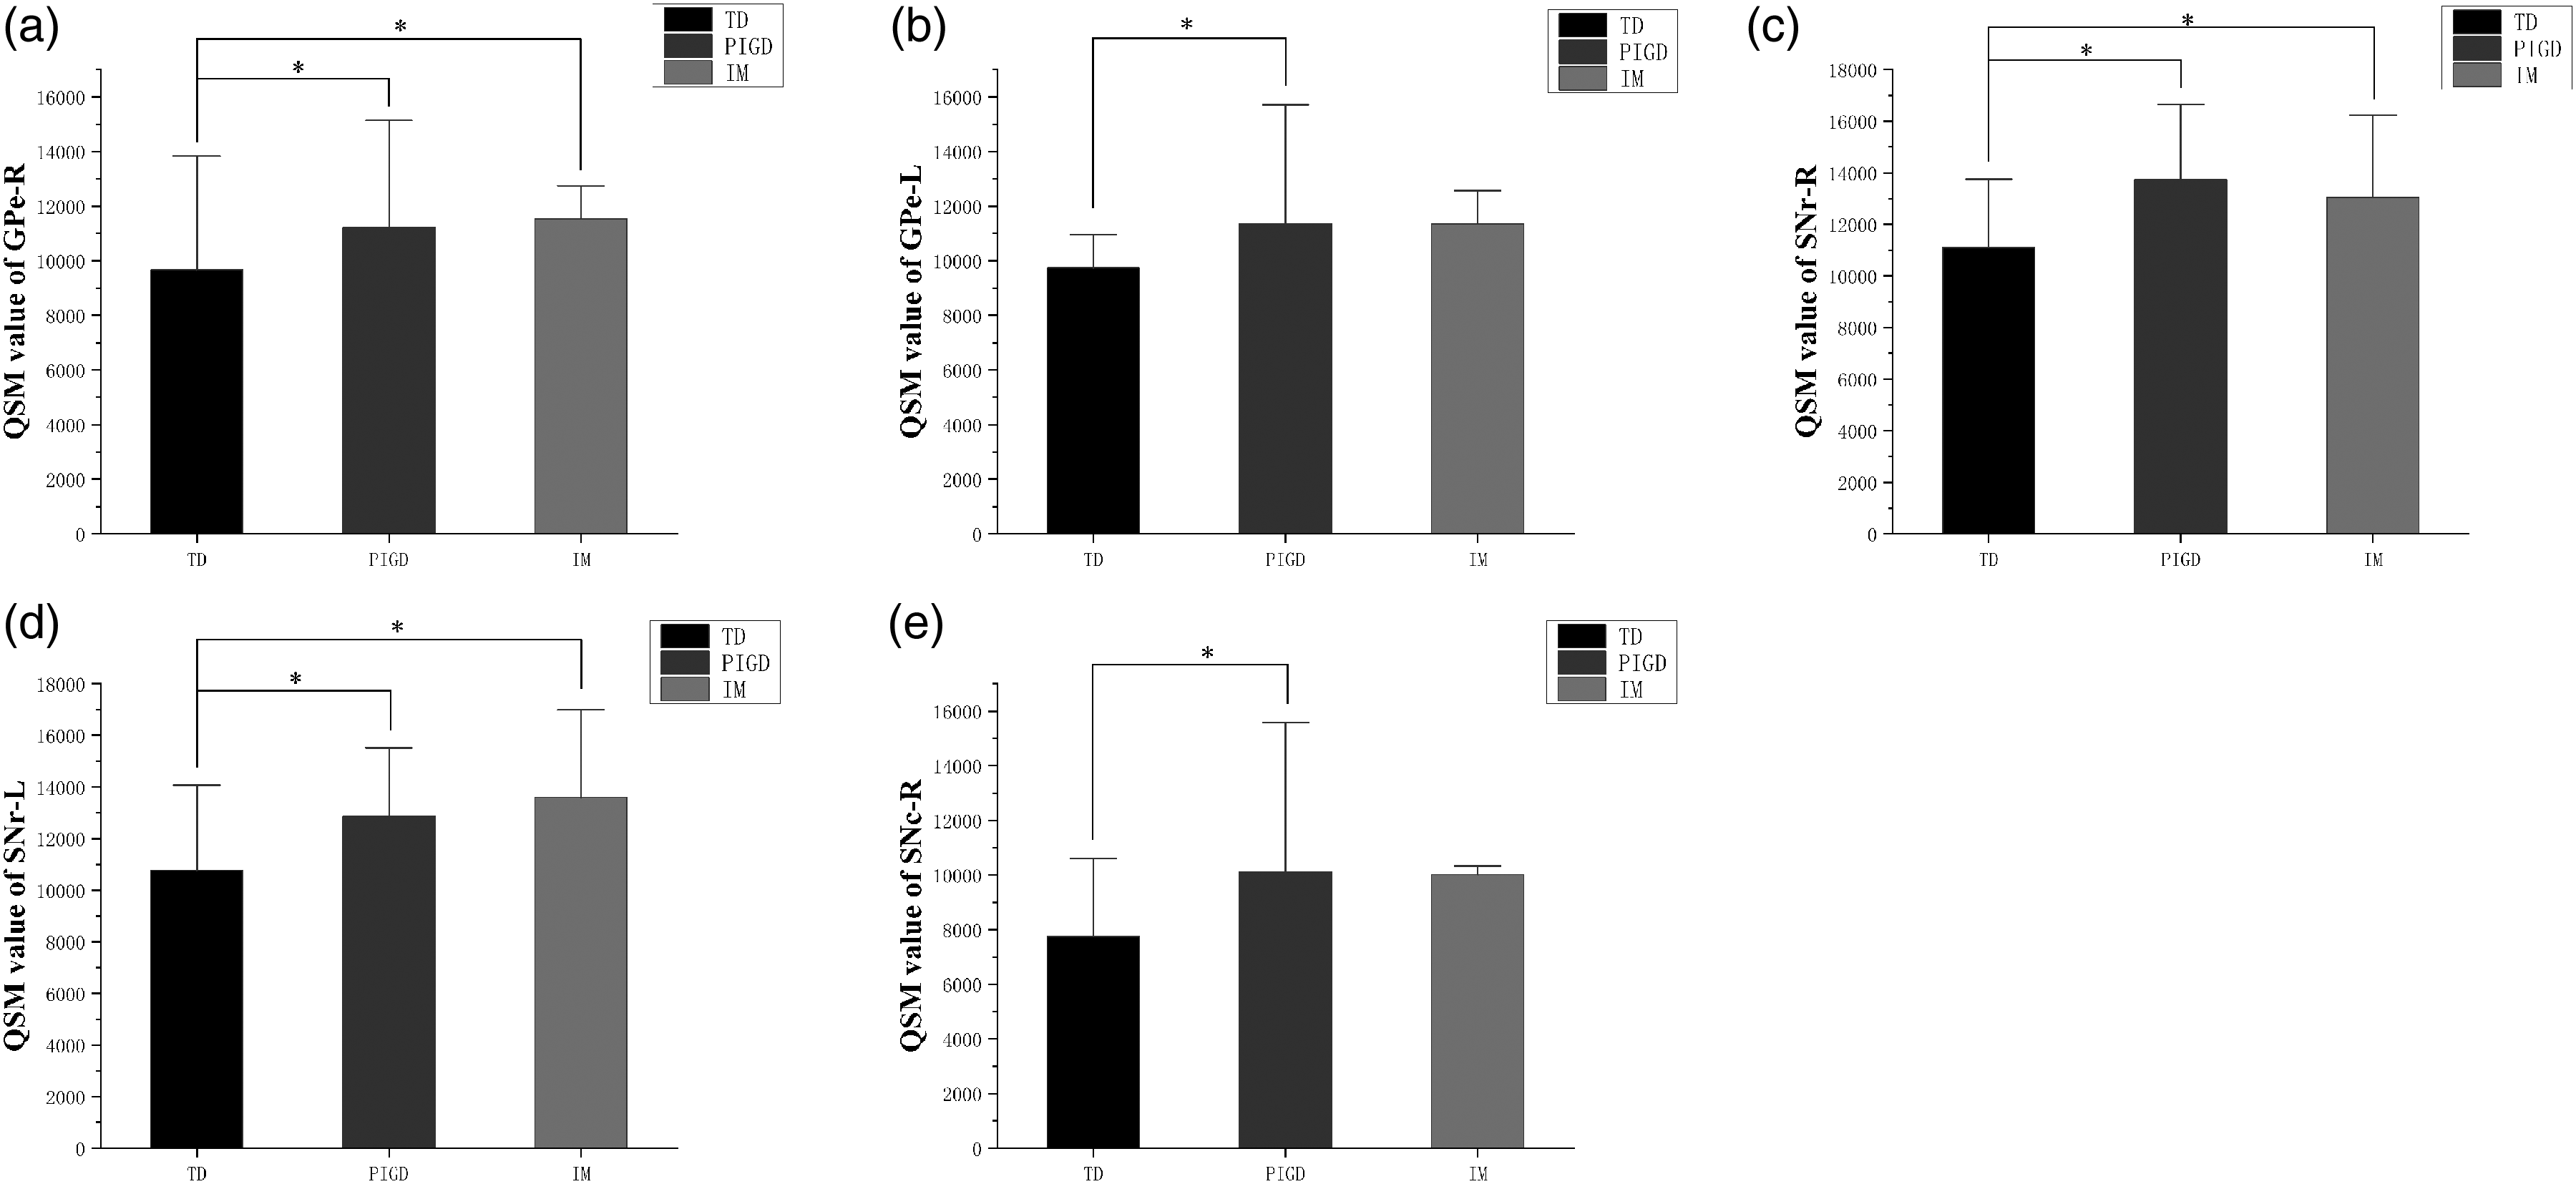
(a–e) Comparison of regional QSM values between PD subgroups. Different QSM values between PD subgroups in bilateral GPe, SNr, and SNc-R; *, P < 0.05. GPe, external globus pallidus; PD, Parkinson’s disease; QSM, quantitative susceptibility mapping; R, right; SNc, substantia nigra pars compacta; SNr, substantia nigra pars reticulate.
Controlling the variable of age, partial correlation analysis was applied to explore the relationship between rating scale scores and QSM values (Fig. 3). The susceptibility values of bilateral PUT were positively correlated with the MDS-UPDRSIII score in PD (L: r = 0.495, P = 0.003; R: r = 0.502, P = 0.003); TD (L: r = 0.628, P = 0.012; R: r = 0.691, P = 0.004), and PIGD (L: r = 0.700, P = 0.017; R: r = 0.650, P = 0.030). Furthermore, the QSM values inSNc-L (r = 0.557, P = 0.031) showed an association with the MDS-UPDRSIII score. In addition, the Hoehn–Yahr scale in the PD group also showed a low association with QSM values in bilateral PUT (L: r = 0.441, P = 0.010; R: r = 0.371, P = 0.030) while the TD group did not. As expected, the Hoehn–Yahr scale of the PIGD group represented a slightly higher correlation with QSM value in PUT-L (r = 0.685, P = 0.020) and TH-L (r = 0.601, P = 0.048).
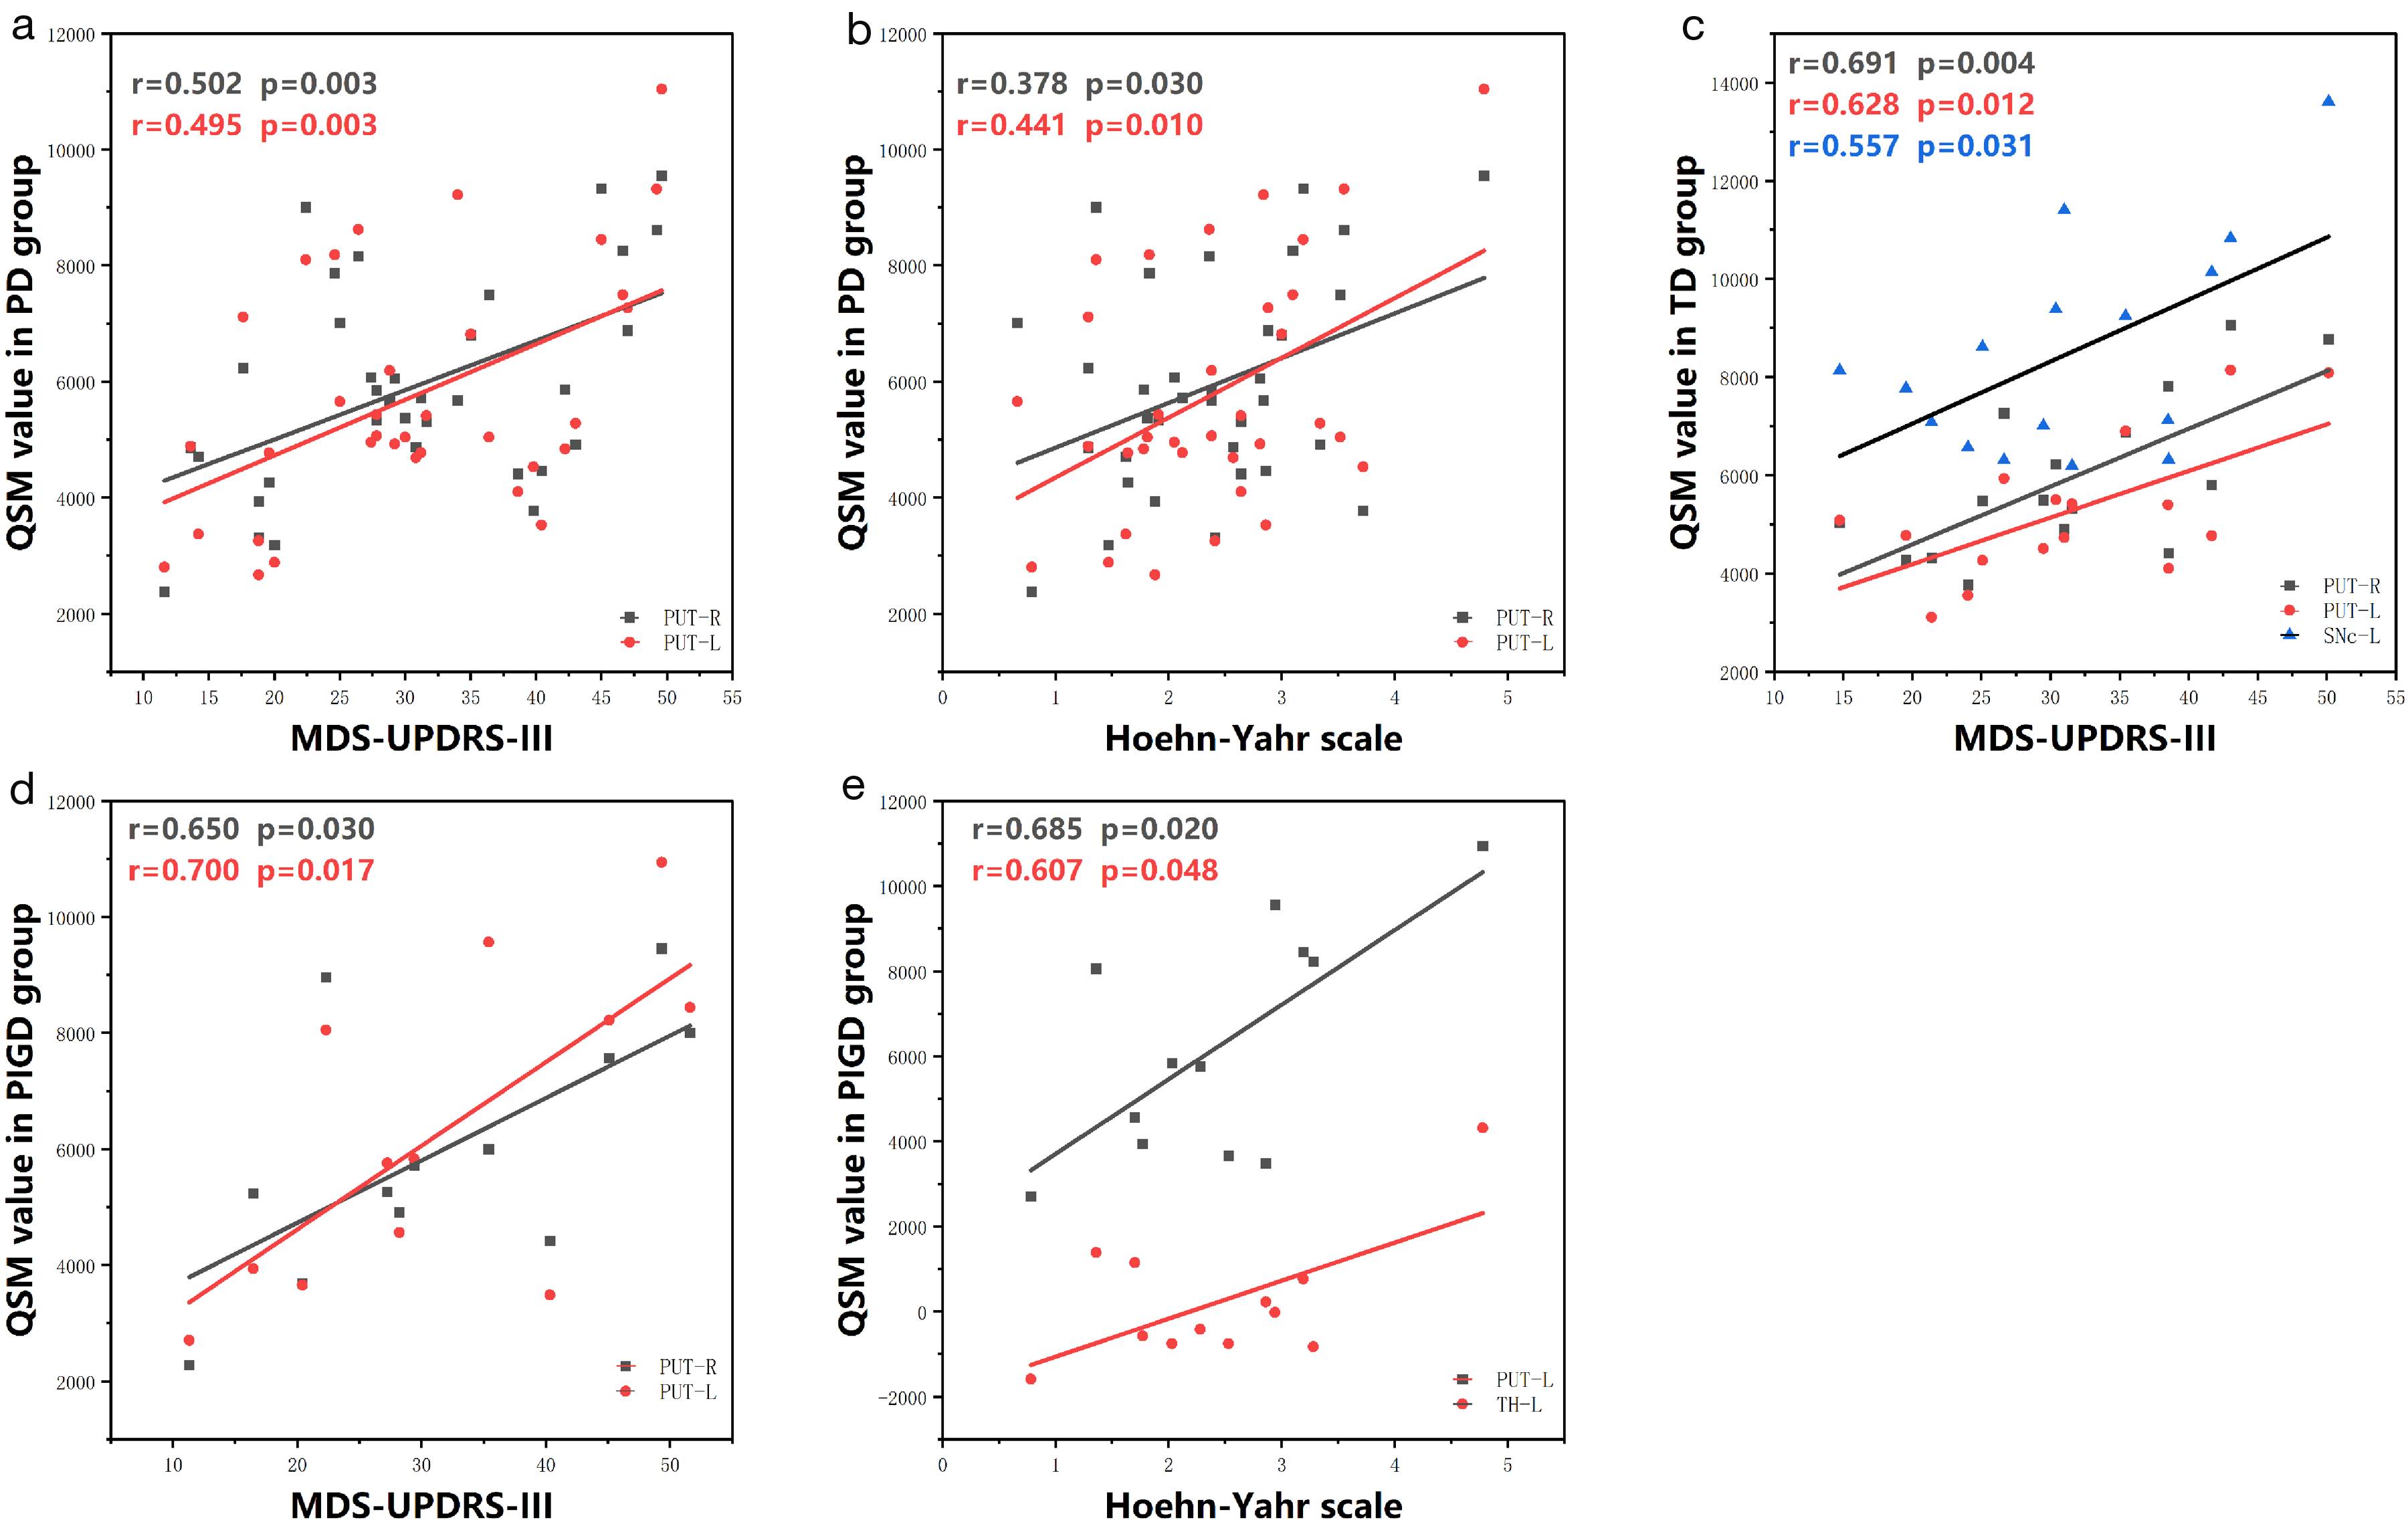
(a–e) Partial correlation analysis between clinical data and regional QSM value in PD cases. QSM values of PUT correlated with (a) MDS-UPDRS-III score and (b) H–Y stage in patients with PD. QSM values of PUT and SNc-L correlated with (c) MDS-UPDRS-III score in TD patients. QSM values of PUT significantly correlated with (d) MDS-UPDRS-III score in PIGD patients. QSM values of PUT-L and TH-L correlated with (e) H–Y stage in PIGD patients. MSD-UPDRS-III, Movement Disorder Society-Unified Parkinson's Disease Rating Scale Part III; PD, Parkinson’s disease; PIGD, postural instability and gait disorder; PUT, putamen; QSM, quantitative susceptibility mapping; SNc, substantia nigra pars compacta; TD, tremor dominance.
Discussion
The present study provides critical insights into the differential patterns of iron deposition in the nuclei of PD, which is a unique characteristic of PD and exhibits variations across different motor subtypes. In addition, the age disparity between the PD and HC groups is of considerable significance, as older age is commonly associated with an increased risk of PD and higher clinical severity. To mitigate this potential confounding factor, covariance analyses and partial correlation analyses were employed, with age as a control variable. Besides, due to population limitations, a discussion on the IM subtype was omitted in this article. ICC analysis, conducted on ROIs with volumes exceeding 0.75, ensures high reliability in our findings, which is crucial for subsequent analysis.
First, our study observed significantly higher QSM values in SN, including the SNc and SNr, in PD patients compared to the HC group. This finding aligns with numerous previous studies (2,12) and underscores the potential of SN as a critical imaging biomarker for PD diagnosis, regardless of age. In addition, we identified statistical differences in bilateral SNr and SNc-R between TD and PIGD, echoing findings by Wang et al. (23), who reported more pronounced iron deposition in the PIGD group using neuro-melanin-sensitive MRI (NM-MRI). Wang's study (23), alongside autopsy evidence (24) showing less SN melanin loss in patients with TD, indicates that PIGD is associated with more substantial nigrostriatal pathway impairment. On the contrary, Zhang et al. (2) revealed negative outcomes across the entire SN, but found the SN to be closely related to PIGD, which potentially supports the ability of SN to distinguish the subgroups (22,25). Hence, altered iron deposition could serve as a extra effective diagnostic marker for motor scores in distingushing subtypes. Notably, the SNc is often considered the principal lesion site in PD (22). Xiao et al. (22) proposed that iron deposition occurs in SNc initially and extends to SNr as the disease progresses. Wang et al. (26) also highlighted various pathway mechanisms contributing to distinct motor symptoms, with TD-PD potentially evolving into PIGD-PD or akinetic/rigid-dominant PD (AR-PD) over time, which can account for the positive or negative results between IM and TD/PIGD well. Notably, we observed significant differences in the SNc-R between the PIGD and TD subgroups. This finding is consistent with the study by Guan et al. (27), which reported unilateral significance in the substantia nigra (SN) of patients with PD, suggesting that motor asymmetry may influence iron deposition primarily in the SN. Guan et al. (27) also proposed that asymmetrical iron accumulation in the SN is associated with motor asymmetry in PD at baseline, aligning with our findings regarding the SNc. The SNc is typically considered the earliest site of lesion development. Unfortunately, we did not collect data on motor asymmetry, and the absence of objective criteria to accurately identify patients with asymmetrical symptoms presents a challenge.
Second, we analyzed the GP by dividing it into internal and external segments and found the significance in GPe-R. The study by Chen et al. (8) observed reduced iron content in GPi and increased levels in GPe, which might explain the negative result of the entire GP, especially in early-stage patients (23). Wang et al. (22) and Xiao et al. (25) reported elevated susceptibility values in GP for patients with PD compared to HCs without differentiating GPi and GPe, whereas the former study (22) suggested a correlation between iron deposition in GPi and disease progression. The role of the SNr-GPi pathway in extrapyramidal disorders may help explain this discrepancy. Although the SNr-GPi pathway was given great importance, we only found significance in bilateral GPe across subgroups. This was inconsistent with Zhang et al.'s (2) outcome that iron deposition did not present a statistical difference. Nevertheless, a study demonstrated that dopamine depletion in the GPe correlated with the severity of tremor in patients with PD (28). As a matter of fact, GPe is viewed as a central position in the BG and served as a retransmit station of the indirect pathway in the BG circuits (28). In short, there is still a great challenge to discern subtleties in the cellular makeup and synaptic connection of the GPe, which deserves more attention (29).
This study also discerned no statistical difference in PUT after covariance analysis. Shahmaei et al. (16) suggested that the accuracy of QSM in peripheral nuclei such as PUT may be affected owing to factors such as age and the presence of paramagnetic elements like calcium and magnesium, which also rise with age (30,31). Although the correlation between QSM and age diminished beyond a certain threshold (16), suggesting a limited effect on susceptibility values, the 10-year age gap between PD and HC in our study influenced relationship bewteen QSM values and PD groups. However, integrating SN and PUT data is the most effective method for differentiating PD from HC using QSM and histogram features (32). Moreover, Wei et al. (33) reported negative results, potentially attributed to their study predominantly including patients with tremor and akinetic/rigid (AR) subtypes, whereas PUT alterations are more commonly associated with the PIGD subtype (2). A study using single photon emission computed tomography (PET-CT) identified lower dopaminergic uptake in the PUT of patients with PD, particularly in the TD group (34). It is not unexpected that the partial correlation analysis found relationships between QSM value and MDS-UPDRSIII scores/Hoehn–Yahr scale in PUT in PD, TD, and PIGD.
Our analysis indicated no statistically significant differences in iron deposition in RN, DN, CN, and TH when compared to HC or between TD and PIGD. A study focusing on the predominance of TD and AR subtypes did not show any statistical difference (33). In addition, a meta-analysis showed PD possessed increased iron deposition in RN, as evidenced through various imaging modalities, including R2* and susceptibility-weighted imaging (SWI) (31,35). Therefore, this research observed no variation between TD and PIGD subtypes in the RN, which is consistent with prior research (2,16).
Recent studies that compared different motor symptoms (TD, PIGD, and AR) and groups comprising PD, resting tremors, and HCs concluded that iron deposition in the DN does not exhibit pathological alteration (2,12,33,36,37), which is in line with research focused on the DN's role in distinguishing between TD and AR subtypes finding no overall difference in iron deposition (38). However, this study noted higher iron deposition of TD groups compared to both HC and AR subtypes in the DN (38). Zhang et al. (2) also reported that, despite the lack of significance, the magnetic susceptibility in the DN of TD patients was relatively higher than in PIGD, aligning with our observations. Furthermore, another investigation about resting tremors identified no difference in neuron count and neuronal density in the DN compared to HCs but did observe Purkinje cell loss (35). These findings suggested that while iron deposition in the nucleus contributes to the pathogenesis of PD, microstructural changes in the nucleus and cortex may play a vital role in the disease's development. For example, Wen et al. (39) pronounced that changes have taken in the white matter in the early stage of PD, and Kai et al. (40) declared that structural connections in subcortical brain regions, including the pedunculopontine nucleus (PPN), was involved in the formation of frozen gait, and abnormal connections between many cortical and subcortical regions had been demonstrated.
There are ongoing debates and inconsistencies in the literature regarding the effect of CN in PD. Zhang et al. observed increased magnetic susceptibility of the CN in PD patients, particularly those with the PIGD subtype (2). In contrast, another study employing R2* imaging identified a more pronounced correlation between CN alterations and the tremor phenotype (33). The association between CN iron deposition and PD symptoms varies across studies: some report a link with rigidity, while others do not find significant differences across PD classifications (33,38). These discrepancies likely stem from diverse criteria for classifying motor subtypes, stages of disease progression, and the MRI techniques employed. In addition, research has pointed to a potential link between CN and non-motor symptoms, such as executive dysfunction and mild cognitive impairment, implicating the frontal-caudate dopaminergic pathway (34,41). This aligned with the dual syndrome hypothesis, which implies that patients with a tremor-dominant motor impairment-cognitive (MIC) profile exhibit deficits in executive functions linked to the caudate nucleus and prefrontal cortex. In contrast, the PIGD experiences impairments predominantly in the posterior cortex and temporal lobe, associated with visuospatial dysfunctions (41). Consequently, while the CN appears to be related to motor subtypes in PD, its connection to iron deposition remains ambiguous and requires further investigation.
Similarly, no significant differences in QSM value were detected in the TH. A notable correlation, however, was observed between iron deposition in the TH-L and the H-Y stage. This finding suggested the striatal-thalamo-cortical (STC) circuits, closely associated with akinesia and rigidity, and the cerebello-thalamo-cortical (CTC) circuit, correlated to tremor, possibly accounting for the pathophysiology of PD (33). Another study concurred with our findings, reporting no significant difference in TH histogram values between PD patients and HCs, and highlighted TH's low diagnostic efficacy for PD (35). Interestingly, the QSM value of TH was the lowest among all nuclei, in accordance with large-scale studies. Beyond motor disorders, the TH's role in non-motor symptoms of PD, particularly in the PIGD subtype, warrants further exploration.
The present study has some limitations. First, the research design was cross-sectional. Second, the sample size was relatively small. Considering the main motor phenotype of PD can evolve as the disease progresses, a large cohort and longitudinal follow-up are essential for more precise identification of motor subtypes. The IM group, in particular, considered an intermediate stage during the transition, possesses great potential. Finally, age, as an influencing factor, was not successfully controlled in this study and we discovered that it does affect the results to a certain extent. Thus, exploring the impact of age on PD and QSM value is a necessary task.
In conclusion, our study demonstrates that iron deposition in PD exhibits distinct patterns across various nuclei. The SN is particularly pertinent in differentiating PD subtypes. In addition, age also has a significant effect on iron deposition.
Footnotes
Acknowledgments
We want to thank all the patients and for their participation as well as my teachers who always offered guidance timely.
Declaration of conflicting interests
The authors declared no potential conflicts of interest with respect to the research, authorship, and/or publication of this article.
Funding
The authors disclosed receipt of the following financial support for the research, authorship, and/or publication of this article: This work was supported by the Department of Science and Technology of Inner Mongolia Autonomous Region (project no. 2020GG0179).
