
Abstract
Background
Gadolinium-iodine mixed contrast agents can significantly improve the visualization of the fallopian tubes in magnetic resonance hysterosalpingography (MR-HSG). However, the mixing ratio of gadolinium-iodine contrast agents has not yet been standardized.
Purpose
To explore the optimal mixing ratio of gadolinium-iodine contrast agents suitable for MR-HSG.
Material and Methods
A total of 16 mixing ratios of gadolinium and saline mixtures (Gd-NS), gadolinium and iopromide mixtures (Gd-I370), and gadolinium and iodixanol mixtures (Gd-I320) were formulated for an in vitro study. These mixed contrast agents were scanned on 1.5 T and 3.0 T using T1 contrast enhancement sequences. For qualitative assessment, contrast agent imaging quality was graded on a subjective 3-point scale (good, moderate, and poor). For the quantitative evaluation, differences in the signal intensity (SI) of the three contrast agents, as well as the SI variations between 1.5 T and 3.0 T, were compared.
Results
Gd-I370 and Gd-I320 exhibited the highest SI and good image at a 1:300 ratio on 1.5 T and a 1:200 ratio on 3.0 T. The difference in the SI among the three contrast agents was not statistically significant at 1.5 T (P > 0.05). At 3.0 T, the comparison between the SIs of Gd-I370 and Gd-I320 was not statistically significant (P > 0.05). The SIs of contrast agents on 3.0 T were higher than those on 1.5 T (P < 0.05).
Conclusion
A gadolinium-iodine contrast agent with a 1:300 mixing ratio may be more suitable for 1.5 T MR-HSG, while a 1:200 mixing ratio may be more suitable for 3.0 T MR-HSG. Additionally, the contrast agent SI is higher on 3.0 T than on 1.5 T.
Introduction
Currently, X-ray hysterosalpingography (HSG) is the first-line examination for female infertility and is considered the gold standard for assessing tubal patency. However, it involves ionizing radiation, cannot evaluate extrauterine and extratubal lesions, and the use of oil-based contrast carries a risk of pulmonary embolism (1). Hysterosalpingo-contrast sonography (HyCoSy) has advantages, such as no ionizing radiation, simplicity of operation, high diagnostic efficiency (2), good patient tolerance (3), and the ability to simultaneously assess uterine, ovarian, and pelvic lesions, making it a first-line examination for evaluating female infertility (4). However, the results of HyCoSy depend on the operator's experience, and the reproducibility of the images is not high (5). Magnetic resonance imaging (MRI) offers the advantages of no radiation, high soft tissue resolution, less dependence on the observer, and high image reproducibility, making it the best method for pelvic imaging (6). Magnetic resonance hysterosalpingography (MR-HSG) involves injecting contrast agents into the uterine cavity and fallopian tubes through the cervix for further evaluation. In recent years, MR-HSG has become a research hotspot because it provides a comprehensive assessment of the reproductive organs and surrounding structures in female infertility patients. However, there are currently no standardized contrast agent types or mixing ratios.
In a previous study, Wang et al. (7) used saline as the contrast agent for MR-HSG, but the results only showed dilated hydrosalpinx and the tubal patency could only be indirectly assessed through the accumulation of pelvic fluid. Therefore, using only saline as a contrast agent makes it difficult to evaluate the morphological structure of the fallopian tubes. Most in vivo MR-HSG studies use a mixture of T1-type contrast agents, i.e. gadolinium and saline mixed contrast, but the mixing ratios vary widely from 1:5 to 1:100 (8–12), resulting in poor visualization of the fallopian tubes. Unterweger et al. (13) significantly increased the viscosity of the contrast agent by mixing gadolinium with polyvidone (PVP) at 1.5 T, achieving direct visualization of the fallopian tubes in 5/7 (71%) female infertility patients. Duan et al. (14) and Hu et al. (15) increased the contrast agent viscosity by diluting gadolinium with iodinated water at 3.0 T, achieving good fallopian tube images with a 1:100 gadolinium-iodine mixed contrast agent. However, visualizing the narrow interstitial and isthmic parts of the fallopian tubes with smaller inner diameters remains challenging. Currently, studies using gadolinium-iodine mixed contrast agents for MR-HSG are limited.
The aim of the present study was to conduct in vitro experiments on different mixing ratios of gadolinium-saline and gadolinium-iodine mixed contrast agents using 1.5 T and 3.0 T MR scanners to explore the optimal contrast agent mixing ratios for MR-HSG.
Material and Methods
Preparation of contrast agents
The materials used in the experiment include three centrifuges, 150 plastic centrifuge tubes (volume of 5 mL each), three pipettes (ranges of 5–50 µL, 50–200 µL, and 200–1000 µL), several bottles of saline solution (0.9% sodium chloride), several bottles of iopromide injection solution (370 mg(I)/100 mL; Bayer Vital GmbH, Berlin, Germany), iodixanol injection solution (320 mg(I)/100 mL; Yangtze River Pharmaceutical Group Co., Ltd., Taizhou, China), and gadoterate meglumine injection solution (500 mmol/L; Jiangsu Hengrui Medicine Co., Ltd., Lianyungang, China). The viscosity of the drug used is shown in Table 1.
Different contrast agent viscosities.

*The viscosity of saline is like that of water, approximately 1 mPa·s.
The contrast media were prepared with different ratios of gadolinium to saline, gadolinium to iodixanol, and gadolinium to iohexol as follows: 1:0, 1:1, 1:5, 1:10, 1:15, 1:20, 1:30, 1:50, 1:80, 1:100, 1:150, 1:200, 1:300, 1:400, 1:800, and 0:1. Each of the 16 different mixed ratios contains 5 mL of the contrast agent, and each ratio was prepared in triplicate, forming groups A, B, and C. Each contrast agent was sealed in plastic centrifuge tubes and mixed thoroughly.
An additional phantom bottle containing phantom liquid was used as a reference in the 1.5 T experiments as well as to add weight to facilitate scanning. Similarly, an extra set of saline was used as a reference in the 3.0 T experiment.
Contrast agents scanning
A Philips 1.5 T MR scanner (Ambition; Philips Healthcare, Best, the Netherlands) with a 28-channel phased-array body coil and a 3.0 T MR scanner (SIGNA Premier; GE Healthcare) with a 30-channel AIR coil were used for scanning. The scanning sequence for the 1.5 T was 3D-mDixon, with the following parameters: coronal plane, TR = 6.2 ms, TE1/TE2 = 2.0/4.1 ms, flip angle = 15°, field of view [FOV] = 250 × 250 mm, slice thickness = −0.75 mm, and matrix = 300 × 249. The scanning sequence for the 3.0 T was Disco, with the following parameters: coronal plane, TR = 4.2 ms, TE1/TE2 = 1.1/2.3 ms, flip angle = 12°, FOV = 260 × 90 mm, slice thickness = 1.00 mm, and matrix = 260 × 260. The contrast agents were arranged in order of their mixing ratios from low to high (with gadolinium dilution concentration decreasing) on the centrifuges and scanned at room temperature. The 1.5 T and 3.0 T MR scanners scanned each contrast agent group.
Image analysis
Qualitative assessment of image
Two radiologists assessed the quality of contrast agent images on the same image processing workstation (Bee DICOM Viewer), unaware of the type of contrast agent, mixing ratio, or field strength. Qualitative evaluation of contrast agent images with different mixing ratios was graded on a subjective 3-point scale: “good” meant the contrast agent showed a homogeneous high signal, clearly contrasting with the background noise; “moderate” meant the contrast agent showed an inhomogeneous high signal, with localized areas appearing as blurred low signals, but it was still easily distinguishable from the background noise; and “poor” meant the contrast agent showed low signal, difficult to distinguish from the background noise.
Quantitative assessment of image
The scanned images were uploaded to the Philips and GE postprocessing workstations. The signal intensity (SI) of the different contrast agent mixtures was measured, selecting the middle layer of the centrifuge tube as the region of interest (ROI) with an approximate area of 60 mm2. Each measurement was repeated three times, and the average value was taken. When the contrast agent's SI was indistinguishable from the background noise, the SI value was approximated to 0. The mixture ratio with the highest SI was selected as the optimal mixing ratio for that contrast agent.
Statistical analysis
A statistical analysis was performed using SAS 9.4 software. The SI values for groups A, B, and C of the three contrast agents, the SI values between the three mixed contrast agents, and the SI values of the contrast agents at 1.5 T and 3.0 T were compared. The measured SI was treated as quantitative data. Multisample comparisons were conducted using the Kruskal–Wallis rank-sum test with Bonferroni correction for pairwise comparisons. The Wilcoxon rank-sum test was used for two-sample comparisons. A P value <0.05 was considered statistically significant.
Results
Qualitative assessment
On both 1.5 T and 3.0 T scanners, both readers graded Gd-NS images in the 1:15–1:300 range as good or moderate. On the 1.5 T scanner, Gd-I370 and Gd-I320 images in the 1:80–1:800 range were rated as good or moderate by both readers, with the 1:300 image specifically rated as good. On the 3.0 T scanner, Gd-I370 and Gd-I320 images in the 1:80–1:800 range were consistently rated as good by both readers. In contrast, on both the 1.5 T and 3.0 T scanners, Gd-NS at 1:0–1:1 and Gd-I370 and Gd-I320 at 1:0–1:5 showed SI indistinguishable from background noise and were rated as poor by both readers. In addition, saline and iodine contrast images were consistently rated poor by both readers. Figs. 1 and 2 show the images of contrast agents with different mixing ratios at 1.5 T and 3.0 T, respectively.

Contrast agent images at 1.5 T. (a) Gadolinium and saline mixed contrast agent; (b) gadolinium and iopromide mixed contrast agent; (c) gadolinium and iodixanol mixed contrast agent.

Contrast agent images at 3.0 T. (a) Gadolinium and saline mixed contrast agent; (b) gadolinium and iopromide mixed contrast agent; (c) gadolinium and iodixanol mixed contrast agent.
Quantitative assessment
Fig. 3 illustrates the SI changes across different contrast agents and mixing ratios under various field strengths. In both 1.5 T and 3.0 T, the SI values of the three contrast agents increased initially and then decreased as the mixing ratio increased (with gadolinium concentration decreasing); the SI values for the contrast agents were higher on the 3.0 T than on the 1.5 T. On the 1.5 T scanner, Gd-NS had the highest SI at a 1:80 ratio; Gd-I370 and Gd-I320 had the highest SIs at a 1:300 ratio. On the 3.0 T scanner, Gd-NS had the highest SI at a 1:50 ratio; Gd-I370 and Gd-I320 had the highest SIs at a 1:200 ratio. Therefore, the optimal mixing ratios for Gd-NS are 1:80 at 1.5 T and 1:50 at 3.0 T. The optimal mixing ratios for Gd-I370 and Gd-I320 are the same, which are 1:300 at 1.5 T and 1:200 at 3.0 T.

SI dot plot of gadolinium-saline and gadolinium-iodine mixed contrast agents at different mixing ratios. (a) 1.5 T; (b) 3.0 T.
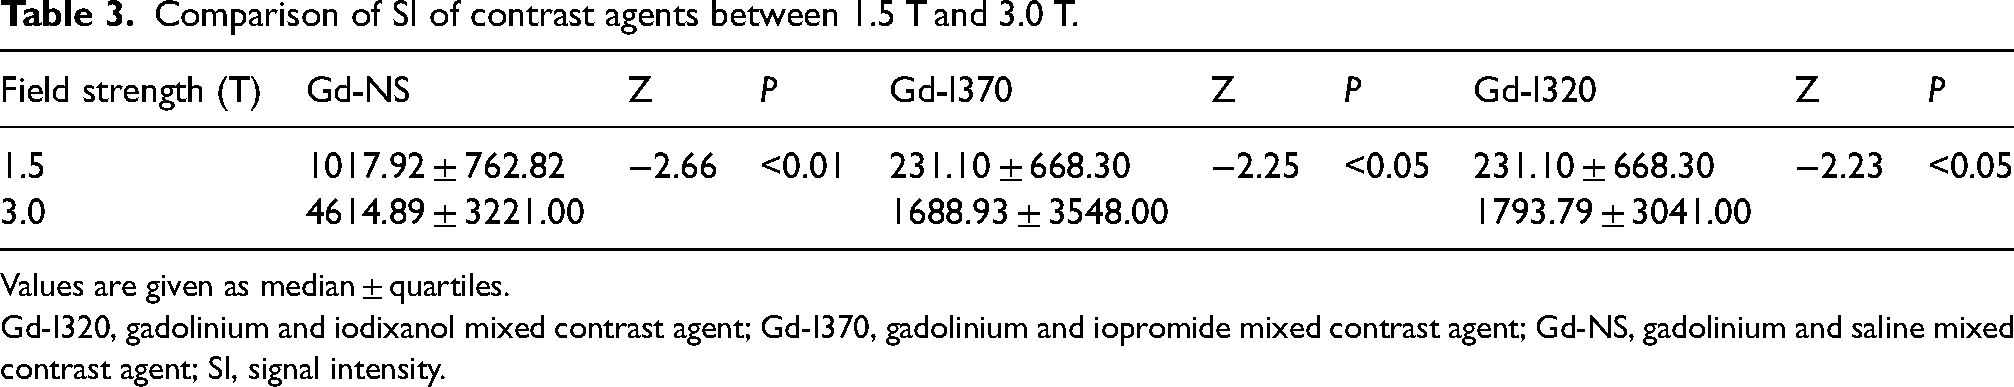
There was no statistically significant difference in SI values between groups A, B, and C for Gd-NS, Gd-I370, and Gd-I320 (P > 0.05). For subsequent comparison, group A of the three contrast agents was selected. On the 1.5 T scanner, there was no statistically significant difference in SI values among the three contrast agents (P > 0.05). On the 3.0 T scanner, there were statistically significant differences in SI values between Gd-NS and gadolinium-iodine contrast agents (P < 0.01), but no statistically significant difference in SI values between Gd-I370 and Gd-I320 (P > 0.05). Comparisons of the same contrast agents between the 1.5 T and 3.0 T scanners showed statistically significant differences in SI values (P < 0.05). The comparison of SI values between the same contrast agent groups and the comparison of SI values between different contrast agents at 1.5 T and 3.0 T are summarized in Table 2. The differences of SI values for the same contrast agent under different field strengths are presented in Table 3.
Comparison of SI within the same contrast agent and between different contrast agents at 1.5 T and 3.0 T.

Values are given as median ± quartiles.
*Represents the Z-value.
Gd-I320, gadolinium and iodixanol mixed contrast agent; Gd-I370, gadolinium and iopromide mixed contrast agent; Gd-NS, gadolinium and saline mixed contrast agent; SI, signal intensity.
Comparison of SI of contrast agents between 1.5 T and 3.0 T.
Values are given as median ± quartiles.
Gd-I320, gadolinium and iodixanol mixed contrast agent; Gd-I370, gadolinium and iopromide mixed contrast agent; Gd-NS, gadolinium and saline mixed contrast agent; SI, signal intensity.
Discussion
The purpose of this in vitro study was to investigate the SI of different types and mixing ratios of contrast agents using T1-weighted contrast-enhanced sequences on 1.5 T and 3.0 T scanners. This was done to characterize the relationship between the mixing ratios of contrast agents and SI, to optimize the use of these mixtures in in vitro MR-HSG. Based on our study, we recommend using a 1:300 gadolinium-iodine mix for 1.5 T MR-HSG and a 1:200 gadolinium-iodine mix for 3.0 T MR-HSG. Given the higher SI on the 3.0 T scanner and the good imaging within the 1:80–1:800 range, we suggest performing MR-HSG on the 3.0 T scanner.
Consistent with the previous study on the SI of contrast agents in vitro, the SI for different mixed contrast agents on both 1.5 T and 3.0 T increased initially and then decreased with decreasing gadolinium concentration (16). This can be attributed to the fact that high concentrations of gadolinium primarily shorten the T2 relaxation time, while low concentrations primarily shorten the T1 relaxation time. Thus, as gadolinium concentration decreases within a certain range, the contrast agent significantly shortens T1, increasing SI until it peaks and then decreases. On both 1.5 T and 3.0 T scanners, the SI of Gd-NS was higher than that of the gadolinium-iodine mixes, with the SI of the two gadolinium-iodine mixes being similar. Compared to the peak SI of Gd-NS, the highest SI of the gadolinium-iodine mixes was shifted lower and to the right, suggesting that iodine weakens the T1-shortening effect of gadolinium. However, the two gadolinium-iodine mixed contrast agents showed no significant difference in SI, indicating that the viscosity of iodinated water does not diminish the T1 shortening effect of gadolinium agents. Gd-NS at ratios of 1:0 to 1:1 and gadolinium-iodine mixtures at 1:0 to 1:5 showed poor image quality. This confirms that gadolinium alone does not produce a signal and generates low signals when proton numbers are low. Normal fallopian tubes do not contain fluid inside the lumen. Therefore, using gadolinium, iodinated water, or saline alone as contrast agents for MR-HSG makes it difficult to visualize the fallopian tubes. A mixed contrast agent may be more suitable.
Contrary to our in vitro findings, where the Gd-NS images with the 1:15–1:300 range were good or moderate, previous studies using 1:14 (11), 1:19 (10), 1:20 (12,17), and 1:100 (9,15,18–20) Gd-NS for in vivo MR-HSG achieved poor fallopian tube imaging. Compared to HSG, using Gd-NS for tubal imaging results in incomplete visualization of the fallopian tubes and lower spatial resolution. Unterweger et al. (13) and Winter et al. (21) used high-viscosity (up to 100 mPa·s) contrast agents mixed with PVP and gadolinium for MR-HSG, resulting in good visualization of the fallopian tubes, even achieving complete visualization. Duan et al. (14) improved the viscosity of the contrast agent by mixing gadolinium with iodinated water, which also significantly enhanced the visualization of the fallopian tubes. Compared to PVP, iodinated water has a lower viscosity, higher safety, and is easier to prepare. However, in vivo MR-HSG studies using gadolinium-iodine mixes are limited.
Similar to the optimal mixing ratio of 1:200 for gadolinium-iodine mix on the 3.0 T scanner found in our study, researchers Duan et al. (14) and Hu et al. (15) improved fallopian tube visualization using a 1:100 gadolinium-iohexol mix on the 3.0 T scanner, with imaging portions of the tubal isthmus and intramural parts. Our in vitro experimental study indicates that the SI of the optimal Gd-NS mixture is higher than that of both the Gd-I370 and Gd-I320 mixtures. The discrepancy between in vitro and in vivo findings might be due to contrast agent viscosity, as the gadolinium-iodine mix has higher viscosity than the gadolinium-saline mix. The possible reason is that high-viscosity contrast agents prolong transit time through the fallopian tubes, reducing absorption by the fallopian tubes and increasing the number of protons within the fallopian tube lumen (21), thereby generating a higher signal-to-noise ratio (SNR). Paradoxically, our in vitro contrast agent study suggests that the viscosity of iodinated water is unrelated to SI. The possible reason lies in the complex anatomical structure of the human fallopian tubes, such as the presence of numerous cilia. Therefore, the higher viscosity of the gadolinium-iodine mix can counteract the reduced T1 shortening effect of iodine. Previous studies also demonstrate that gadolinium-iodine mix used in coronary angiography does not cause notable renal damage and does not release toxic free gadolinium ions (22,23). In addition, a review of the literature revealed no reports of severe adverse reactions from the gadolinium-iodine mix used in MR-HSG. Consequently, the gadolinium-iodine mix has promising potential as a superior contrast agent for MR-HSG compared to the gadolinium-saline mix.
Our research found that the optimal mixing ratios at 1.5 T and 3.0 T were comparable. In 2012, Ma et al. (19) were the first to use a 3.0 T MR scanner for MR-HSG, obtaining relatively clearer images. Since 2020, all MR-HSG studies have been conducted using 3.0 T MR scanners (8–10,14,15), likely due to their superior performance compared to 1.5 T. The advantages of 3.0 T scanners include a higher SNR, a higher contrast-to-noise ratio (CNR), faster scan speed, and higher temporal and spatial resolution in dynamic scan sequences. Our study also demonstrated that the 3.0 T scanner provided higher SI and produced good images within the 1:80–1:800 range of the gadolinium-iodine mix. Moreover, the 1.5 T scanner exhibited more prominent pelvic motion artifacts compared to the 3.0 T (24). Therefore, 3.0 T MR-HSG is advantageous over 1.5 T MR-HSG.
The limitation of this study is that it only investigated the in vitro use of saline and two iodine water solutions mixed with gadolinium. Given the complexity of human anatomy, further in vivo studies on the SI and viscosity of contrast agents, as well as the optimization of MR scan parameters, are necessary to determine the optimal contrast agent and scan sequence for MR-HSG.
In conclusion, we recommend a 1:300 gadolinium-iodine mix as the contrast agent for 1.5 T MR-HSG and a 1:200 gadolinium-iodine mix for 3.0 T MR-HSG. The gadolinium-iodine mixed contrast agents, with its higher viscosity and safety, shows promise as the optimal contrast agent for MR-HSG. Moreover, the superior SI of the contrast agent on the 3.0 T scanner, combined with its other inherent advantages, suggests that 3.0 T MR-HSG may eventually replace 1.5 T MR-HSG.