



Abstract
Background
Organ preservation strategies have been widely implemented for rectal cancer (RC) patients with a good response after neoadjuvant chemoradiation (nCRT). However, to accurately select eligible patients remains one of the key diagnostic challenges.
Purpose
To identify eligible candidates for organ preservation after nCRT in RC, by identifying luminal response and lymph node metastases, based on T2W-MRI signal intensities.
Material and Methods
A total of 171 RC patients underwent MRI before and after nCRT. The primary tumor (pre-nCRT-MRI) and tumor remnant (post-nCRT-MRI) were manually delineated. Ten signal intensity features were extracted and delta features were calculated by subtraction. Histopathological evaluation classified patients as lymph node negative (ypN0) or positive (ypN+), and as good responders (GR) or partial/poor responders (PR). Five models were constructed based on the timing of imaging.
Results
42/170 (25%) patients had ypN+, and 72/152 (47%) patients were considered GR. Univariate analysis showed 13/40 signal intensity features were significantly different between luminal response groups and 4/40 between nodal response groups. In multivariate analysis, the Baseline + Restaging-model yielded the best results for both luminal and nodal response with AUCs in the test set of 0.81 (95% CI=0.67–0.95) and 0.74 (95% CI=0.59–0.90), respectively. To identify PR, the Delta-model yielded an AUC of 0.72 (95% CI=0.56–0.89) and the Delta + Restaging-model an AUC of 0.81 (95% CI=0.67–0.95), both were not able to differentiate nodal response. The models including solely baseline or restaging features were not predictive.
Conclusion
T2W-MRI signal intensities of the primary rectal tumor are related to the luminal and nodal response after nCRT and hold promise to identify patients eligible for organ preservation.
Introduction
Most patients with rectal cancer are treated with neoadjuvant therapy to induce downsizing and downstaging (1). Approximately 20% of patients achieve a complete response (CR) for which a watch and wait strategy is available (1,2). For patients with only minor residual abnormalities (considered a near complete response [near-CR]), extending the waiting period can be considered to maximize CR rates (3,4).
When an organ-preserving approach is followed, approximately 25% of patients develop a regrowth: the tumor grows back in the lumen, nodes, or both (5,6). In these patients, the response was likely overestimated and residual tumor missed, putting patients at a potential harm regarding long-term outcome. Overstaging of residual tumor is also encountered: up to 29% of CRs are missed with the best restaging method available (7). Another prerequisite for organ preservation is the absence of lymph node involvement. Even though nodal restaging after nCRT yields a higher accuracy than primary nodal staging, over- and understaging still occur regularly (8). Considering these limitations, further optimizing diagnostic performance for response assessment after nCRT is an important clinical issue.
Besides response assessment, prediction of response before the start of therapy would be beneficial to guide further tailoring of neoadjuvant regimens: if a response is expected to be poor, alternative treatments (or omission of futile nCRT) may be considered, while treatment can be escalated in patients likely to respond well to further enhance the chance of achieving CR. The evidence is still scarce on predicting which patients will develop a (near-) CR. Attempts have been made with several predictors like gene mutations, circulating tumor DNA, or collagen in the tumor microenvironment (9,10). But so far, results are heterogeneous, and no robust biomarker has made its way to clinical practice.
A quantitative analysis of magnetic resonance imaging (MRI) for outcome prediction in rectal cancer has also shown promising results (11–13). Specifically for T2-weighted (T2W)-MRI, studies show a correlation between the signal intensities derived from the tumor and the response to neoadjuvant therapy (14,15). However, most studies concentrated on predicting luminal CR and not on selecting patients for organ preservation in a broader clinical perspective, including the identification of both luminal CR and near-CR, but also yN0 patients after nCRT. Therefore, the aim of the present study was to investigate if signal intensities derived from T2W sequences, both at baseline and restaging MRI, can identify patients with a good luminal response (CR or near-CR), and yN0 status after neoadjuvant therapy; in other words, identify patients who are potentially eligible for a form of organ preservation.
Material and Methods
Patients
This retrospective study was approved by the institutional ethics committee and the requirement for informed consent was waived. A total of 171 patients were selected from a single-institution patient cohort (April 2003 to December 2015) based on the following inclusion criteria: (i) histopathological proven non-mucinous type rectal adenocarcinoma; (ii) availability of T2W-MRI pre- and post-nCRT (cases with artefacts were excluded, e.g. caused by bilateral hip prostheses); (iii) absence of distant metastasis; (iv) no previous history of rectal surgery; (v) no signs of concomitant perforation or abscesses; (vi) treatment including nCRT (daily fractions of 1.8 Gy for a total of 50.4 Gy and concomitant 825 mg/m2 oral capecitabine monotherapy) or neoadjuvant radiotherapy (5 × 5 Gy followed by a waiting period of at least 6 weeks to achieve response); and (vii) availability of a standard of reference consisting of either histology after surgery or at least 2 years of follow-up in case of a watch and wait protocol. The patient selection process is depicted in Fig. 1. The following baseline characteristics were collected from the medical records: age; sex; T-stage; N-stage; interval between baseline and restaging MRI; and chemotherapy treatment, which consisted of two cycles during the waiting time between radiotherapy and surgery, which was part of clinical practice based on regional guidelines that deviated from international guidelines.

Flowchart. Patient selection process including response categories. GR, good responders; PR, partial/poor responders.
MRI protocol
MRI measurements were performed at 1.5 T (Philips Intera, Ingenia, and Achieva Medical Systems, Best, the Netherlands). The standard protocol included routine T2W-MRI in sagittal, transverse, and coronal planes. The transverse plane was angled perpendicular to the tumor axis and the coronal plane was angled parallel to the tumor axis as identified on the sagittal plane. The images were obtained using turbo spin echo sequences with an echo time (TE) in the range of 130–150 ms and a repetition time (TR) in the range of 3000–16,738 ms. The median slice thickness was 3 mm (range = 3–5 mm), the matrix was either 512 × 512 or 256 × 256, with a median in-plane resolution of 0.78 (range = 0.39–0.78).
Defining response groups
The response groups were based on histopathological evaluation after total mesorectal excision (TME) surgery or successful organ preservation. The Tumor Regression Grade (TRG) according to Mandard was used as the standard of reference for the luminal response (16). Two response groups were defined: good responders (GR), including both CR patients with a TRG of 1 (“no viable cancer cells”) and near-CR with a TRG of 2 (“rare cancer cells scattered through fibrosis”); and partial/poor responders (PR), including all patients with a TRG 3 to TRG 5 (“increased number of residual cancer cells with fibrosis predominated” to “absence of regressive changes”). GR are potentially eligible for organ preservation, while PR are generally considered not eligible. For nodal staging, patients were split into two groups based on nodal staging at histology: ypN0 versus ypN+. Patients in the watch and wait protocol were categorized in the GR and ypN0 group, if no regrowth was detected during ≥24 months after nCRT as established with regular follow-up MRI of the rectum and endoscopy, according to previously described follow-up protocols (5,6).
Workflow
Volumes of interest (VOIs) were drawn manually to include the whole tumor volume (and/or residual tissue/fibrosis within the tumor bed for the restaging MRIs) on the transverse T2W-MRI (Fig. 2). Delineations were performed by a single reader (SGD) with 4 years of experience who was supervised by an expert radiologist (MM) with 10 years of experience in rectal cancer MRI. Both were blinded for treatment outcomes (i.e. restaging, surgery, endoscopy, and pathology reports after treatment). VOIs were drawn using 3Dslicer (version 4.6, http://www.slicer.org) (13). The reader was instructed to avoid inclusion of any mesorectal fat, normal bowel wall, or lumen (gas or fluid). For signal normalization, an additional VOI was placed in one of the obturator internus muscles. The signal intensity of the tumor was calculated and normalized to the average signal intensity of the obturator internus muscle. In addition, histogram image analysis was performed on the VOIs with PyRadiomics (17). Extracted features included: mean; median; minimum; maximum; range; standard deviation (SD); skewness; kurtosis; and 10th and 90th percentiles of the T2W signal intensity before and after nCRT. Absolute Delta features (Δ) were calculated for all the extracted parameters by subtracting the pre-nCRT values minus the post-CRT values. This change, expressed as a percentage of the pre-nCRT values, was calculated and termed the Percentage Delta features.

Examples of delineations of the VOI of the primary rectal tumour (<) and the ROI in the right obturator internus muscle (*) on (a) pre-CRT MRI and (b) post-CRT MRI in a patient with PR and ypN0.
Statistical analysis
All analyses were performed using R version 4.2.3 (RStudio, Vienna, Austria) (18). Descriptive statistics were used to provide baseline characteristics, which were tested for independence with a t-test for numerical variables and a chi-square test or Fisher’s exact test for categorical variables depending on the size per category. A P value ≤0.05 was considered statistically significant. All signal intensity features were standardized (X′=(X-mean)/standard deviation) on a per time point basis. For the univariate logistic regression analysis, signal intensity features were compared between the outcome groups using ANOVA, while corrected for the differences in clinical parameters. The Benjamini–Hochberg procedure was used to correct the P values for multiple testing at a false discovery rate (FDR) of 5%.
For the multivariable analysis, the groups were divided into a training set and a test set in a 3:1 split, while preserving the proportions of the outcomes. The reference categories for the luminal response and nodal response outcomes were GR and ypN0, respectively. The best multivariate logistic regression model was determined using backward elimination regression. Multivariate analysis included the clinical parameters, the signal intensity features, and the MRI scanner as a confounding variable to account for potential feature variation caused by hardware differences. All AUC computations were performed using the roc function in the pROC 1.18.5 package in R. The confidence interval of the AUCs were obtained via bootstrapping.
Five different models were constructed based on the timing of imaging: (i) the Baseline model only included signal intensities from the baseline MRI; (ii) the Restaging model only included features from restaging MRI; (iii) the Delta model selected Absolute delta features and Percentage delta features; (iv) the Baseline + Restaging model selected signal intensities from both baseline and restaging MRI; and (v) the Delta + Restaging model combined delta features with signal intensities from restaging MRI.
Results
Patient characteristics
A total of 171 patients (mean age = 67 ± 10 years) were included. The baseline patient characteristics are summarized in Table 1. A total of 150 patients received nCRT and 21 patients received 5 × 5 Gy with a long waiting period (at least 6 weeks), which is deemed to give the same biological response as long-course nCRT (19,20). In total, 74 patients were treated with two cycles of chemotherapy in the waiting time. The watch and wait protocol was followed by 22 patients without regrowth during follow-up. For 19 patients, the TRG was missing in the histopathology report; therefore, they were excluded from the luminal response analysis, resulting in 72 patients being considered GR and 80 patients PR. For the nodal status, 129 patients had ypN0 and 42 patients had ypN+.
Patient characteristics.

Values are given as n (%), mean ± SD, or median (range).
*Statistically significant.
GR, good responder; MRI, magnetic resonance imaging; PR, partial/poor responder.
Luminal response
None of the signal intensity features derived from the baseline MRI were predictive for the luminal response (GR vs. PR). For the restaging MRI, absolute delta and percentage delta features, mean, median, and 90th percentile were statically significant after FDR adjustment, with odds ratios (OR) in the range of 1.93–3.52 for PR. The univariate analysis results are displayed in Table 2. In the multivariate analysis, 3/5 models (Delta, Baseline + Restaging, Delta + Restaging) were able to identify PR. The Baseline + Restaging model yielded the best results, with an AUC of 0.81 (95% CI = 0.67–0.95) in the unseen test cohort, and included five baseline features (SD, skewness, kurtosis, 10th percentile, 90th percentile), three restaging features (minimum, maximum, and 10th percentile), and two clinical parameters (cT-stage and chemotherapy). The Delta model identified PR in the test set with an AUC of 0.72 (95% CI = 0.56–0.89). The Delta + Restaging model reached an AUC of 0.81 (95% CI = 0.67–0.95). Table 3 displays the results of all models in both training and validation.
Univariate analysis.

*GR was used as the reference group.
Statistically significant
ypN0 was used as the reference group.
Nearly statically significant.
FDR, false discovery rate; OR, odds ratio; SD, standard deviation.
Multivariate analysis.
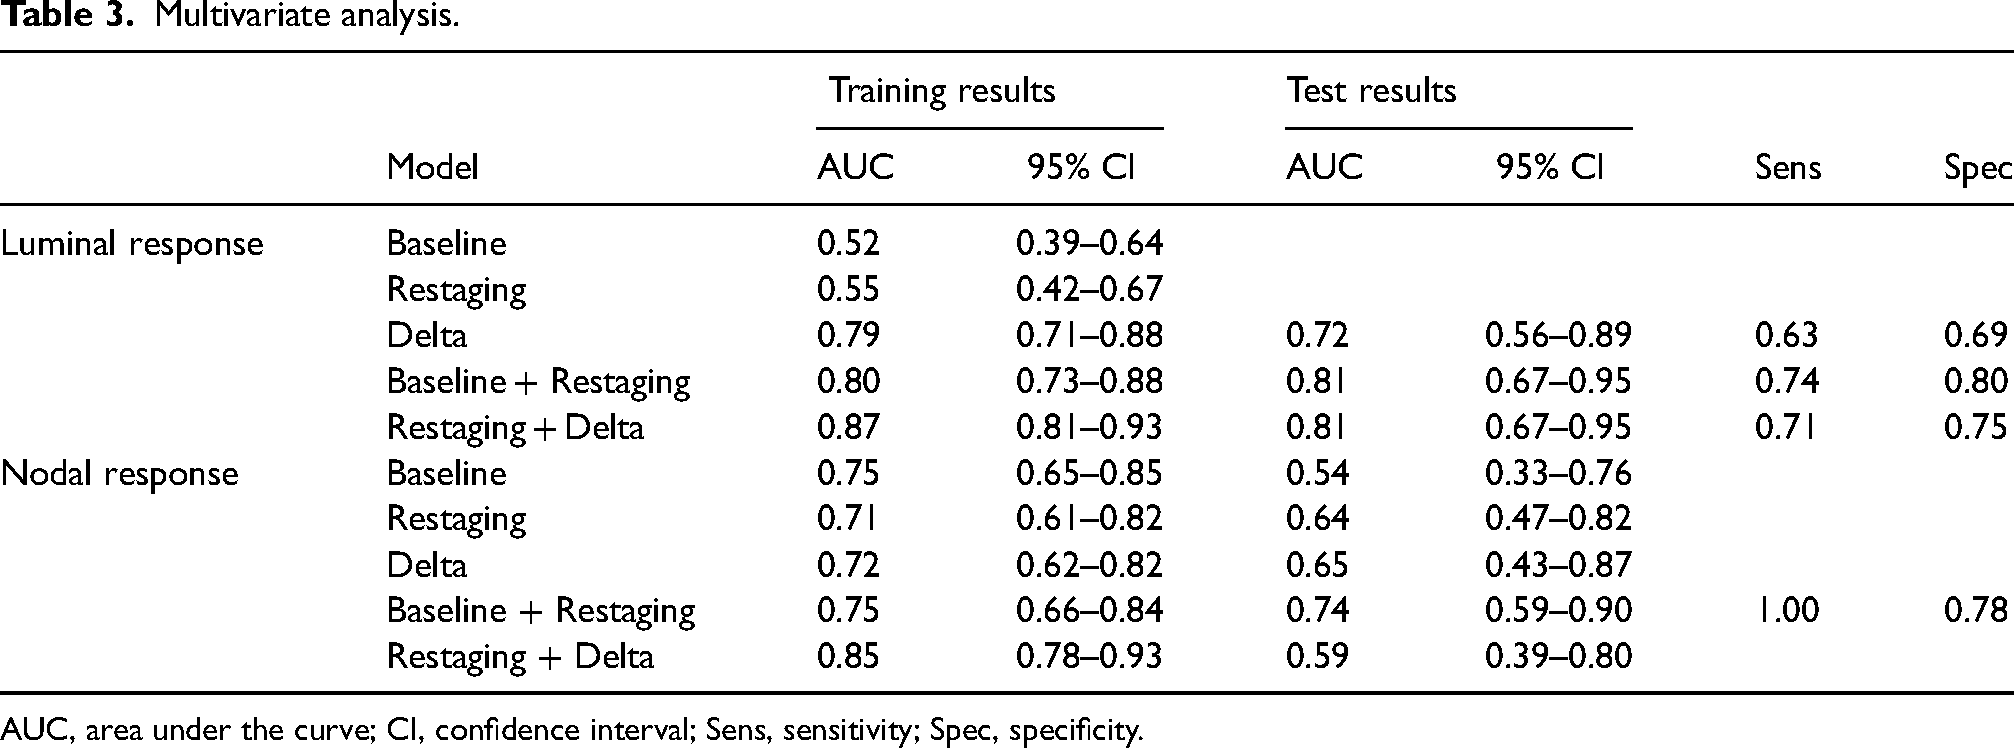
AUC, area under the curve; CI, confidence interval; Sens, sensitivity; Spec, specificity.
Nodal response
None of the baseline nor absolute delta features were able to identify ypN+ in the univariate analysis (Table 2). The Baseline + Restaging model was the only one able to identify ypN+ in the multivariate analysis, with an AUC of 0.74 (95% CI = 0.59–0.90). It included two baseline features (mean, median), four restaging features (minimum, maximum, skewness, 10th percentile). and two clinical features (age, cT-stage). The full models are included in Supplementary Material A.
Discussion
Our models combining clinical parameters with signal intensities derived from both baseline and restaging MRI after neoadjuvant therapy show a good accuracy to select patients potentially eligible for organ preservation. In addition, delta features (i.e. features comparing restaging to baseline measurement values) yielded good results for differentiation of luminal response but were not able to identify lymph node metastases. Unfortunately, response prediction based on only baseline imaging did not perform well. Performance using only restaging input was also low, emphasizing the benefit of comparing restaging to baseline data. Furthermore, our results suggest that the signal intensities of the primary tumor are correlated with the nodal response after neoadjuvant therapy.
All three models combining signal intensity input from two different time points were able to differentiate luminal response (AUCs in the range of 0.71–0.82). This is in line with studies investigating dynamic contrast-enhanced (DCE) MRI, where pre- or post-treatment Ktrans values by themselves were not predictive for response, but the relative decrease (delta-) Ktrans was predictive (21). A similar trend was observed in radiomics studies, in which delta-radiomics features outperformed features from a single time point (22–24). This suggests that the relative change in imaging features between different timepoints within a patient is more related to response, than the differences between individual patients at a single timepoint. Nardone et al. showed in a phantom study how delta features were more robust compared to features from one time point alone, supporting the reproducibility (25).
Signal intensities derived from solely baseline, or solely restaging, MRI were not able to identify the luminal response to nCRT. This is in contrast with multiple studies that reported positive results for T2W-based radiomics response prediction before nCRT (23,26–29). Shahzadi et al. validated 11 published models on a multicenter dataset and found only 1/11 remained predictive. This indicates a lack of robustness of the positive results described in the literature. To enhance the reproducibility in our study, only signal intensity features were included, which are known for their greater re-test and re-segmentation reliability (30–32). However, this could account for why our model was not predictive, as in studies with better results often select higher order features for the final model (23,27,29). It is possible that higher order features can better reflect tumor heterogeneity, which is linked to response rates.
Moreover, our study showed a correlation between the signal intensity of the primary tumor and lymph node metastases after nCRT in univariate analysis. In addition, Yang et al. reported this correlation, but opposite to our results: they described a lower kurtosis and skewness of the primary tumor in ypN+ (33). Our multivariate Baseline + Restaging model yielded a reasonable AUC of 0.74 for ypN+ identification. Zhou et al. describes an AUC of 0.92 to identify ypN+ with their multi-sequence model based on solely post-nCRT MRI (34). We hypothesize their higher performance was due to the inclusion of higher order radiomics features and applying it in a specific subgroup with low (1–2) ycT-stage, who have a lower chance for ypN+. Although lymph nodes generally respond analogously to the primary tumor, 7% of ypT0 cases still exhibit ypN+ disease (35,36). This indicates that while the response is comparable, it is not identical to the primary tumor response, which explains the inferior results for nodal response compared to luminal response.
Currently in clinical practice, morphological assessment and diffusion-weighted imaging (DWI) are used to evaluate response after treatment together with endoscopy (37,38). Morphological changes, such as a decrease in size and fibrosis, indicate response after chemoradiation; however, the sensitivity to detect complete response based on morphological changes alone is only 50% (38,39). DWI demonstrates superior performance in detecting residual disease, as areas of remaining diffusion restriction correspond to residual tumor (40). However, the sensitivity of DWI remains quite variable, as small foci of diffusion restriction – likely reactive or inflammatory changes rather than tumor –are challenging to interpret. Even when combining T2W-MRI and DWI, the detection rate of CR is quite low. Endoscopy is therefore used to improve sensitivity; with this three-modality approach, a sensitivity of 71% can be achieved (7). This means that CRs are still missed and there is a need for other methods. Moreover, diffusion restriction is not predictive for lymph node metastases on both pre- and post-treatment MRI (as all nodes – benign or malignant – show diffusion restriction), while absence of nodal involvement is an important prerequisite for organ preservation (41). Combining techniques will probably achieve the best results. In our study, we solely analyzed signal intensities and found an AUC of 0.81 to identify patients with a good luminal response. We hypothesize that when the use of signal intensity is combined with other parameters and modalities (i.e. endoscopy, visual assessment of imaging, and clinical parameters), the sensitivity to select patients for organ preservation can be improved.
For future research, prediction before the start of treatment is particularly relevant. Earlier tumors are increasingly treated with neoadjuvant therapy to achieve primary organ preservation, even though not necessary for oncological reasons. These patients have a high risk of overtreatment and can potentially be harmed, as many patients do not develop a CR and still need to undergo TME, while TME after nCRT is associated with higher morbidity than without neoadjuvant treatment (42). This study specifically focused on T2W signal intensity, but including data from other sequences could potentially add beneficial information for the prediction of response. The downside is that more sequences will also increase the variability in acquisition parameters, impacting reproducibility.
The present study has some limitations aside from its single-center retrospective nature. No external validation was performed, meaning the results need to be interpreted with caution. Furthermore, we based our outcome on the TRG according to Mandard classifying GR as patients with 0%–10% residual tumor cells at pathology. It is very clear which patients reach a pathological CR, but it remains unclear which patients can be considered a near-CR, and thus who benefits most from additional therapy or organ preservation. For 19 patients, the TRG was unavailable, which was not complemented with ypT-stage to prevent mixing the outcome group. Intervals between restaging and surgery date or date for inclusion of organ preservation were missing. Lastly, segmentation after nCRT can be challenging due to therapy-induced changes.
In conclusion, by combining baseline and restaging MRI, signal intensities derived from the primary tumor were indicative for luminal and nodal response after neoadjuvant chemoradiation in rectal cancer, and therefore have potential for identifying patients eligible for organ preservation. Delta features showed promising results for differentiating luminal response but not for nodal response, making it less suitable for patient selection. Signal intensities from solely baseline or restaging MRI were not related to response, highlighting the complementary value of baseline and restaging input for the assessment of response after neoadjuvant therapy.
Supplemental Material
sj-docx-1-acr-10.1177_02841851241309008 - Supplemental material for Selection of rectal cancer patients for organ preservation after neoadjuvant therapy: value of T2W-MRI signal intensity
Supplemental material, sj-docx-1-acr-10.1177_02841851241309008 for Selection of rectal cancer patients for organ preservation after neoadjuvant therapy: value of T2W-MRI signal intensity by Denise J van der Reijd, Xinde Ou, Rebecca AP Dijkhoff, Silvia G Drago, Renaud Tissier, Joost JM van Griethuysen, Doenja MJ Lambregts, Frans CH Bakers, Janneke B Houwers, Regina GH Beets-Tan and Monique Maas in Acta Radiologica
Footnotes
Declaration of conflicting interests
The authors declared no potential conflicts of interest with respect to the research, authorship, and/or publication of this article.
Funding
The authors received no financial support for the research, authorship, and/or publication of this article.

Supplementary material
Supplementary material for this article is available online.
References
Supplementary Material
Please find the following supplemental material available below.
For Open Access articles published under a Creative Commons License, all supplemental material carries the same license as the article it is associated with.
For non-Open Access articles published, all supplemental material carries a non-exclusive license, and permission requests for re-use of supplemental material or any part of supplemental material shall be sent directly to the copyright owner as specified in the copyright notice associated with the article.
