
Abstract
Background
It can be difficult to differentiate hypervascular hepatocellular carcinoma (HCC) from hypervascular pseudolesion (HPL) such as arteriovenous shunts.
Purpose
To determine retrospectively whether double-layer detector computed tomography (DLCT) can differentiate HCC from HPL compared to gadoxetate-enhanced magnetic resonance imaging (EOB-MRI).
Material and Methods
We retrospectively analyzed 46 patients who underwent EOB-MRI and DLCT for suspected HCCs. Arterial/portal phase and hepatobiliary phase (HBP) on EOB-MRI, T2-weighted (T2W) imaging, diffusion-weighted imaging (DWI), apparent diffusion coefficient (ADC), CT value, iodine-density (ID), atomic-number (Zeff), and electron-density (ED) of the lesion and liver were evaluated. The reduction rates of ID (R-ID) between each phase of the arterial/portal phase on EOB-MRI were calculated. ROC analysis was performed to determine the accuracy for differentiating HCC from HPL.
Results
There were 55 HCCs and 14 HPLs. On DWI, 42, 11, and two HCCs showed high, slightly high, and iso intensity, respectively. However, all 14 HPLs showed iso intensity on DWI. Area under ROC curve (AUC) of DWI (0.982, 95% confidence interval [CI]=0.957–1) was significantly higher than that of HBP (AUC=0.714; 95% CI=0.580–0.849; P < 0.001), R-ID (AUC=0.742, 95% CI=0.580–0.903; P = 0.004), and ED of portal phase (AUC=0.786, 95% CI=0.640–0.891; P = 0.001) in differentiating HCC and HPL. ADC (<0.001), T2W imaging (<0.001), HBP (<0.001), ED-arterial-phase (<0.001), ED-portal-phase (=0.003), ED-equilibrium-phase (=0.001), R-ID-between-arterial/equilibrium-phase (=0.032), and R-ID-between-portal/equilibrium-phase (=0.042) showed significant differences between HPL and HCC.
Conclusion
DWI is most useful for differentiating HCC from HPL, although ADC, T2W, HBP, R-ID, and ED may also be relatively useful to differentiate between HPLs and HCCs.
Keywords
Introduction
Hepatocellular carcinoma (HCC) is one of the most common cancers globally. It is recommended that it is examined by contrast-enhanced imaging after rapid intravenous injection for the detection and characterization of liver tumors. Abdominal ultrasonography, computed tomography (CT), and magnetic resonance imaging (MRI) are commonly used to detect and diagnose HCC. The radiological criteria for HCC (1) are well established. It is important to detect a hypervascular tumor in the arterial phase, with washout in the portal or equilibrium phase, although hypervascular pseudolesions (HPLs) in the arterial phase can be problematic to differentiate. HPL is recognized as alterations in intrahepatic hemodynamics and sometimes shows a focal mass-like finding that is observed only on diagnostic imaging (2). Some HPLs may be associated with histopathologic changes, such as focal hyperplasia, focal fatty liver, and focal sparing of fatty liver (3). HPL may appear similar to HCC on imaging but is not due to actual tumors. Distinguishing between HPLs and HCCs is important to avoid unnecessary interventions and potential harm to the patient. Motosugi et al. reported that no nodular HPLs were visible on diffusion-weighted imaging (DWI) for HPL when using CT during hepatic arteriography (CTHA) (4). In addition, both Motosugi et al. (4) and Kim et al. (5) reported that DWI shows no signal anomalies at HPL.
Gadoxetic acid-enhanced MRI (EOB-MRI) is used to evaluate focal liver lesions, such as HCC on three-dimensional T1-weighted (3D-T1W) imaging, and HCC is normally hypointense to background liver on T1W imaging. HCC shows arterial phase hyperenhancement and washout. EOB-MRI has a higher detection of HCC at the hepatobiliary phase, but HCC may not be detected in the liver parenchyma with hepatic dysfunction because the liver parenchymal enhancement by liver-specific contrast agents is poor. In such patients with poor liver function, T2-weighted (T2W) imaging, DWI, and apparent diffusion coefficient (ADC) provide useful information for the diagnosis of HCC (4,6). Liver Imaging Reporting & Data System (LI-RADS) is a standardized system in patients for developing HCC, and this algorithm guides radiologists from benign to HCC, although some cases are difficult to diagnose, such as LI-RADS 3 (intermediate probability of malignancy), LI-RADS 4 (probably HCC), etc. (7). HPL may show LI-RADS 2 (probably benign), but round HPLs are sometimes difficult to distinguish from HCC, because smaller HCCs may not have apparent washout.
Dual-energy CT (DECT) using two different X-ray energy spectra has received increasing attention for obtaining material-specific information (8). We can know iodine density (ID), effective atomic number (effective Z; Eff-Z), and electron density (ED) of substances. The ED reflects the probability of an electron being present at a specific location, depending on the molecule and the molecular structure (9). Dual-layer detector CT (DLCT) is a type of DECT in which the detector has two layers. Can the quantitative assessment of liver lesions using DLCT go beyond assessment by visual or measured CT values? The aim of the present study was to explore the role of multiple parameters using DLCT imaging and EOB-MRI for the quantitative assessment of liver lesions in the differentiation between hypervascular HCC and HPL.
Material and Methods
Patients
This observational cohort study was retrospectively conducted and approved by the institutional review board (reference no. RK-210413-9). The requirement for informed consent was waived due to the retrospective nature of the study. Between July 2021 and June 2022, 206 consecutive patients underwent liver dynamic CT for liver tumors using a DLCT scanner (IQon spectral CT; Philips Healthcare, Best, the Netherlands). The inclusion criteria were as follows: (i) patients who received EOB-MRI within 3 months before or after DLCT; and (ii) patients who had HCCs or HPLs. After searching the database of radiologic reports and CT images at our hospital, we identified patients to compare HCC and HPL who matched the abovementioned criteria. The exclusion criteria were patients who could not be analyzed due to image deficiency or degradation (Figs. 1–4).
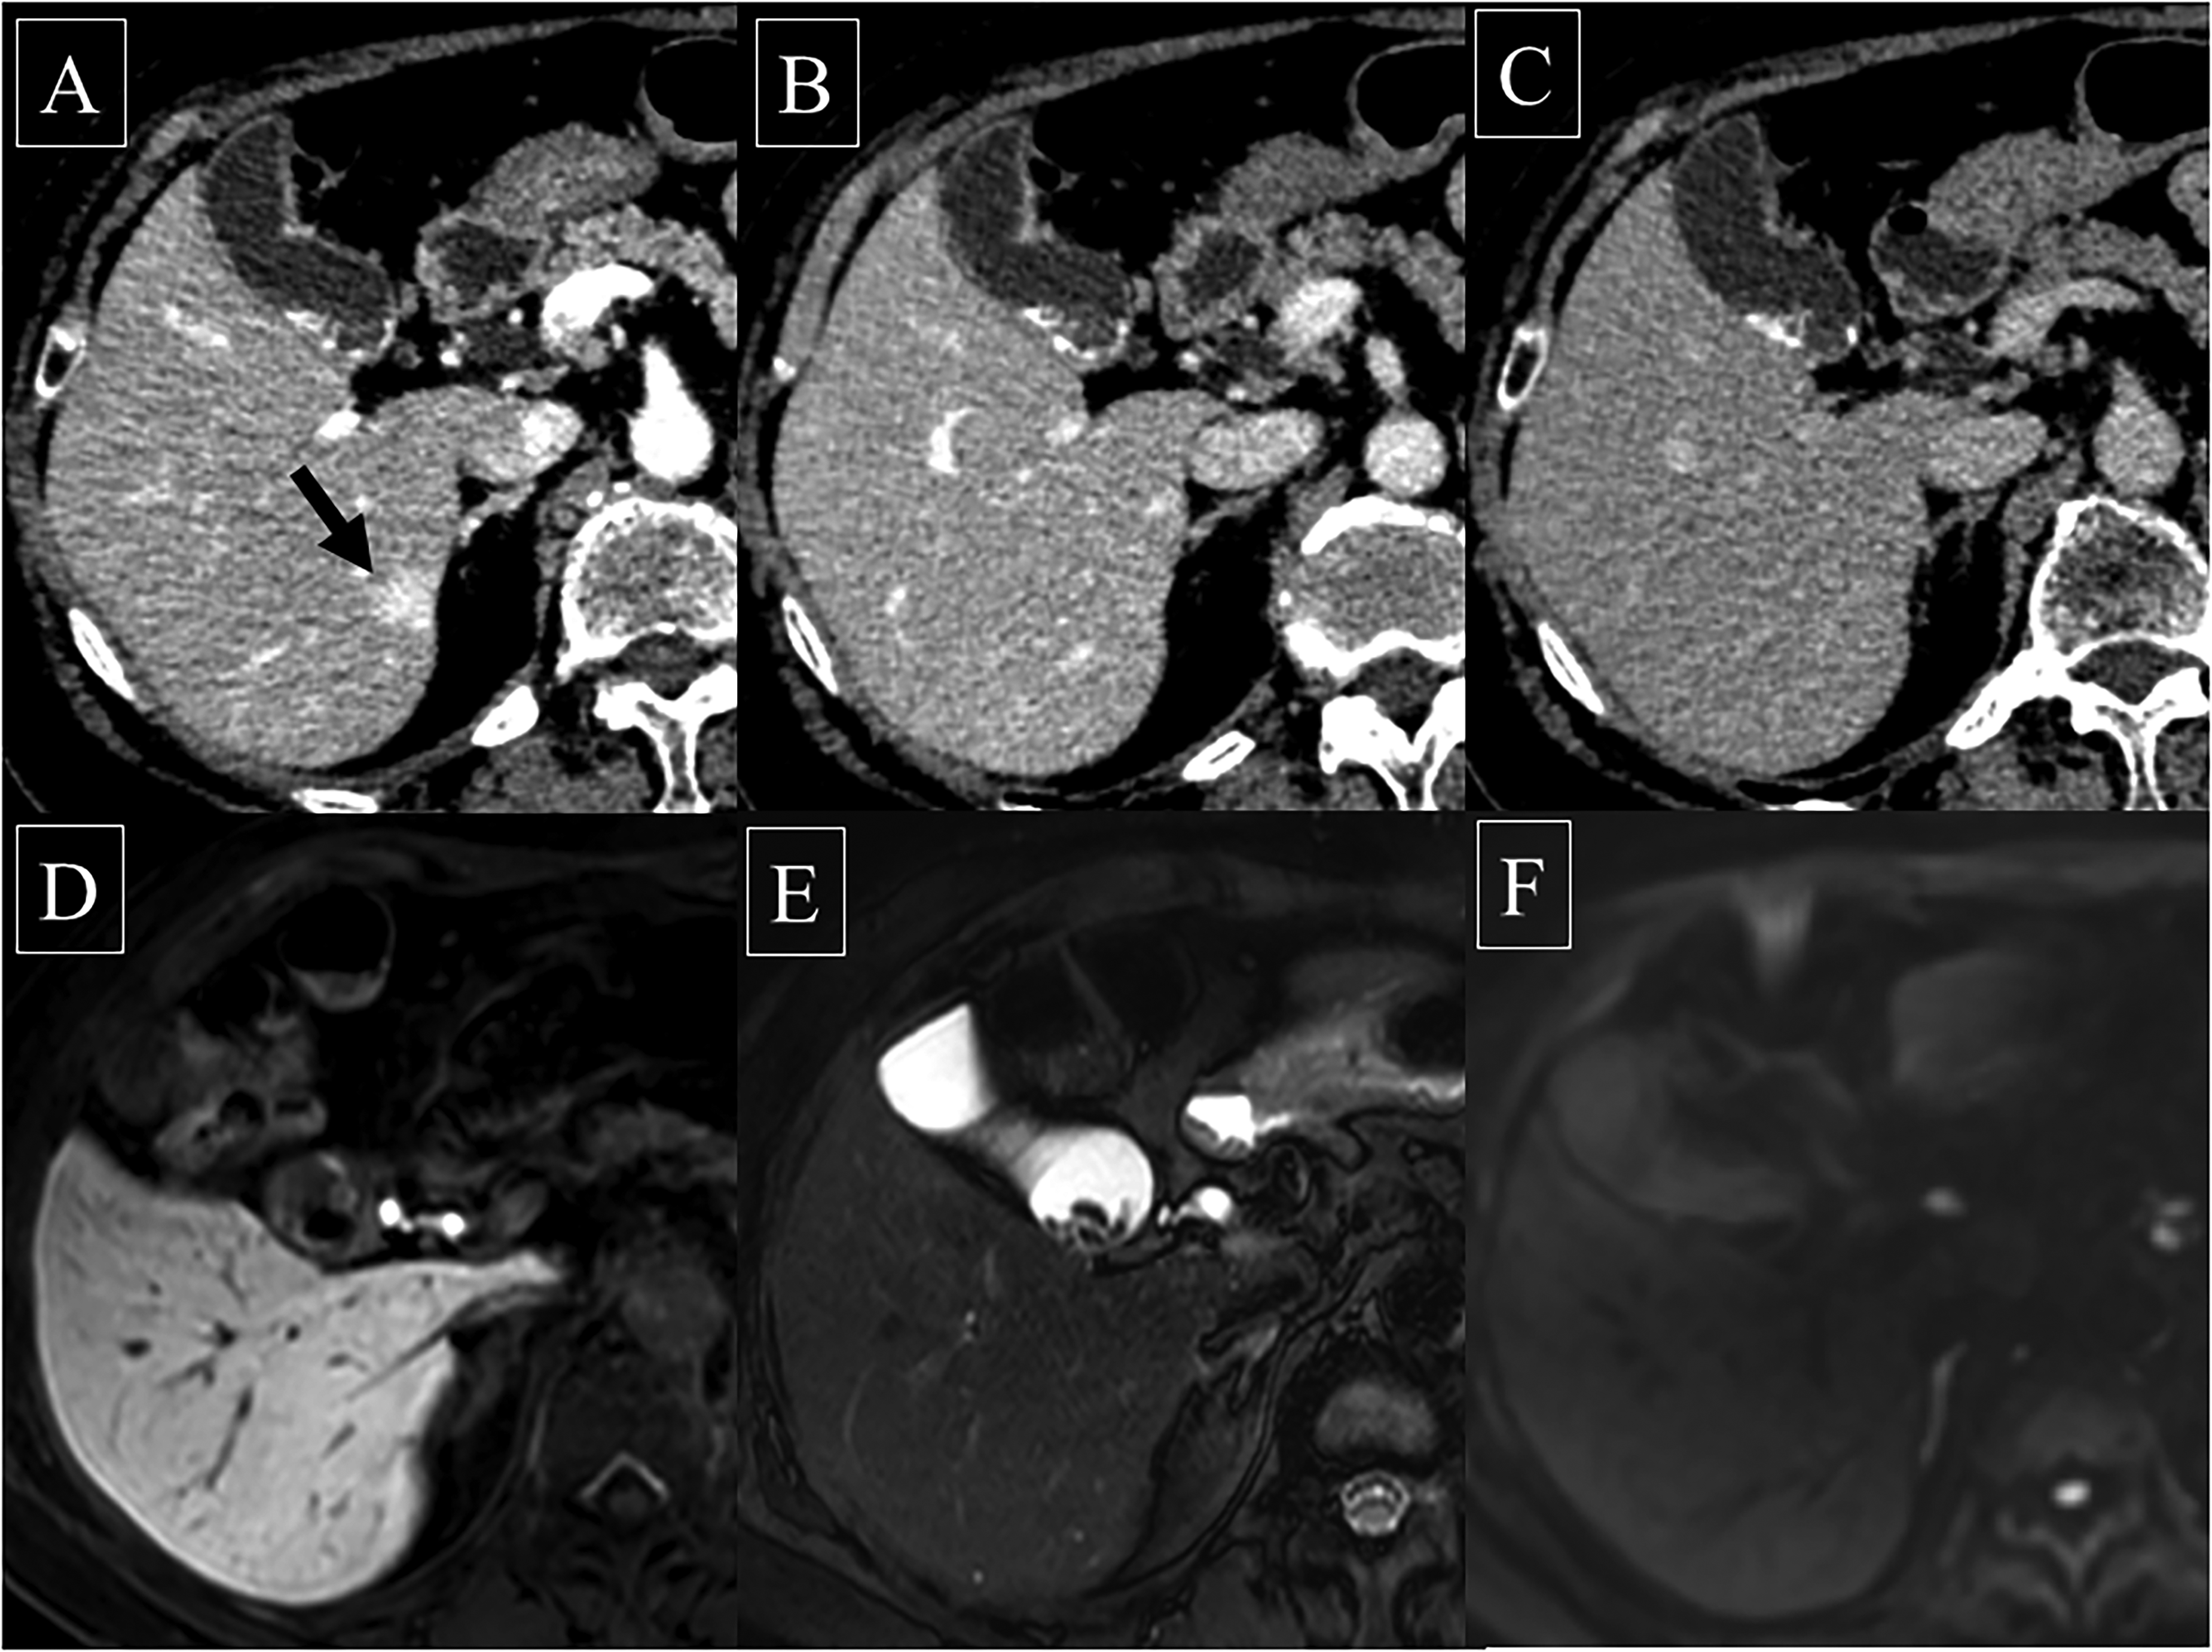
Hypervascular pseudolesion; liver contrast-enhanced dynamic CT and MRI. (a) A nodule with a 1.3 cm diameter was seen as early staining in liver segment 6 at the arterial phase, although it was not seen at (b) the portal phase or (c) the equilibrium phase. (d) The hepatobiliary phase of gadoxetic acid-enhanced MRI: (e) T2-weighted imaging and (f) diffusion-weighted imaging showed iso intensity compared to the surrounding liver parenchyma. The gallbladder had gallstones. CT, computed tomography; MRI, magnetic resonance imaging.
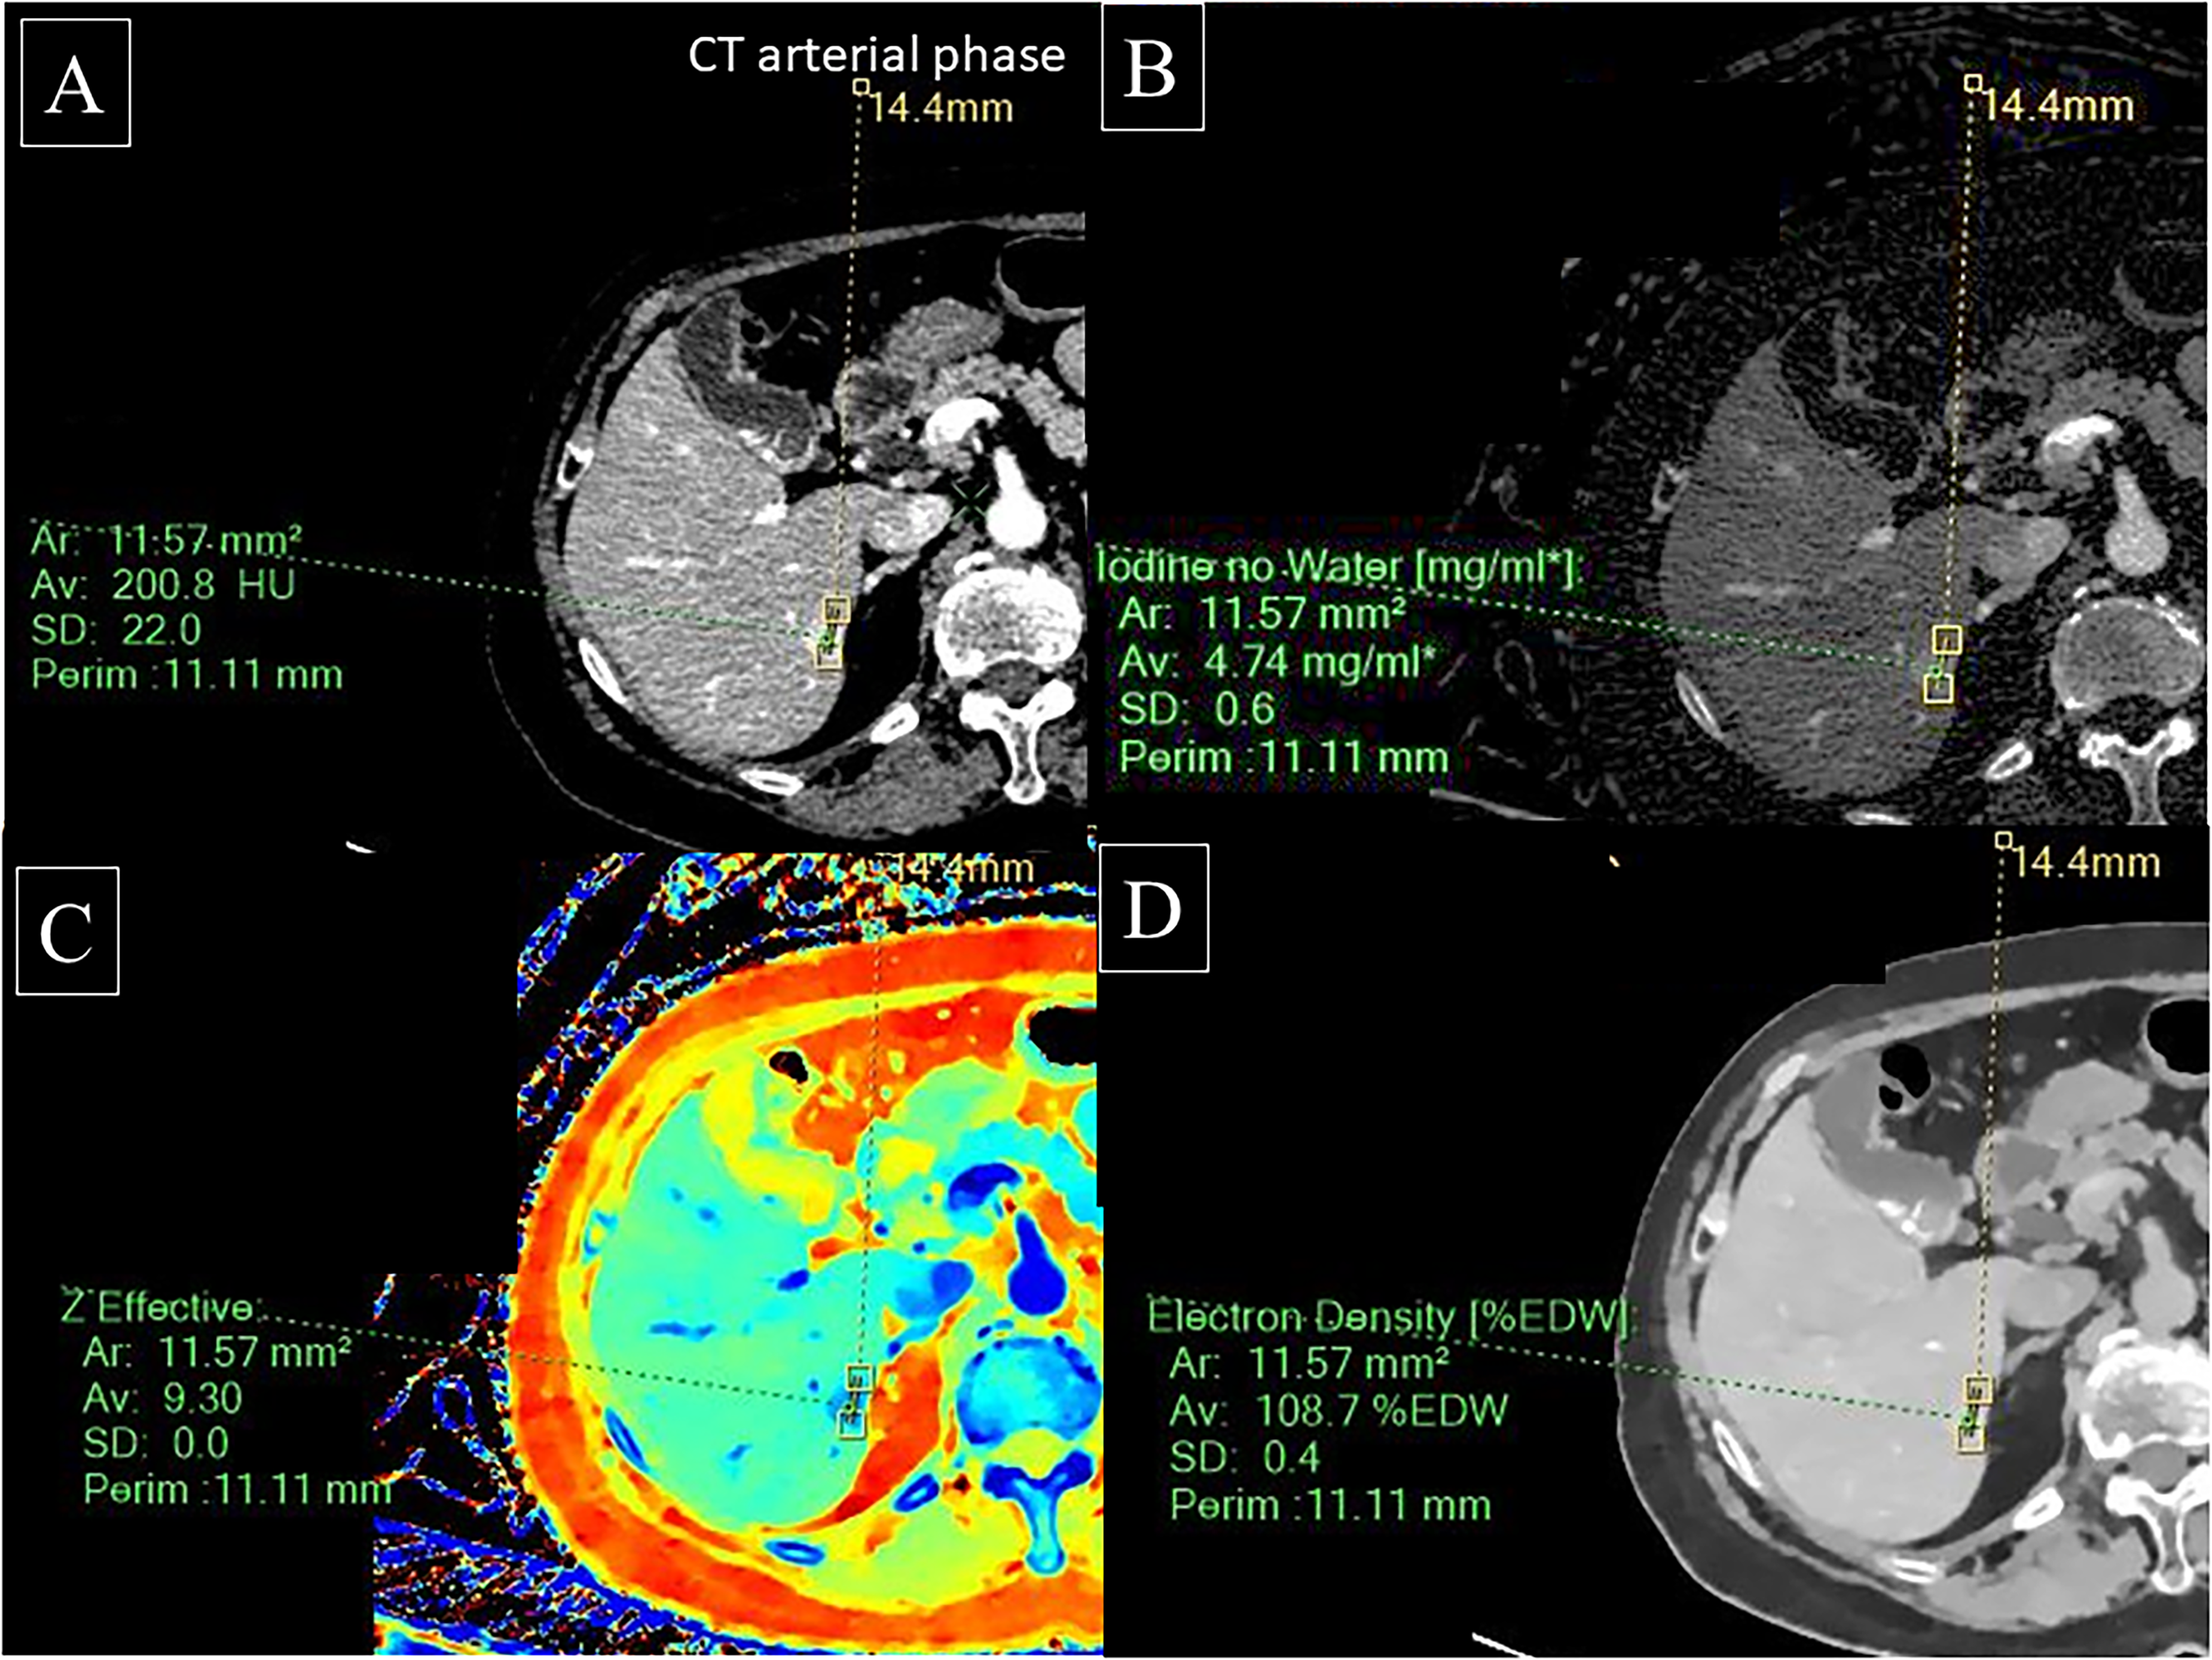
Hypervascular pseudolesion; analyzed parameters by dual-layer spectral detector CT. A nodule in liver segment 6 at the arterial phase showed (a) a CT value of 200.8 HU, (b) an iodine density of 4.74 mg/mL, (c) anatomic number of 9.30, and (d) an electron density of 108.7%EDW. CT, computed tomography.
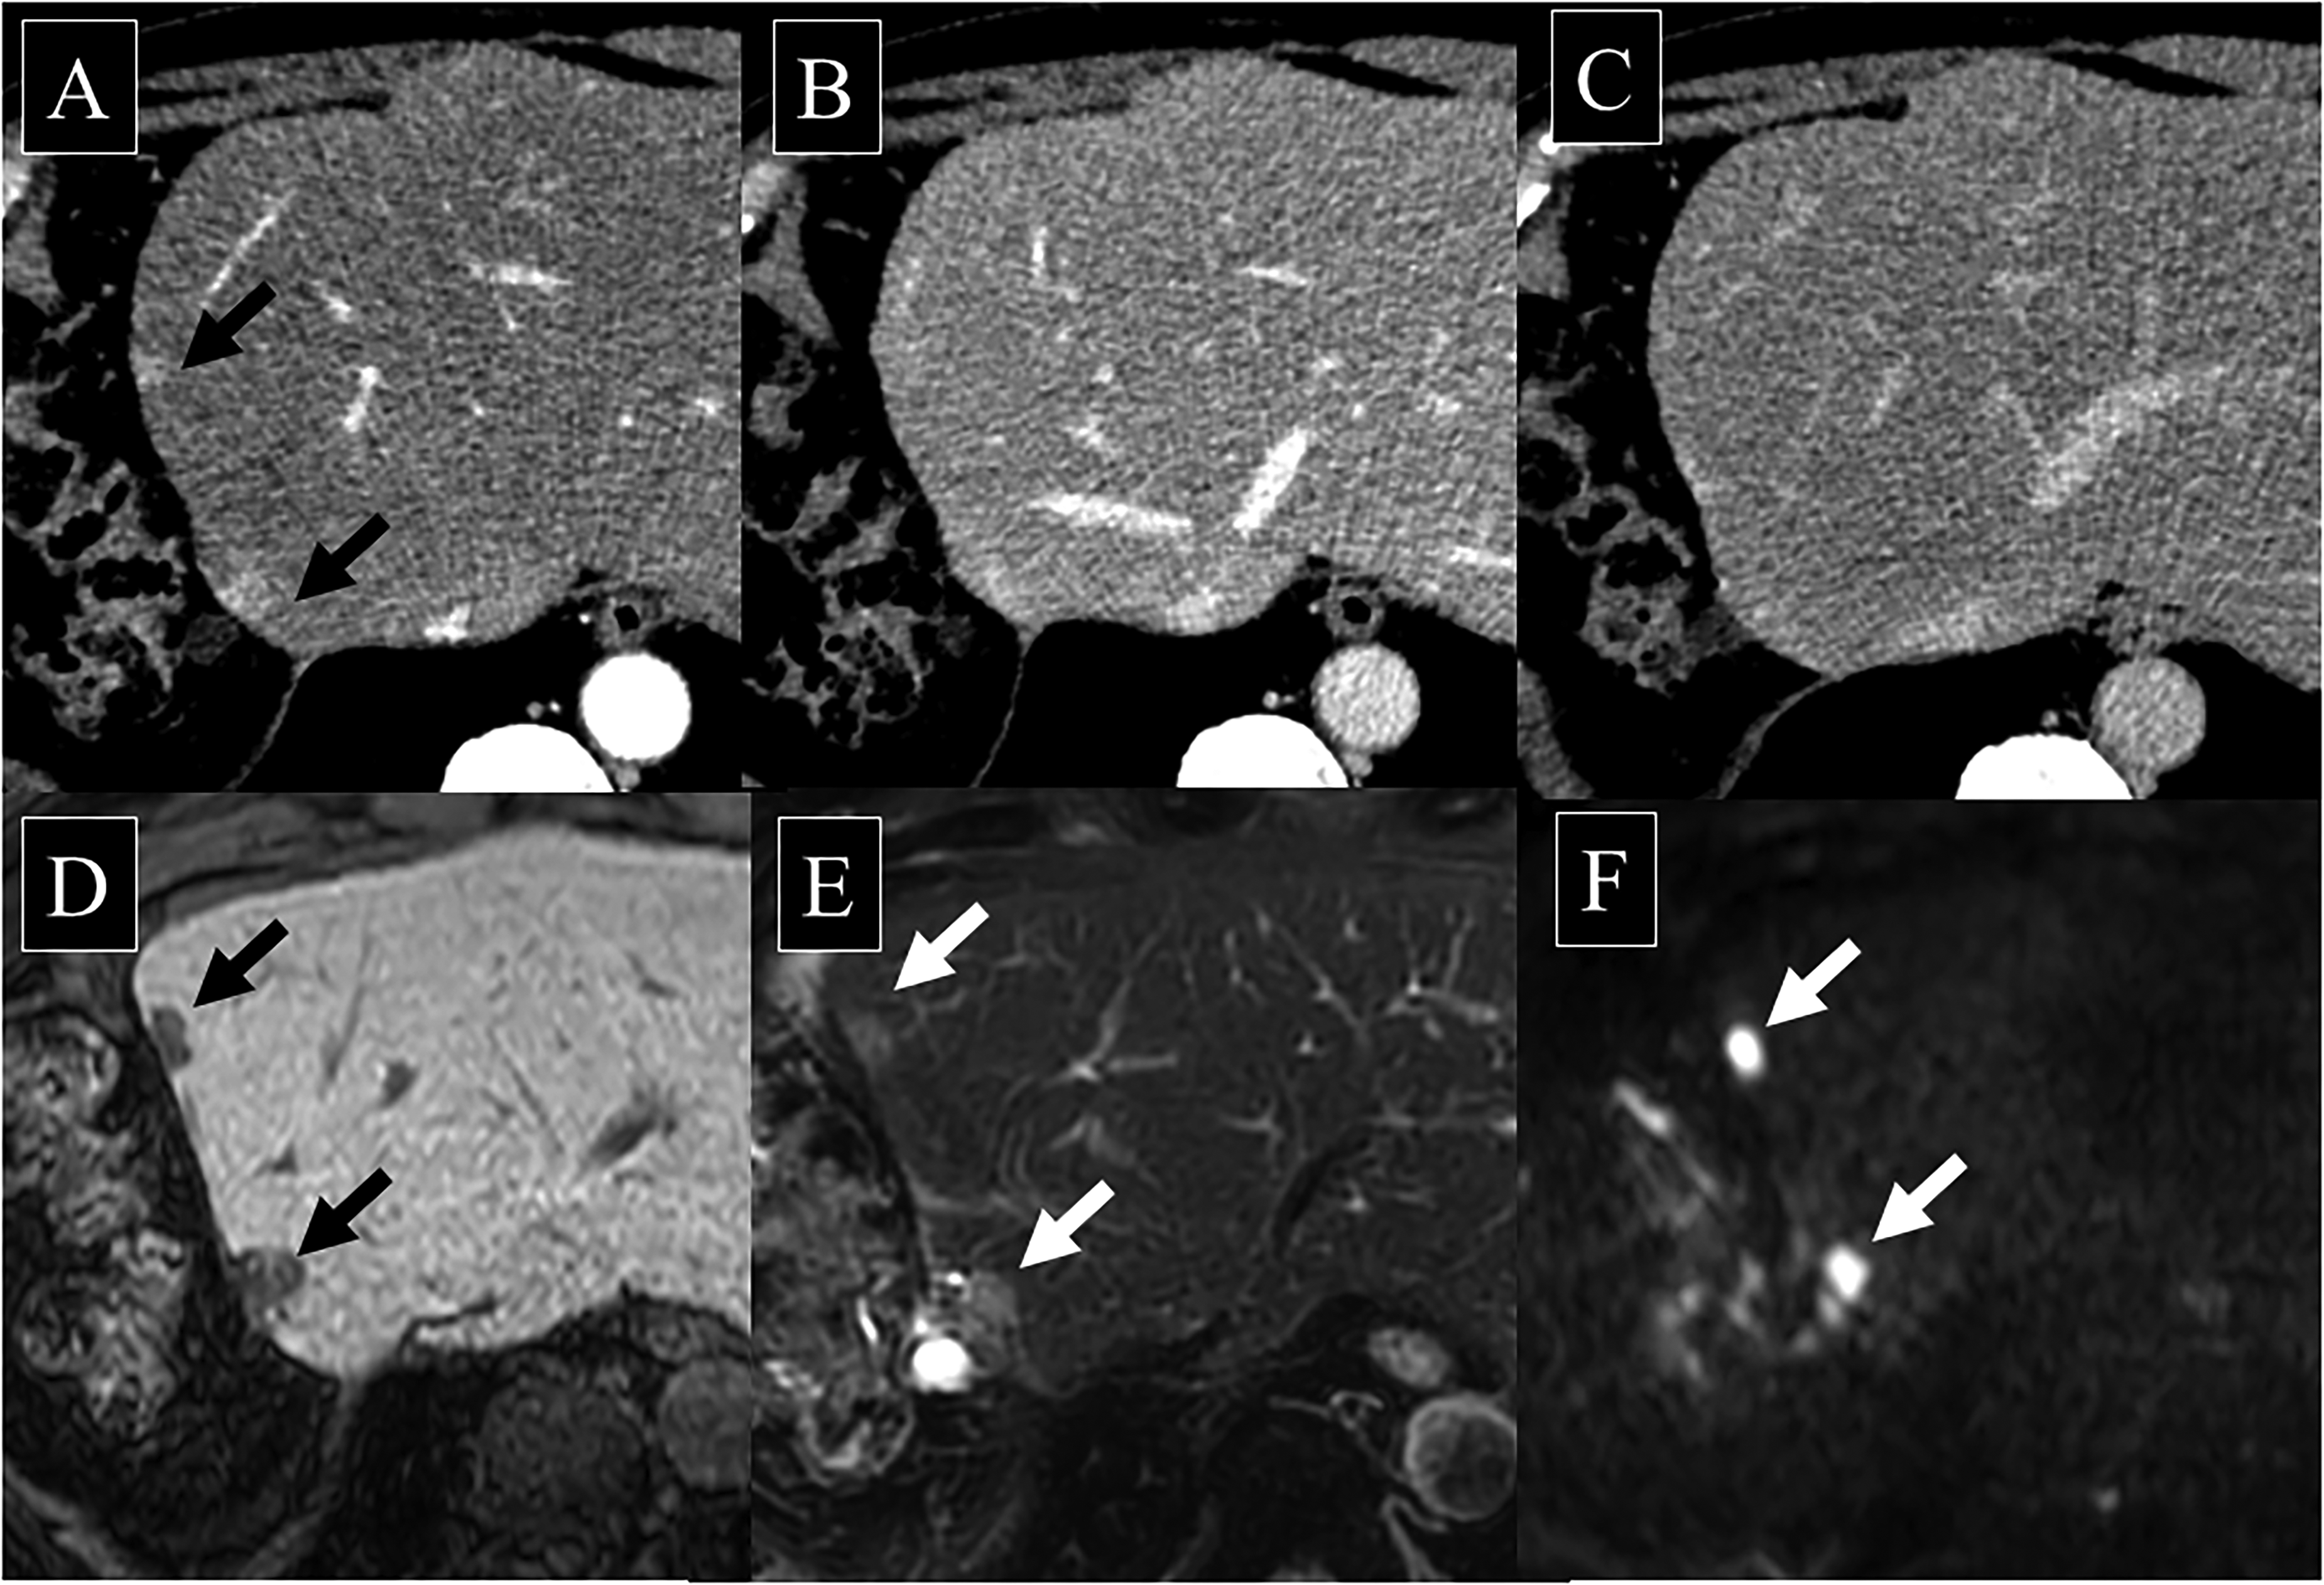
Hepatocellular carcinoma; liver contrast-enhanced dynamic CT and MRI. (a) Two nodules with diameters of 1.2 cm and 1.0 cm were seen as early staining in liver segment 4 at the arterial phase, although they were not seen at (b) the portal phase or (c) equilibrium phase. (d) The hepatobiliary phase of gadoxetic acid-enhanced MRI showed low intensities and (e) T2-weighted imaging showed high intensities compared to the surrounding liver parenchyma. (f) Diffusion-weighted imaging showed diffusion abnormalities. CT, computed tomography; MRI, magnetic resonance imaging.

Hepatocellular carcinoma; analyzed parameters by dual-layer spectral detector CT. A nodule in liver segment 4 at the arterial phase showed (a) a CT value of 136.2 HU, (b) an iodine density of 3.25 mg/mL, (c) an anatomic number of 8.88, and (d) an electron density of 106.0%EDW. CT, computed tomography.
Definition of hepatocellular carcinoma (HCC)
When surgery is performed, the diagnosis of HCC is made by pathology. Based only on imaging, HCCs were diagnosed by early staining and washout indicated typical HCCs on one or more imaging studies, in accordance with the management of HCC (1) and when surgery was not performed.
Definition of hypervascular pseudolesion (HPL)
HPL was defined as a circular pseudolesion when it did not enlarge for at least 1 year, when it shrank or disappeared over the course of CT or MR, or when the lesion appeared first after liver puncture at the arterial phase of dynamic CT or MR. Typical non-tumorous arterioportal venous shunts, such as subcapsular wedge-shaped arterial enhancement areas (10), were excluded from our study because wedge-shaped arterial enhancement areas are easily distinguished, but circular pseudolesions are often difficult to distinguish from HCC. The criterion of imaging history (reduced size or disappearance) of the hepatic lesion was used to diagnose HPL.
CT examination
Four-phase dynamic liver CT was performed at the unenhanced phase (UP), arterial phase (AP, 25 s from over 150 HU threshold of the aorta using bolus tracking), portal venous phase (PP, 50 s from the start of bolus tracking), and equilibrium phase (EP, 160 s from the start of bolus tracking). The CT parameters were as follows: tube voltage = 120 KVp; tube current auto exposure control (AEC); helical pitch = 0.891; detector collimation = 64 × 0.625 mm; and rotation time = 0.27 s The slice thickness that was used was 5 mm for image reading and 1 mm for spectral image. CT contrast agent (350 mgI/mL, iomeprol; Iomeron 350-syringe, Eisai, iodine content; 600 mgI/kg) was injected for 30 s and was intravenously injected at 1.9–5.0 mL/s via an antecubital vein.
MR examination
EOB-MRI with T2W imaging, DWI, and ADC were performed using an Ingenia 3.0 T system (Philips Healthcare, Best, the Netherlands) in 31 patients and an Ingenia 1.5 T Nova system (Philips Healthcare) in 15 patients. Gadoxetic acid (0.025 mmol/kg) was injected intravenously at a rate of 1 mL/s. The scan delays after the administration of gadoxetic acid were 20 s, 1 min, and 20 min. The parameters of the T2W imaging, DWI and 3D gradient echo (T1W) imaging are shown in Table 1. Breath-holding is practiced several times before imaging, and the sequential method for k-space data filling was used to avoid artifacts in the arterial phase.
Pulse sequence parameters for 1.5-T and 3.0-T imaging.
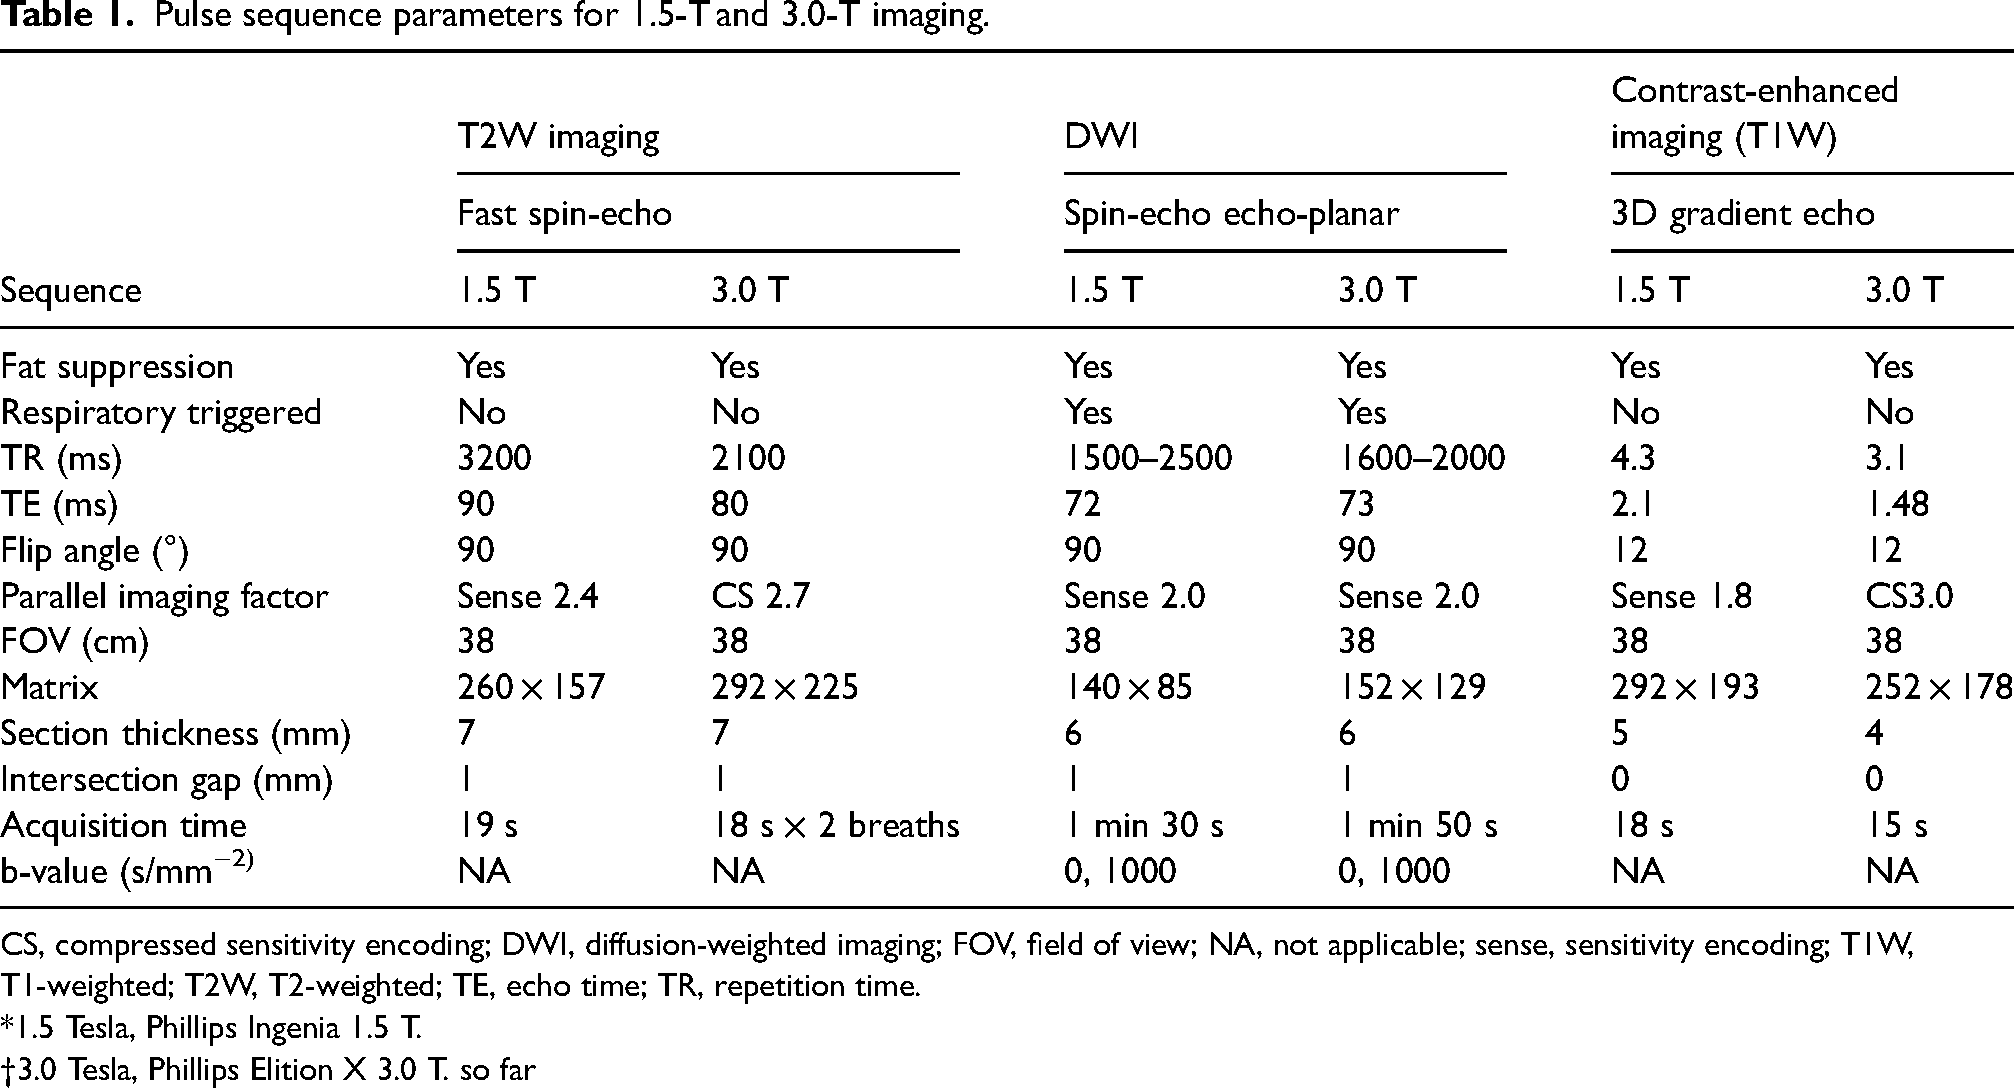
CS, compressed sensitivity encoding; DWI, diffusion-weighted imaging; FOV, field of view; NA, not applicable; sense, sensitivity encoding; T1W, T1-weighted; T2W, T2-weighted; TE, echo time; TR, repetition time.
*1.5 Tesla, Phillips Ingenia 1.5 T.
3.0 Tesla, Phillips Elition X 3.0 T. so far
Image analysis
Two radiologists (AS and KT, with 2 and 7 years of experience in radiology, respectively) reviewed the dynamic liver CT and EOB-MRI images. CT analysis was performed using a workstation (IntelliSpace Portal version 11; Philips Electronics, Best, the Netherlands). With the consensus of the two radiologists, a larger region of interest (ROI) was carefully placed inside the liver lesion to ensure that the lesion did not protrude.
One area of the liver lesion was used to measure the CT value (CTV), iodine density (ID), Eff-Z, and ED for each phase (UP, AP, PP and EP) of dynamic CT from the spectral-based image using a workstation (IntelliSpace Portal version 11; Philips Electronics).
Lesion-to-liver contrast of unenhanced electron density (ED-U), lesion-to-liver contrast of arterial electron density (ED-A), lesion-to-liver contrast of portal electron density (ED-P), lesion-to-liver contrast of equilibrium electron density (ED-E), reduction of CT value between the arterial phase and portal phase (R-CTV-AP), reduction of the CT value between the arterial phase and equilibrium phase (R-CTV-AE), reduction of the CT value between the portal phase and equilibrium phase (R-CTV-PE), reduction of the iodine density between the arterial phase and portal phase (R-ID-AP), reduction of the iodine density between the arterial phase and equilibrium phase (R-ID-AE), and reduction of the iodine density between the portal phase and equilibrium phase (R-ID-PE) were obtained to find parameters to differentiate HPL and HCC.
The reductions in CTV between the AP and PP (AP-PP/AP), between the AP and EP (AP-EP/AP), and between the PP and EP (PP-EP/PP) were calculated. In the same way, the reduction in ID between AP and PP (AP-PP/AP) between AP and EP (AP-EP/AP) and between PP and EP (PP-EP/PP) was also calculated.
MRI analysis by signal intensity of each sequence was performed by a commercially available picture archiving and communication system (SYNAPSE; Fujifilm Medical, Tokyo, Japan) by two radiologists in consensus. The lesion-to-liver signal ratio on T2W imaging and HBP was calculated as follows: SI of lesion / mean SI of liver right and left lobe. When measuring the SI of the liver parenchyma, the ROI was set to avoid large blood vessels and the gallbladder. The lesions were classified as visible (high intensity) or nonvisible (iso intensity) on DWI. The apparent diffusion coefficient (ADC) was calculated from b = 1000 and b = 0; apparent diffusion coefficient (ADC) (10−3[mm2/s]) = ln(SI(b0) / SI(b1000)) / (b1000 – b0).
For one patient, a larger ROI inside of a lesion, which showed low or high density of the liver lesion compared with surrounding liver, was measured to avoid running off the edge of the tumors.
Statistical analysis
A receiver operating characteristic (ROC) analysis was performed for each candidate variable to differentiate HPL and HCC. The area under the ROC curve (AUC) was calculated. AUCs were compared between the candidate variables using the DeLong test. SPSS version 28 (IBM Corp., Armonk, NY, USA) and R version 4.1.2 (R Foundation for Statistical Computing, Vienna, Austria) were used for the analysis.
Results
Patients
A total of 46 patients underwent both EOB-MRI and DLCT to investigate whether HCC was present before therapy (n = 24) and after therapy (atezolizumab, n = 2; lenvatinib, n = 3; transarterial chemoembolization, n = 8; radiofrequency ablation, n = 3). None of the 46 patients had image deficiency or degradation on DLCT and EOB-MRI. Patient characteristics and laboratory data are shown in Table 2.
Patient characteristics and laboratory data.
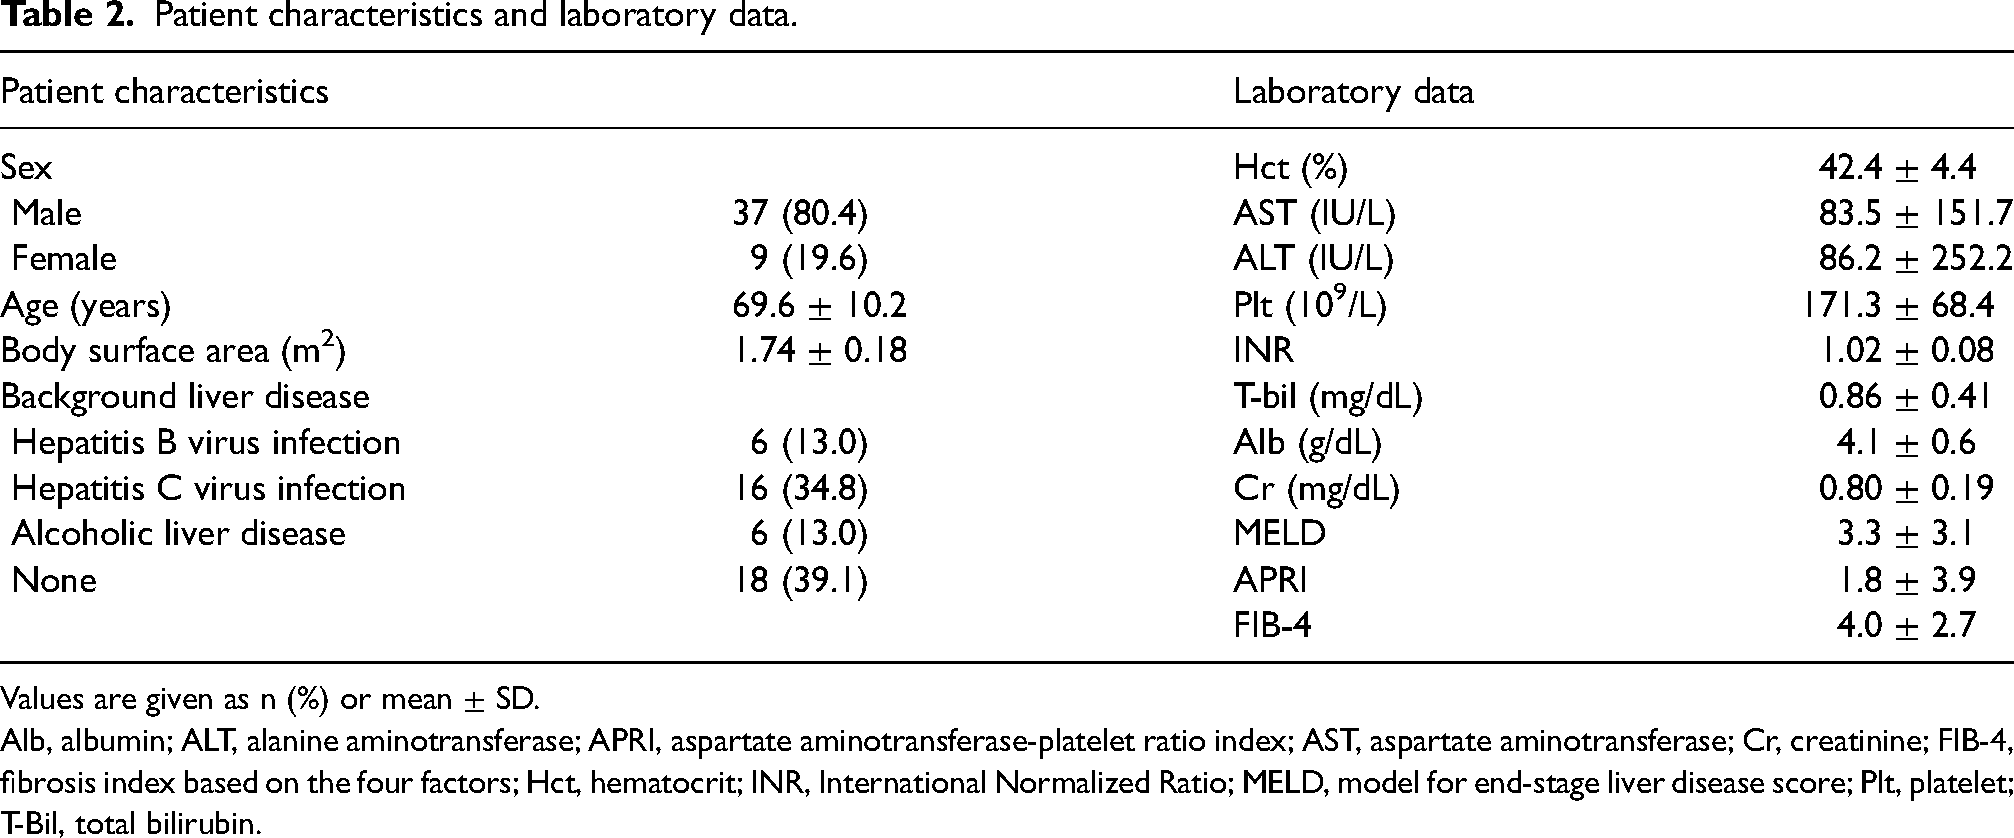
Values are given as n (%) or mean ± SD.
Alb, albumin; ALT, alanine aminotransferase; APRI, aspartate aminotransferase-platelet ratio index; AST, aspartate aminotransferase; Cr, creatinine; FIB-4, fibrosis index based on the four factors; Hct, hematocrit; INR, International Normalized Ratio; MELD, model for end-stage liver disease score; Plt, platelet; T-Bil, total bilirubin.
Liver Imaging Reporting & Data System (Li-RADS)
Our study included 10 nodules classified as LI-RADS-4 and four nodules classified as LI-RADS-3 for HPLs, while 32 nodules were classified as LI-RADS-5, 16 nodules as LI-RADS-4, and seven nodules as LI-RADS-3 for HCCs.
Hypervascular pseudolesion (HPL)
The mean size and standard deviation (SD) of HPLs as hypervascular areas of nodular shape was 18.8 ± 7.8 mm (median = 19 mm; range = 5–34 mm). With regard to the size of the HPLs, two nodules were <1 cm, seven nodules were 1–2 cm, and five nodules were >2 cm. The mean CT values at UP, AP, PP, and EP were 53.2 ± 9.0 HU, 161.8 ± 42.8 HU, 129.0 ± 22.9 HU, and 97.1 ± 14.3 HU, respectively.
Hepatocellular carcinoma (HCC)
Four HCCs in three patients were diagnosed by pathology (well differentiated, n = 1; moderately differentiated, n = 3) as postoperative cases, and the indication for liver resection was determined using Makuuchi's criteria (11). In contrast, 51 HCCs were diagnosed by early staining, and washout indicated typical HCC on two or more imaging studies. The mean size of the HCCs was 26.1 ± 18.4 mm (median = 21 mm; range = 7–103 mm). With regard to the size of the HCCs two nodules were <1 cm, 24 nodules were 1–2 cm, and 29 nodules were >2 cm.
A total of 55 HCCs showed a hypervascular nodular shape. The mean CT values at UP, AP, PP, and EP were 54.8 ± 14.7 HU, 131.6 ± 33.4 HU, 112.9 ± 22.1 HU, and 89.8 ± 17.6 HU, respectively.
Comparison between HPL and HCC
A total of 14 HPLs and 55 HCCs were detected using CT and MRI, respectively; these numbers are counted by both CT and MRI. All HPLs and 2/55 HCCs showed iso intensity, but 53 HCCs were depicted as high intensity on DWI (Table 3). A significant difference was obtained for the differentiation between HPL and HCC according to Fisher’s exact test (P < 0.001). On HBP EOB-MRI, 57% of the HPLs (n = 8/14) were hypointense compared with the surrounding liver, although all HCCs (n = 55) were hypointense.
Comparison between HPL and HCC on DWI.

Values are given as n (%). Fisher’s exact test was performed for the differentiation between HPL and HCC.
DWI, diffusion-weighted imaging; HCC, hepatocellular carcinoma; HPL, hypervascular pseudo-lesion.
A comparison between DWI and HBP/ID/ED for the differentiation of HPL and HCC is shown in Table 4. DWI showed a significantly higher AUC than the hepatobiliary phase of EOB-MRI, ID, and ED obtained with DLCT. Table 5 shows the lesion-to-liver contrast in various parameters and the reduction rate between each phase. ADC, T2W imaging, HBP, ED-A, ED-P, ED-E, R-ID-AE, and R-ID-PE showed significant differences between HPL and HCC using the Mann‒Whitney U test.
Comparison between DWI and HBP/ID/ED to differentiate HPL and HCC.

AUC, area under the curve; CI, confidence interval; DWI, diffusion-weighted imaging; ED, portal phase of electron density; HBP, hepatobiliary phase; HCC, hepatocellular carcinoma; HPL, hypervascular pseudo-lesion; ID, reduction between arterial phase and equilibrium phase (arterial phase – equilibrium phase / arterial phase) of iodine density.
Comparison between HPL and HCC.
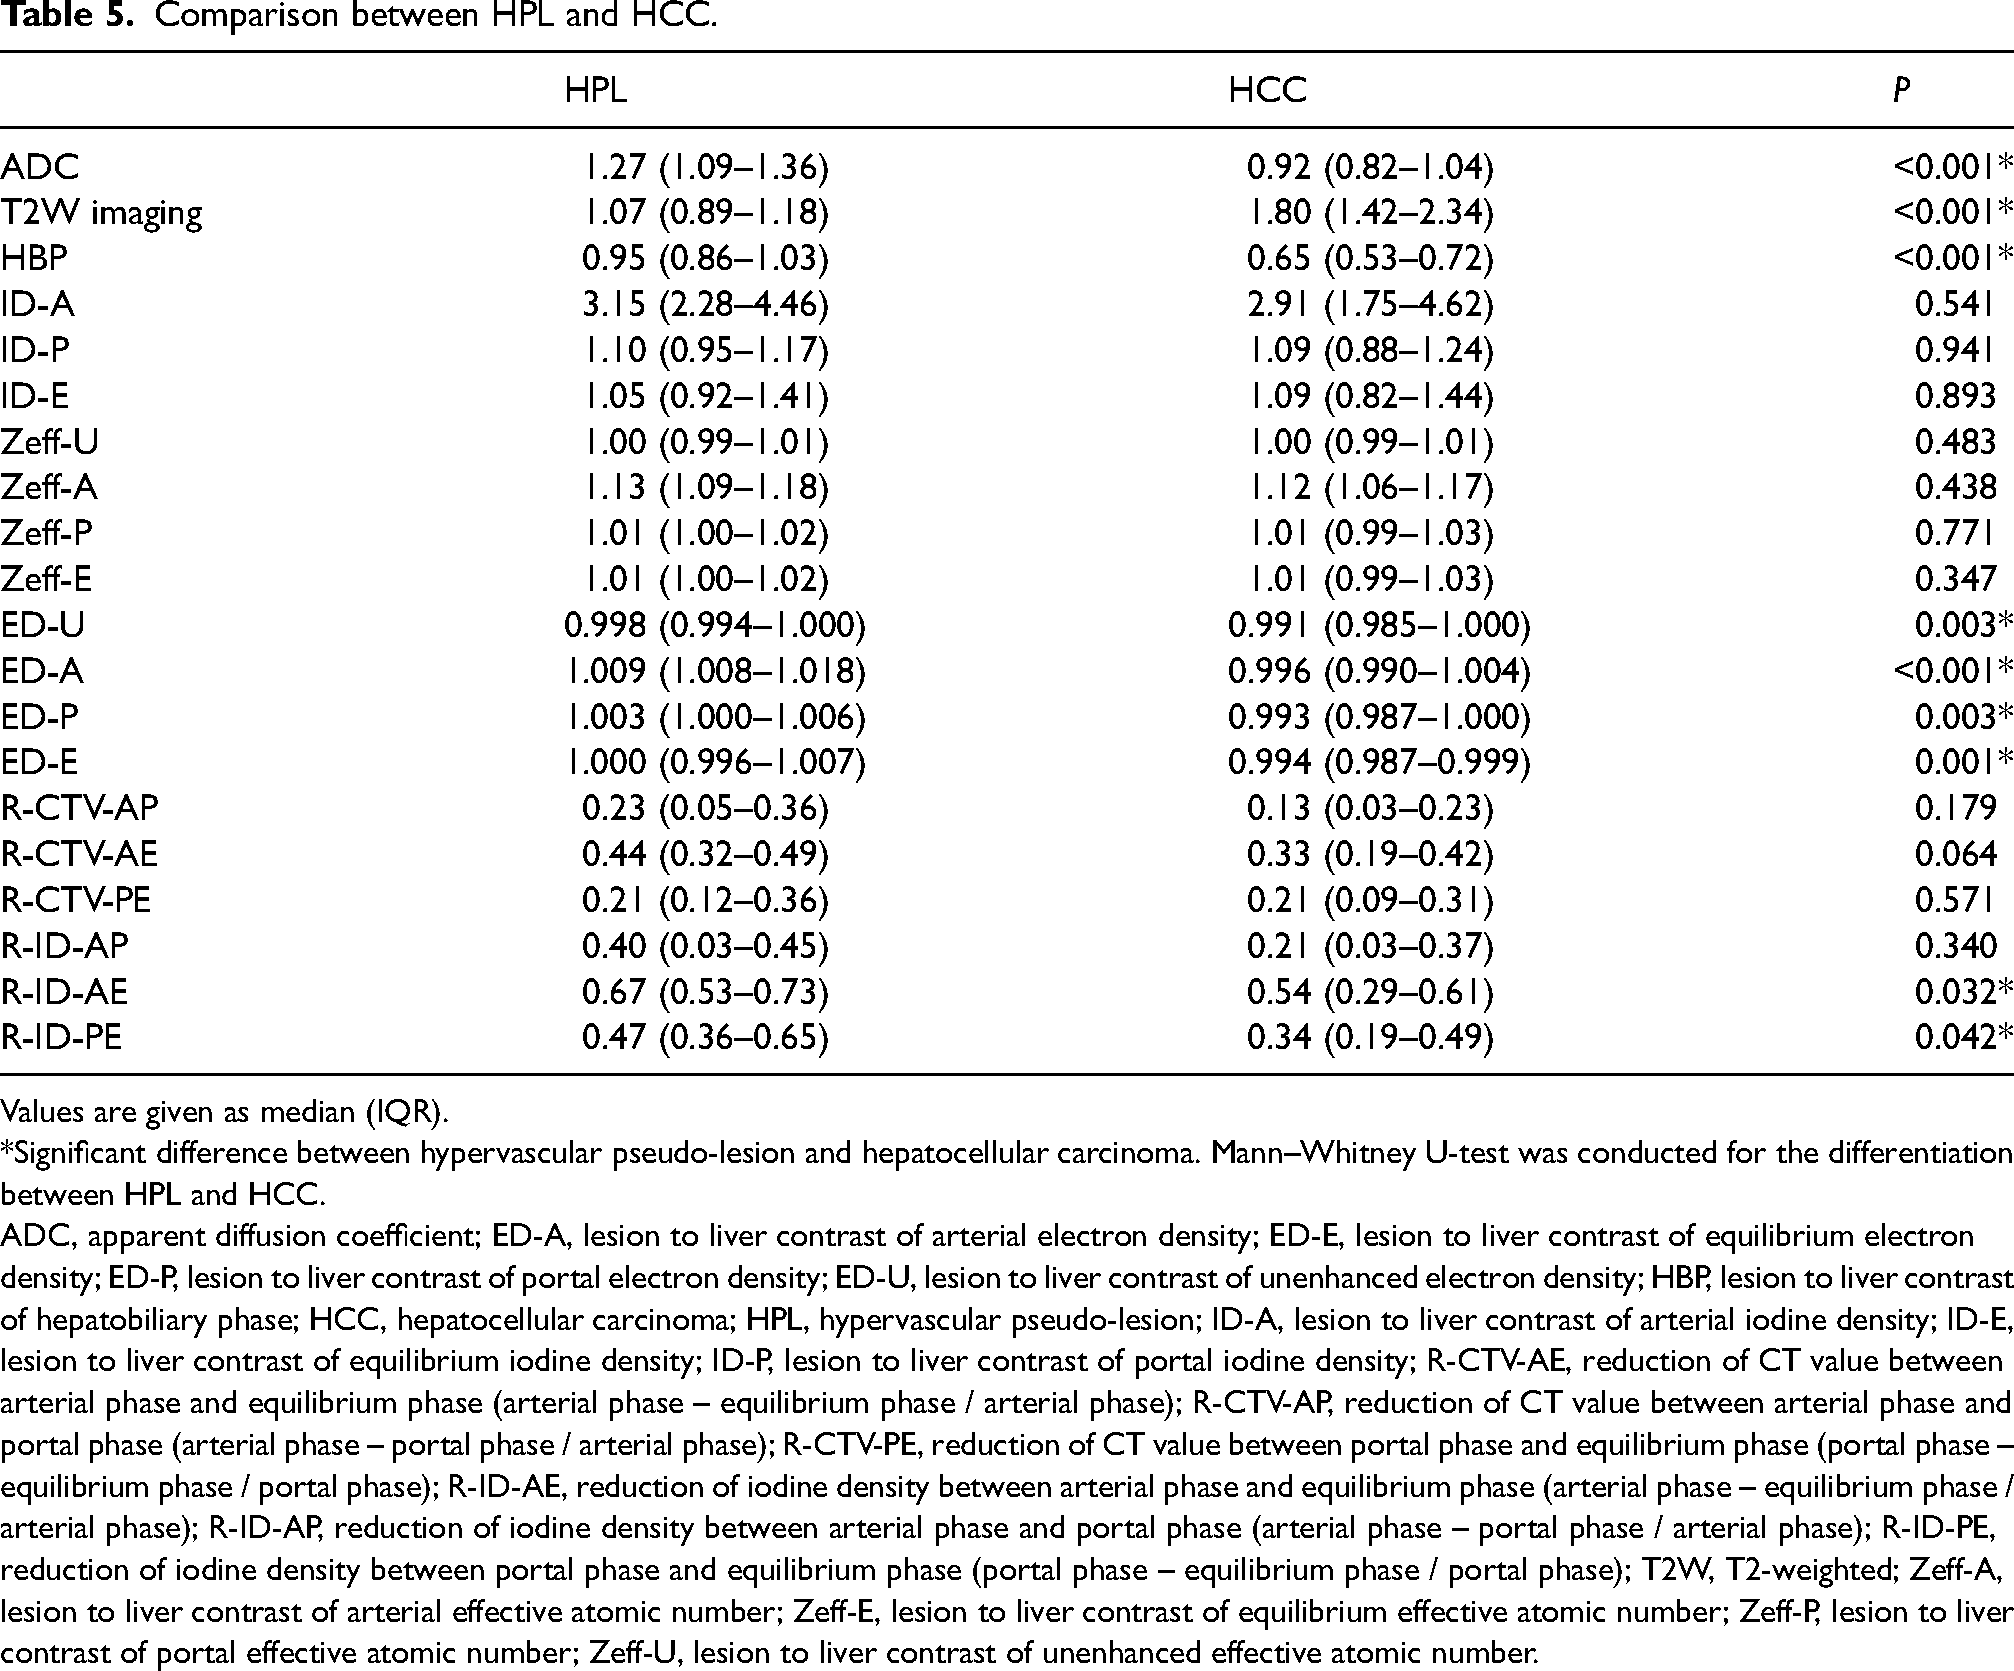
Values are given as median (IQR).
*Significant difference between hypervascular pseudo-lesion and hepatocellular carcinoma. Mann–Whitney U-test was conducted for the differentiation between HPL and HCC.
ADC, apparent diffusion coefficient; ED-A, lesion to liver contrast of arterial electron density; ED-E, lesion to liver contrast of equilibrium electron density; ED-P, lesion to liver contrast of portal electron density; ED-U, lesion to liver contrast of unenhanced electron density; HBP, lesion to liver contrast of hepatobiliary phase; HCC, hepatocellular carcinoma; HPL, hypervascular pseudo-lesion; ID-A, lesion to liver contrast of arterial iodine density; ID-E, lesion to liver contrast of equilibrium iodine density; ID-P, lesion to liver contrast of portal iodine density; R-CTV-AE, reduction of CT value between arterial phase and equilibrium phase (arterial phase – equilibrium phase / arterial phase); R-CTV-AP, reduction of CT value between arterial phase and portal phase (arterial phase – portal phase / arterial phase); R-CTV-PE, reduction of CT value between portal phase and equilibrium phase (portal phase – equilibrium phase / portal phase); R-ID-AE, reduction of iodine density between arterial phase and equilibrium phase (arterial phase – equilibrium phase / arterial phase); R-ID-AP, reduction of iodine density between arterial phase and portal phase (arterial phase – portal phase / arterial phase); R-ID-PE, reduction of iodine density between portal phase and equilibrium phase (portal phase – equilibrium phase / portal phase); T2W, T2-weighted; Zeff-A, lesion to liver contrast of arterial effective atomic number; Zeff-E, lesion to liver contrast of equilibrium effective atomic number; Zeff-P, lesion to liver contrast of portal effective atomic number; Zeff-U, lesion to liver contrast of unenhanced effective atomic number.
Discussion
The present study clearly shows that DWI is the most useful MR sequence for differentiating HPL from HCC. This result is consistent with that of Motosugi et al. (4). In their study, HPLs were identified in CTHA, whereas HPLs in our study are round-shaped during the arterial phase of dynamic CT or MR.
Round-shaped HPLs are more likely to misread as HCC than wedge-shaped HPLs. Therefore, we believe that our study has provided a useful differential method between HPL and HCC for routine practice.
The present study revealed the utility of the ED and ID (reduction of iodine density) obtained from DLCT for differentiating HPL from HCC because ED-A, ED-P, ED-E, R-ID-AE, and R-ID-PE also showed significant differences for differentiating HPL from HCC (Table 5). Interestingly, R-ID-AE and R-ID-PE showed a significant difference in differentiating HCC from HPL, while all R-CTVs did not. This may be because iodine level measurements using DLCT sensitively reflected the hemodynamics of HCC and HPL. It is also interesting to note that although there was no significant difference for R-ID-AP, there was a significant difference for R-ID-AE and R-ID-PE. HPL showed less reduction in iodine distribution between the arterial phase and equilibrium phase and between the portal phase and equilibrium phase than HCC. The hemodynamic differences between HPL and HCC may suggest a possible differentiation.
HPL showed lower values for liver lesions than HCC in the ED analysis. The differences in tissue characteristics between HPL and HCC may suggest the possibility of differentiation because ED reflects a property of tissue that is distinct from contrast enhancement (12). Further analysis of ID and ED for differentiating HPL from HCC is warranted.
The HPL that we investigated did not include wedge-shaped or irregularly outlined areas because with these shapes, HPL is not difficult to diagnose (2). Although the definition of HPL in their study differs from ours, the result is that DWI has a higher ability to distinguish HPL from HCC. However, it is already known that DWI and HBP in EOB-MRI are useful for detecting small HCCs (13–16). Particularly when small early stains are found in the arterial phase of dynamic contrast-enhanced CT or EOB-MRI, it is sometimes difficult to determine whether it is HPL or HCC because small HCCs often have an unclear washout in the portal and equilibrium phases (17). EOB-MRI is more effective than dynamic CT in the diagnosis of HCC (16) because of its better detection of small HCC in the HBP.
HCC had a significantly higher tumor-liver contrast of HBP than that of HPL, although 15% of HPLs were hypointense compared to the liver (4). Our results in the present study also showed a low specificity of 0.429 for the differentiation between HPL and HCC in HBP, with an AUC of only 0.714 (Table 4), although the specificity and AUC of DWI were 1 and 0.982, respectively. It is useful that DWI has a high specificity for differentiating between HCC and HPL because the differentiation of these small HCCs from round HPLs allows for early intervention in HCC therapy.
MRI is often performed when the diagnosis of HCC is difficult on CT alone, in which case HPL should be considered if the lesion is not visible on DWI. In such cases, HPL should be considered if the lesion is not visible on DWI.
The present study has some limitations. First, it is a retrospective study. However, as shown in Table 1, two MRI systems are used for MRI, but only one DLCT system is used for CT. Further research should be carried out on other DECTs. In addition, there is also a need to standardize quantitative evaluation because of differences in CT/MR equipment and workstations offered by vendors. Second, the number of patients is small, and a study including a larger number of cases is desirable. Third, there are several cases of HCCs and all HPLs that have not been histopathologically diagnosed, although HCC is diagnosed and treated according to the guidelines (1). Fourth, the treatment of HCC, such as transarterial chemoembolization and radiofrequency ablation, may affect quantitative imaging. However, we believe that comparisons can be made because both DLCT and EOB-MRI are performed as part of the same post-treatment evaluation.
In conclusion, DWI is significantly more useful in differentiating HPL from HCC than HBP of EOB-MRI, ID or ED using DLCT. If the liver lesion is not visible on DWI, the diagnosis of HPL may be more accurate than that of HCC when HCC cannot be ruled out in the arterial phase. The evaluation of liver lesions using ID and ED may be promising to show the differences between HCC and HPL in terms of liver hemodynamics.
Footnotes
Acknowledgments
The authors would like to thank Hirotsugu Yasuda (Data Research Section, Kondo P.P.) for the statistical analysis.
Declaration of conflicting interests
The authors declared no potential conflicts of interest with respect to the research, authorship, and/or publication of this article.
Funding
The authors received no financial support for the research, authorship, and/or publication of this article.