



Abstract
Background
Quantitative parameters derived from synthetic magnetic resonance imaging (SyMRI) have shown potential in diagnosing clinically significant prostate cancer (csPCa). Histogram analysis enhances diagnostic accuracy by evaluating spatial heterogeneity.
Purpose
To assess the performance of histogram analysis models utilizing relaxation maps from SyMRI in diagnosing csPCa.
Material and Methods
A total of 124 men with a clinical suspicion of csPCa were enrolled prospectively between April 2018 and December 2019. From 124 patients, 224 ROIs were analyzed, including 97 csPCa lesions, 11 insignificant PCa, 59 non-cancerous peripheral zone (PZ) lesions, and 57 benign prostatic hyperplasia. The lesions were randomly divided into a training group and a validation group, in a ratio of 7:3. Histogram analysis models were constructed using SyMRI relaxation maps, diffusion-weighted imaging (DWI), apparent diffusion coefficient (ADC), and their combination. We compared these with mean-value-based models using the same modalities. The diagnostic accuracy of these models in distinguishing csPCa from clinically insignificant disease (CIS) was evaluated.
Results
Histogram analysis models outperformed mean-value-based models in both training and validation groups. SyMRI-based histogram analysis models demonstrated diagnostic effectiveness comparable to DWI and ADC models. The combined model achieved the highest area under the curve values in the PZ (0.898; 95% confidence interval [CI]=0.763–0.999) and transition zone (TZ) (0.944; 95% CI=0.874–0.999). In the TZ, the combined model significantly outperformed the Prostate Imaging Reporting and Data System (P = 0.019).
Conclusion
Histogram analysis of SyMRI relaxation maps is a valuable tool for differentiating csPCa from CIS. Combining SyMRI with DWI and ADC further improved diagnostic accuracy.
Introduction
Prostate cancer (PCa) is among the most common malignancies in men, accounting for 29% of newly diagnosed cancers in 2023 (1). Early diagnosis of clinically significant prostate cancer (csPCa) is essential as it significantly reduces mortality (2). Traditionally, csPCa detection has relied on invasive biopsies that pose risks, such as bleeding, infection, and, in severe cases, life-threatening sepsis (3). To address these challenges, multiparametric magnetic resonance imaging (mpMRI) has emerged as a critical non-invasive tool for detecting and localizing csPCa (4), potentially reducing the need for biopsies (5). The Prostate Imaging Reporting and Data System (PI-RADS) was developed to standardize the acquisition and interpretation of prostate MRI (6). However, PI-RADS has limitations, including low positive predictive value, high false-positive rates, and variable reproducibility (7–9). These challenges highlight the need for quantitative MRI approaches in prostate imaging. Quantitative techniques such as diffusion-weighted imaging (DWI) and apparent diffusion coefficient (ADC) mapping are integral to PI-RADS but show variable diagnostic performance across studies (10–12). Advanced diffusion MRI methods, including intravoxel incoherent motion (IVIM), diffusion tensor imaging (DTI), and diffusion kurtosis imaging (DKI), offer improved tumor assessment (13–15). But these technologies are constrained by long scanning times and spatial registration challenges, making it difficult to apply them to clinical practice. Therefore, there is an urgent need for technology that has a relatively short scanning time and can solve the problem of spatial registration between different images.
Synthetic MRI (SyMRI), a novel approach based on quantifying relaxation times and proton density via a multidynamic multiecho (MDME) sequence, addresses some of these limitations. SyMRI provides absolute T1, T2, and proton density (PD) quantification in a single scan and generates contrast-weighted images based on tissue properties (16). Studies have demonstrated that SyMRI correlates well with conventional quantitative mapping techniques and yields comparable image quality (17,18). SyMRI scan only takes about 5 min, making it possible for SyMRI to replace traditional quantitative imaging (18). In addition, compared to scanning multiple sequences, SyMRI does not have spatial registration issues, providing assistance for more accurate quantitative analysis of diseases. While SyMRI-derived parameters have shown promise in csPCa diagnosis (11,19), a previous study showed that the area under the curve (AUC) of ADC was significantly higher than T1, T2, and PD quantitative mapping from SyMRI (P ≤0.025) (19). Histogram analysis, which quantifies image heterogeneity by analyzing spatial patterns of pixel intensities, offers additional diagnostic insights not discernible by the human eye (20). Recent research has demonstrated its utility in evaluating csPCa aggressiveness using mpMRI (21–23). However, the application of histogram analysis to SyMRI relaxation maps remains underexplored.
The aim of the present study was to evaluate the diagnostic performance of histogram analysis models based on SyMRI relaxation maps for csPCa. These models were compared with conventional mean-value approaches and integrated with DWI and ADC data to assess their combined diagnostic potential.
Material and Methods
Patients
This study was performed with the approval of the Ethics Committee of Beijing Hospital. Informed consent was obtained from each participant (2019BJYYEC-116-02).
Between April 2018 and December 2019, 150 consecutive patients suspected of csPCa underwent MRI examinations at our institution, including SyMRI and DWI. The exclusion criteria included the absence of pathological results (n = 13), an interval >3 months between MRI and pathology (n = 6), biopsy within 6 weeks before MRI (n = 2), and inadequate image quality (n = 5). Ultimately, 124 patients were included for analysis (Fig. 1).
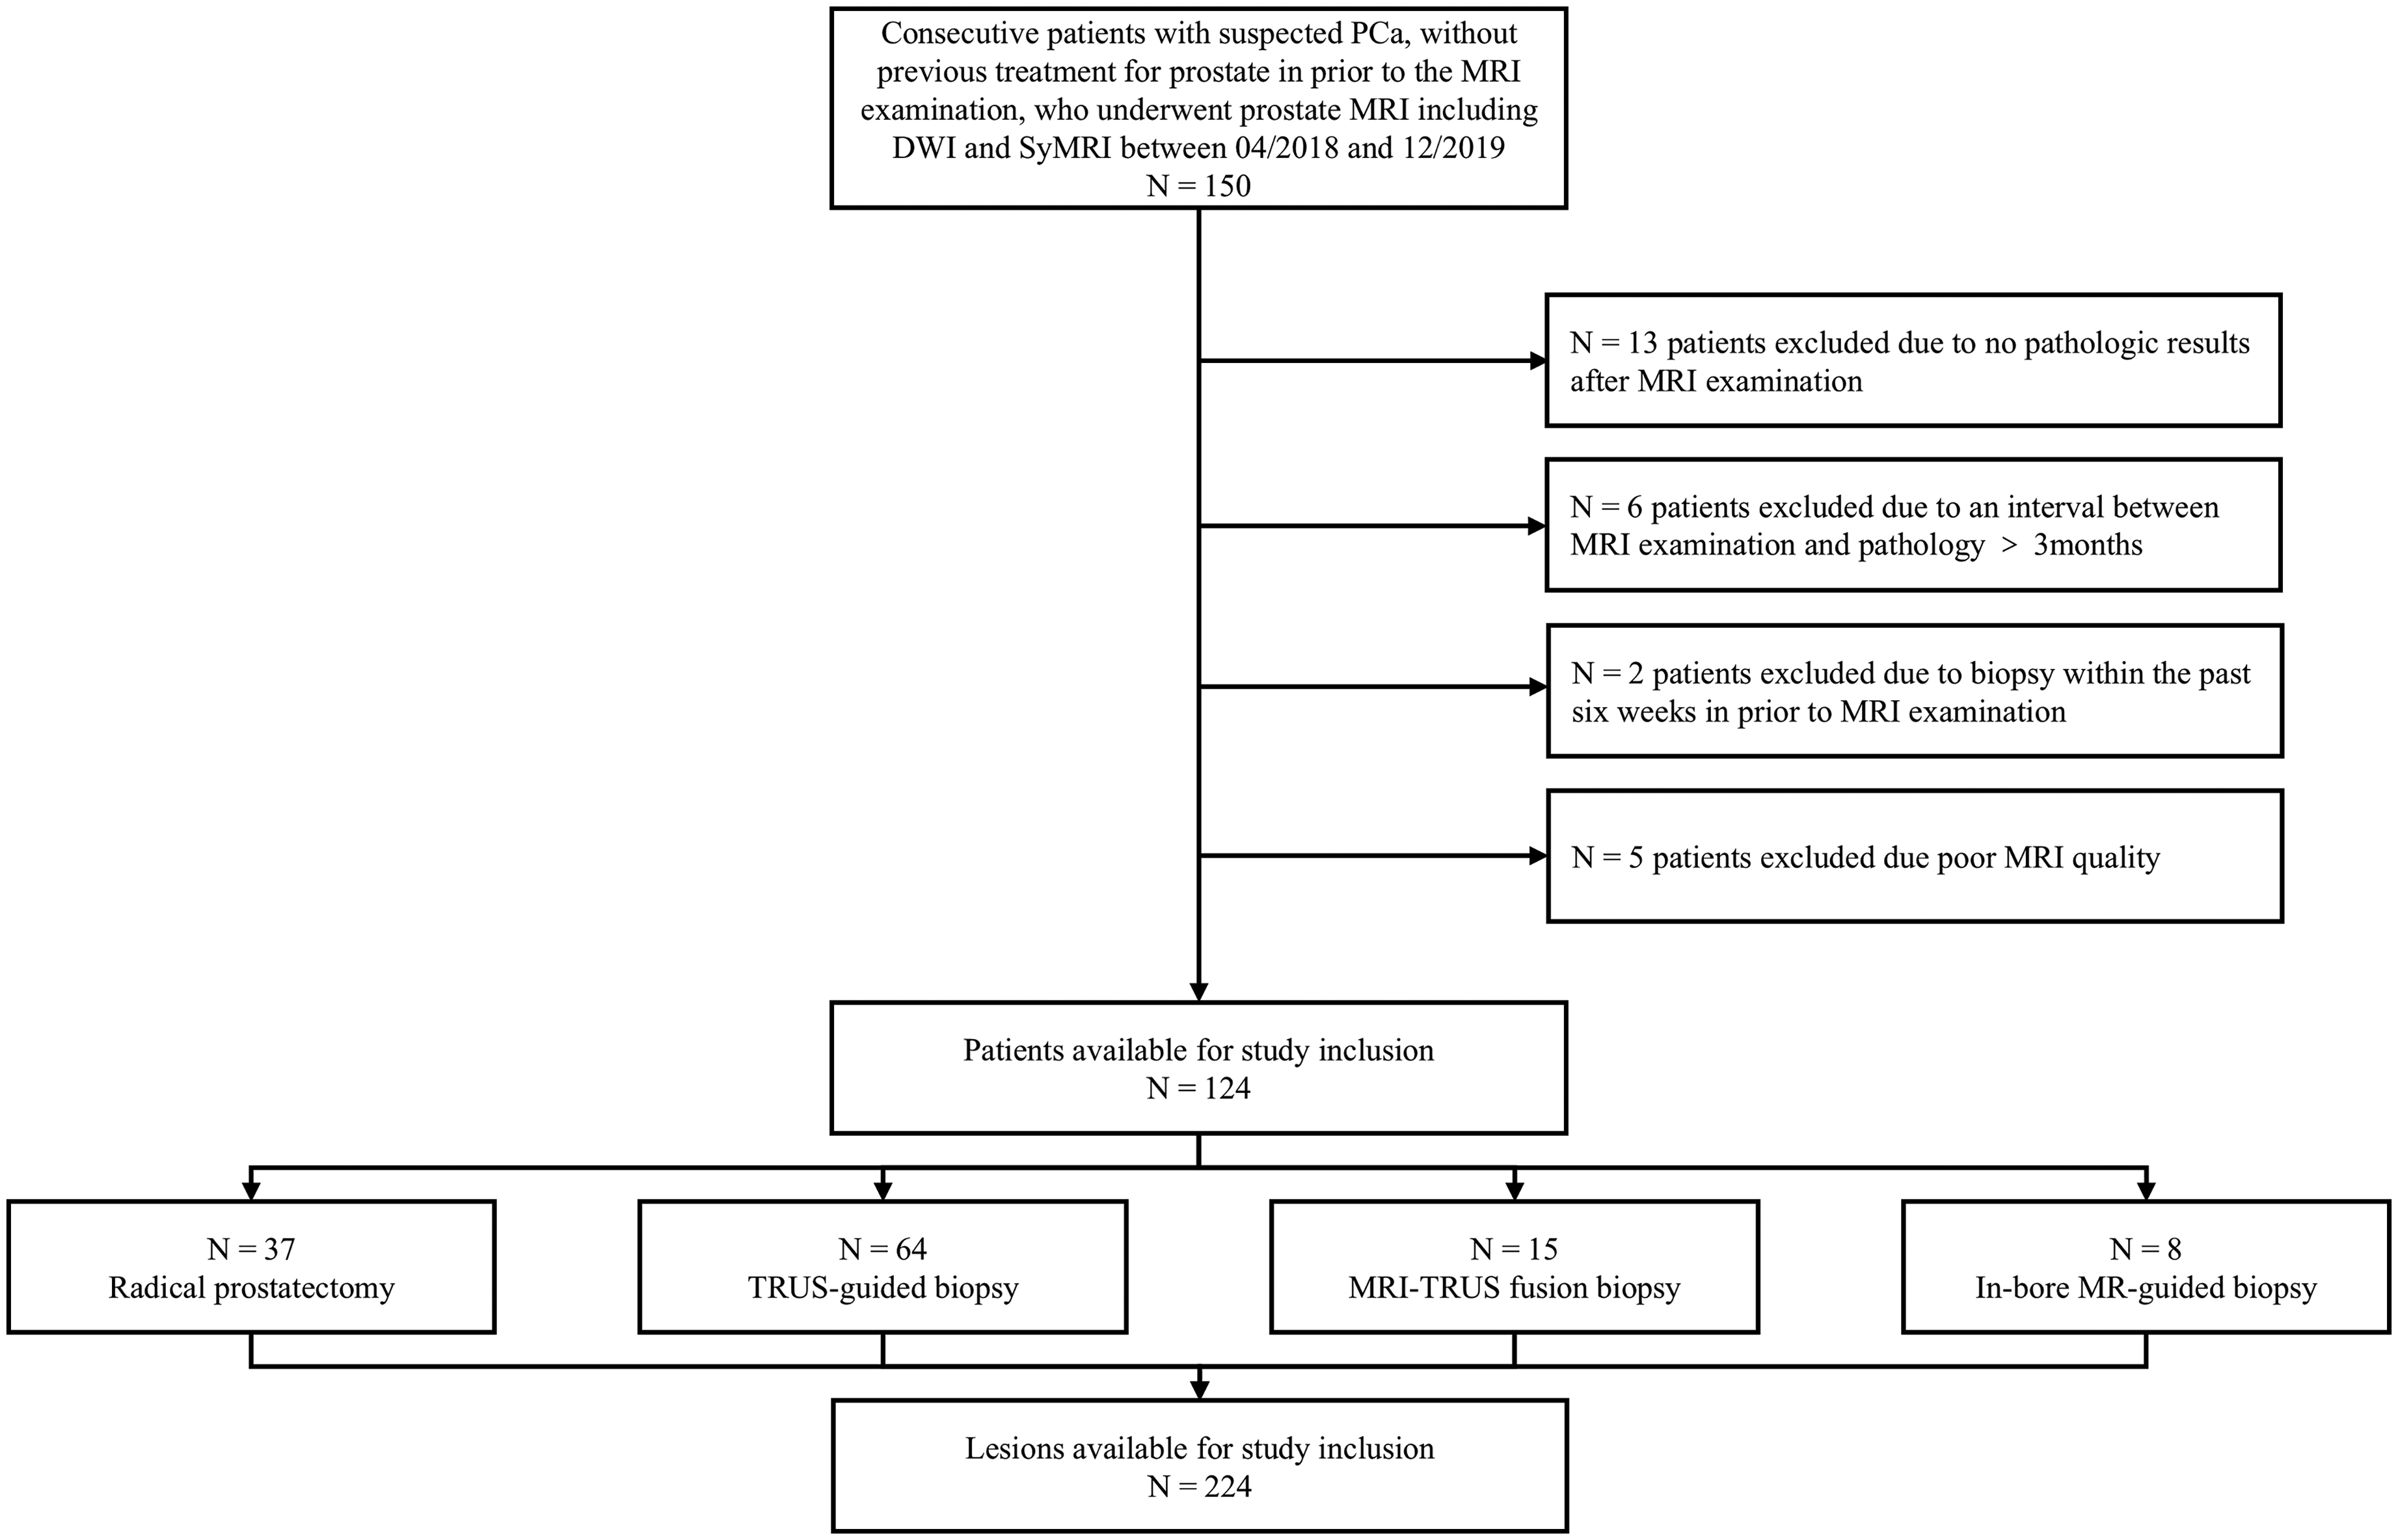
Flow chart shows patient selection process. PCa, prostate cancer; TRUS, transrectal ultrasound.
MRI acquisition and postprocessing
All MRI scans were conducted using a 3.0-T MRI scanner (SIGNA Pioneer; GE Healthcare, Milwaukee, WI. USA) with a 32-channel phased-array coil. The imaging protocol included conventional T2-weighted (T2W) imaging, T1-weighted (T1W) imaging, DWI (b-values: 50 and 1400 s/mm²), and SyMRI acquisition using a MDME sequence. SyMRI parameters included two echo times (14/92 ms) and four saturation delay times (170/670/1840/3840 ms). Apparent diffusion coefficient (ADC) maps were generated automatically on the scanner console. Quantitative parametric maps (T1, T2, and PD) were derived using SyMRI 8.0 software (SyntheticMR, Linköping, Sweden). Detailed parameters of the imaging sequences are presented in Table A.1.
Histological–radiological correlation
All biopsy specimens and histopathologic slides were evaluated by an expert pathologist (WZ, with >10 years of experience). csPCa was defined as lesions with a Gleason score (GS) >6. Benign lesions or those with GS 3 + 3 were grouped as clinically insignificant disease (CIS). Determination of GS primarily relied on surgical pathology results from radical prostatectomy when available; otherwise, needle biopsy results were used. Regions of interest (ROIs) for lesions ≥5 mm were manually delineated on SyMRI images according to pathological findings by two radiologists (YC and CL, with 8 and 12 years of prostate MRI experience, respectively) using ITK-SNAP software. Rigid registration between SyMRI and DWI images was performed using the SPM12 toolbox in MATLAB (MathWorks, Natick, MA, USA). In SPM12 for registering SyMRI and DWI, we used “7-B-spline interpolation” for high-precision realignment. The registration quality was set to 0.9 and the sampling interval was 2 mm. A “Rigid Body” transformation was applied as prostate deformation is minor. ROIs were then transferred to the co-registered DWI scans and ADC maps. One radiologist (CL) repeated the measurements after 1 month, and intra- and inter-observer agreement analyses were conducted.
For the 124 patients included, 37 underwent radical prostatectomy, 64 systematic transrectal ultrasound (TRUS)-guided biopsy, 15 MRI-TRUS fusion biopsy, and eight in-bore MRI-guided biopsy. For patients who had radical prostatectomy, MRI findings were correlated with surgical specimens by two radiologists and one pathologist in consensus, using anatomic landmarks such as benign prostatic hyperplasia (BPH), the urethra, and ejaculatory ducts (24). For systematic TRUS-guided biopsy, biopsy sites were documented using a fixed scheme, and corresponding MRI findings were analyzed. For MRI-TRUS fusion and in-bore MRI-guided biopsies, cancer-suspicious lesions with PI-RADS version 2 scores ≥3 were targeted. Biparametric MRI was used for detection and localization of csPCa, with comparable performance to multiparametric MRI (25). In total, 224 ROIs were analyzed, including 108 csPCa lesions, 59 non-cancerous peripheral zone (PZ) lesions, and 57 BPH lesions. The lesions were randomly divided into a training group and a validation group, in a ratio of 7:3.
Fig. 2 depicts example segmentations of a csPCa lesion with GS 3 + 4 located in the PZ.
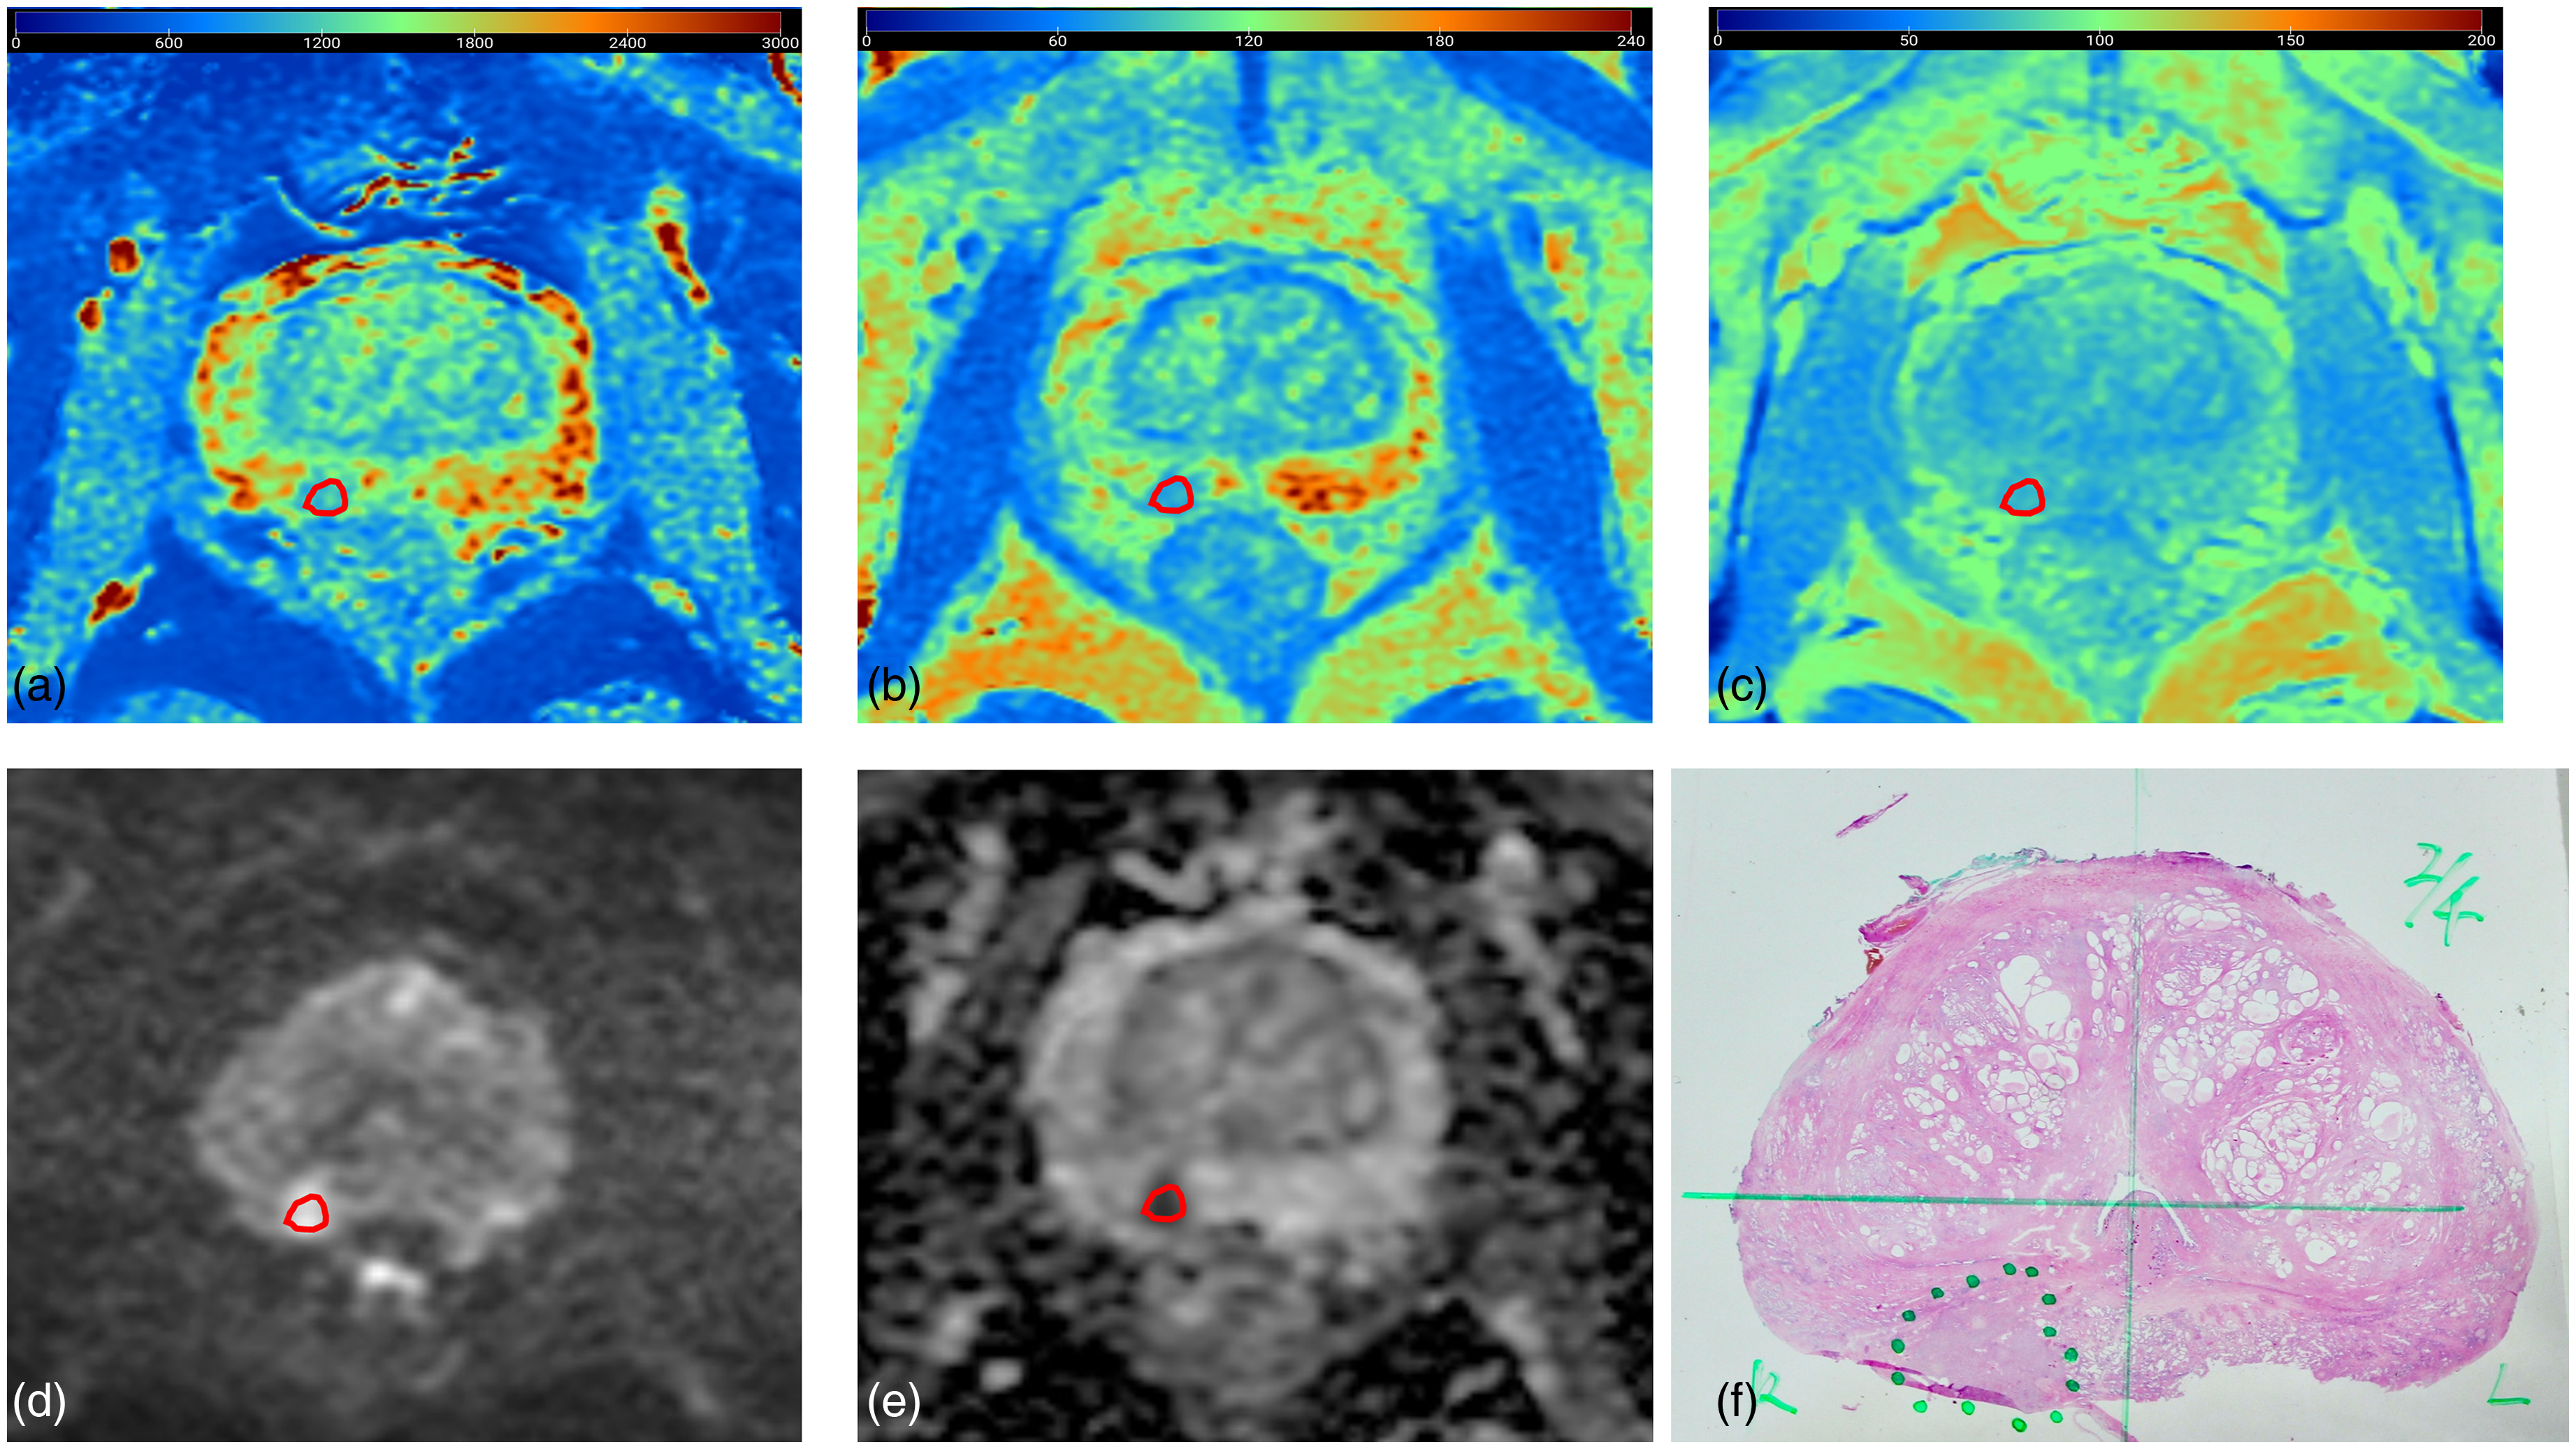
Example segmentations in a 64-year-old man with initial prostate-specific antigen level of 3.617 ng/ml. This patient underwent RP and the RP whole-mount section shows that the csPCa lesion is located in the PZ. (a) Axial T1 map shows the csPCa lesion located in the right PZ with focal hypointense signal. (b) Axial T2 map also shows the lesion with focal hypointense signal. (c) PD map shows the lesion with focal slightly hypointense signal. (d) Diffusion-weighted imaging with a b-value of 1400 s/mm2 shows the lesion with high signal intensity. (e) ADC map shows that the lesion has reduced ADC. (f) RP whole-mount section shows the csPCa lesion is located in the right PZ with a Gleason score of 3 + 4. Segmentation of the lesion is overlaid on corresponding images. ADC, apparent diffusion coefficient; csPCa, clinically significant prostate cancer; PD, proton density; PZ, peripheral zone; RP, radical prostatectomy.
Histogram analysis
Histogram features were extracted from SyMRI parametric maps (T1, T2, PD), normalized DWI, and ADC maps using PyRadiomics (26) software implemented in Python (27). Features included first-order metrics such as energy, entropy, interquartile range, kurtosis, mean absolute deviation, and variance, resulting in 90 features. DWI scans were normalized before feature extraction. Intra- and inter-observer reproducibility of features was evaluated using intraclass correlation coefficients (ICC), retaining features with ICC >0.80 for analysis. Differences in features between csPCa and CIS were assessed separately for PZ and TZ lesions.
Significant features were selected for predictive model construction. Six models were developed: models A, B, and C utilized significant histogram features from SyMRI, DWI, and ADC, and their combination, respectively, while models D, E, and F were based on mean values of the same modalities.
Statistical analysis
All statistical analyses were conducted using SPSS 22.0 (IBM Corp., Armonk, NY, USA) and MedCalc Statistical Software 19.0.4 (MedCalc Software, Ostend, Belgium). Features were expressed as mean ± standard deviation or median (first quartile, third quartile), depending on whether the data followed a normal distribution. In the training group, first, differences of each feature between csPCa and CIS were assessed using the Mann–Whitney U-test or Welch's t-test or independent sample t-test based on the data distribution and homoscedasticity. Second, features with significant differences were tested by Spearman’s correlation analysis. Third, if the correlation coefficient is >0.8, we selected one of these features for univariate logistic regression. Features with P <0.2 in univariate logistic regression analysis were then analyzed with stepwise regression analysis for model construction. Models based on mean value were also established by stepwise regression analysis. During the stepwise regression, we employed the forward stepwise regression method, using a P value <0.05 as the threshold for adding a feature to the model.
In both the training and validation groups, receiver operating characteristic (ROC) curve analysis was performed to assess the diagnostic effectiveness of each model in differentiating csPCa from CIS in PZ and TZ; the area under the ROC curve (AUC), sensitivity, specificity, positive predictive value, and negative predictive value were also recorded. The AUCs between different models were compared using DeLong's test. The confidence level was set at P <0.05.
Results
Patient and lesion characteristics
Among the 124 patients included, a total of 224 ROIs were analyzed, comprising 97 csPCa lesions, 11 PCa lesions with GS 3 + 3, 59 non-cancerous PZ lesions, and 57 BPH lesions (Table 1). In the training group, 72 csPCa lesions (43 in PZ, 29 in TZ) and 85 CIS lesions (39 in PZ, 46 in TZ) were analyzed. The validation group included 25 csPCa lesions (11 in PZ, 14 in TZ) and 42 CIS lesions (24 in PZ, 18 in TZ). Patient demographics and lesion characteristics were comparable between the training and validation groups.
Summary of demographic data.

Values are given as n, mean ± SD, or median (range).
BPH, benign prostatic hyperplasia; PCa, prostate cancer; PI-RADS, Prostate Imaging Reporting and Data System; PSA, prostate-specific antigen; PZ, peripheral zone; TRUS, transrectal ultrasound; TZ, transition zone.
Histogram features
In the training group, the number of features with ICC >0.80 was 69 in PZ and 85 in TZ. Table 2 described whether there were significant differences in the features between csPCa and CIS. Detailed features of csPCa and CIS were presented in Tables A.2 and A.3. After the correlation analysis, three and seven features were selected for univariate logistic regression in the construction of model A for discriminating csPCa from CIS in the PZ and TZ, respectively. Similarly, eight and five features were selected in model B, and 11 and 12 features were selected in model C. Features with P values <0.2 were then analyzed by stepwise regression analysis to establish models A, B, and C. Finally, model A included two and three features for discriminating csPCa from CIS in the PZ and TZ, respectively. Model B included three and two features, and model C included three and five features, respectively. Model D included mean T1 and T2 values, and models E and F included mean ADC values for discriminating csPCa from CIS in both PZ and TZ. The details are shown in Table 3.
Differences of features between csPCa and CIS.

*Features with ICC ≤0.8.
ADC, apparent diffusion coefficient; CIS, clinically insignificant disease; CsPCa, clinically significant prostate cancer; ICC, intraclass correlation coefficient; IQR, interquartile range; MAD, mean absolute deviation; PZ, peripheral zone; rMAD, robust mean absolute deviation; RMS, root mean squared; TZ, transition zone.
A summary of features in six models.

Models A, B, and C were histogram analysis models based on SyMRI, DWI, and ADC. Models D, E, and F were mean-value models based on SyMRI and ADC.
ADC, apparent diffusion coefficient; IQR, interquartile range; PZ, peripheral zone; TZ, transition zone.
Diagnostic performance in the training group
In the training group, histogram analysis models consistently outperformed mean-value-based models in distinguishing csPCa from CIS (Table 4). Model A showed significantly higher AUCs than model D (P = 0.013 and P = 0.017 in the PZ and TZ, respectively). Model B had higher AUCs than model E, while there was only a significant difference in the PZ (P = 0.009). Model C exhibited significantly higher AUCs than model F (P = 0.007 and P = 0.044 in the PZ and TZ, respectively).
Discriminatory ability of csPCa in training group.

Values in parentheses are 95% CI. Models A, B, and C were histogram analysis models based on SyMRI, DWI, and ADC. Models D, E, and F were mean-value models based on SyMRI and ADC.
*Delong’s test for differences in AUC between model C and the other models.
Delong’s test for differences in AUC between model A (B) and model D (E).
ADC, apparent diffusion coefficient; AUC, area under the curve; CIS, clinically insignificant disease; CsPCa, clinically significant prostate cancer; ICC, intraclass correlation coefficient; IQR, interquartile range; MAD, mean absolute deviation; PI-RADS, Prostate Imaging Reporting and Data System; PZ, peripheral zone; rMAD, robust mean absolute deviation; RMS, root mean squared; TZ, transition zone.
For PZ lesions, model C (SyMRI + DWI + ADC) achieved the highest AUC of 0.884 (95% confidence interval [CI] = 0.816–0.953), with a sensitivity of 65.1% (95% CI = 49.1–79.0) and specificity of 97.4% (95% CI = 86.5–99.9). Models A (SyMRI) and B (DWI + ADC) also showed strong performance, with AUCs of 0.825 and 0.879, respectively (Table 4 and Fig. 3a). For TZ lesions, model C also demonstrated superior diagnostic performance, achieving an AUC of 0.867 (95% CI = 0.787–0.946), sensitivity of 65.5% (95% CI = 45.7–82.1), and specificity of 91.3% (95% CI = 79.2–97.6) (Table 4 and Fig. 3b). Models A and B displayed comparable AUCs of 0.794 and 0.810, respectively.
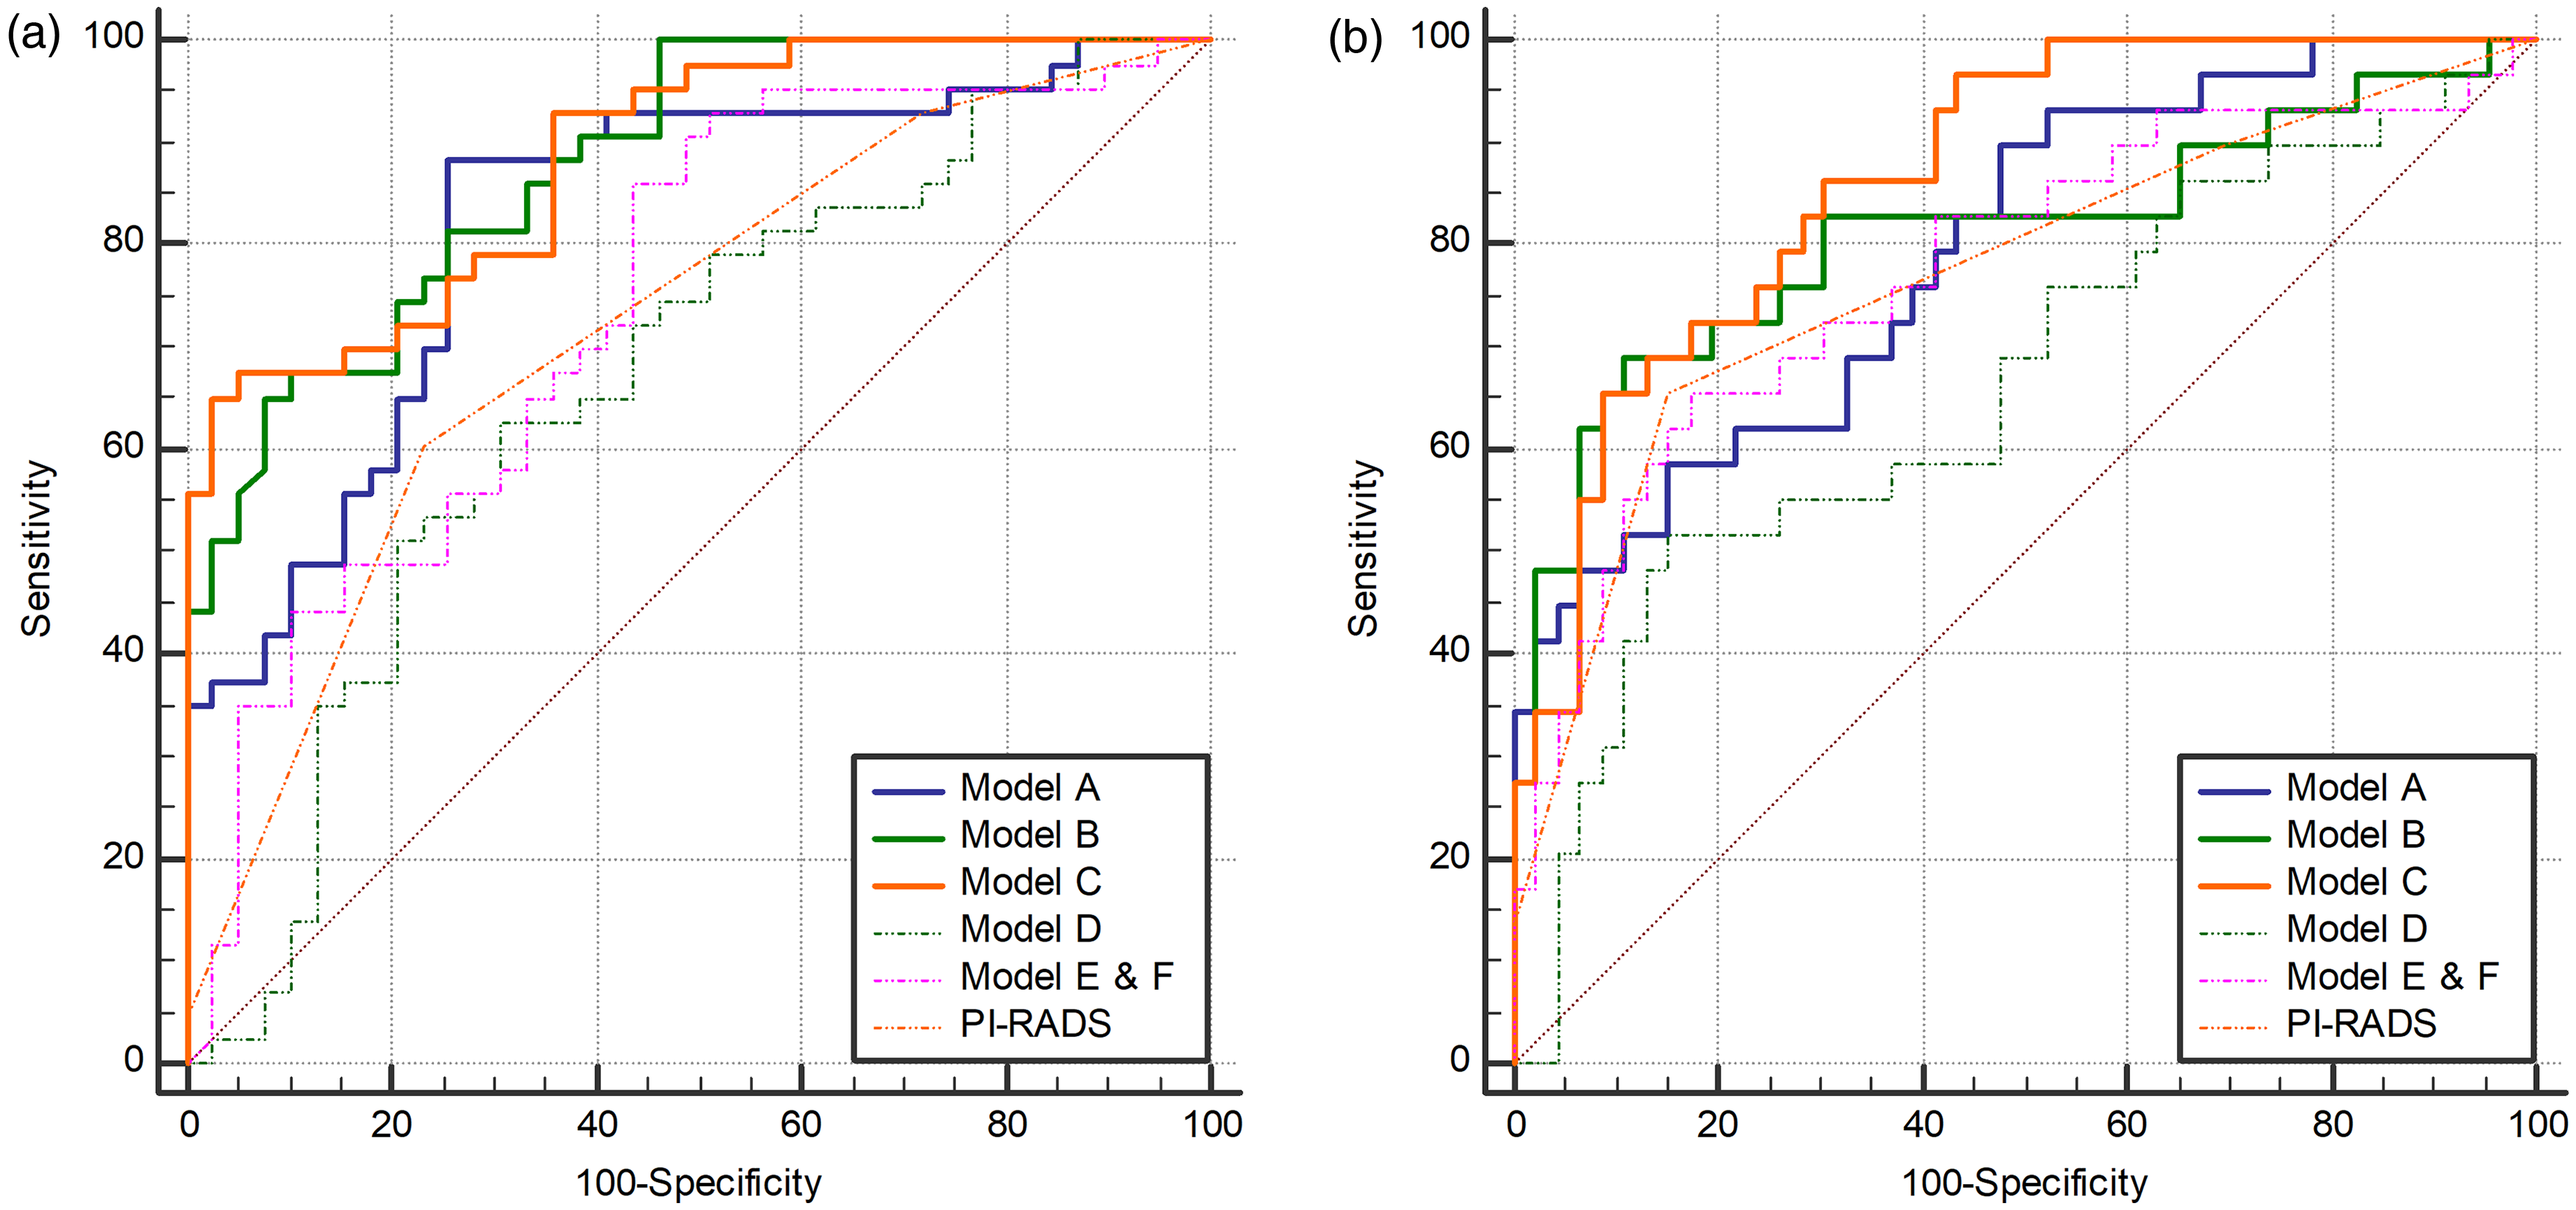
In the training group, ROC curves demonstrate the diagnostic effectiveness of discriminating csPCa from CIS in (a) the PZ and (b) TZ. Models A, B, and C were histogram analysis models based on SyMRI, DWI, and ADC. Models D, E, and F were mean-value models based on SyMRI and ADC. ADC, apparent diffusion coefficient; CIS, clinically insignificant disease; csPCa, clinically significant prostate cancer; DWI, diffusion-weighted imaging; ROC, receiver operating characteristic; SyMRI, synthetic magnetic resonance imaging; TZ, transition zone.
Diagnostic performance in the validation group
In the validation group, model C retained its superior diagnostic capability (Table 5). Model A showed higher AUCs than model D, but there were no significant differences (P = 0.063 and P = 0.228 in the PZ and TZ, respectively). Model B had significantly higher AUCs than model E (P = 0.015 and P = 0.039 in the PZ and TZ, respectively). Model C exhibited significantly higher AUCs than model F (P = 0.014 and P = 0.001 in the PZ and TZ, respectively).
Discriminatory ability of csPCa in validation group.

Values in parentheses are 95% CI. Models A, B, and C were histogram analysis models based on SyMRI, DWI, and ADC. Models D, E, and F were mean-value models based on SyMRI and ADC.
*Delong’s test for differences in AUC between model C and the other models.
Delong’s test for differences in AUC between model A (B) and model D (E).
AUC, area under the curve; CsPCa, clinically significant prostate cancer; PI-RADS, Prostate Imaging Reporting and Data System; PZ, peripheral zone; TZ, transition zone.
For PZ lesions, model C achieved an AUC of 0.898 (95% CI = 0.763–0.999), with excellent sensitivity (72.7%, 95% CI = 39.0–94.0) and specificity (99.9%, 95% CI = 85.8–99.9). Model A (AUC = 0.837) and model B (AUC = 0.898) performed slightly less effectively (Table 5 and Fig. 4a). For TZ lesions, Model C demonstrated outstanding performance with an AUC of 0.944 (95% CI = 0.874–0.999), sensitivity of 92.9% (95% CI = 66.1–99.8), and specificity of 83.3% (95% CI = 58.6–96.4), outperforming the PI-RADS system (AUC = 0.748, P = 0.019) (Table 5 and Fig. 4b). This highlights the enhanced diagnostic accuracy provided by combining features from SyMRI with DWI and ADC.
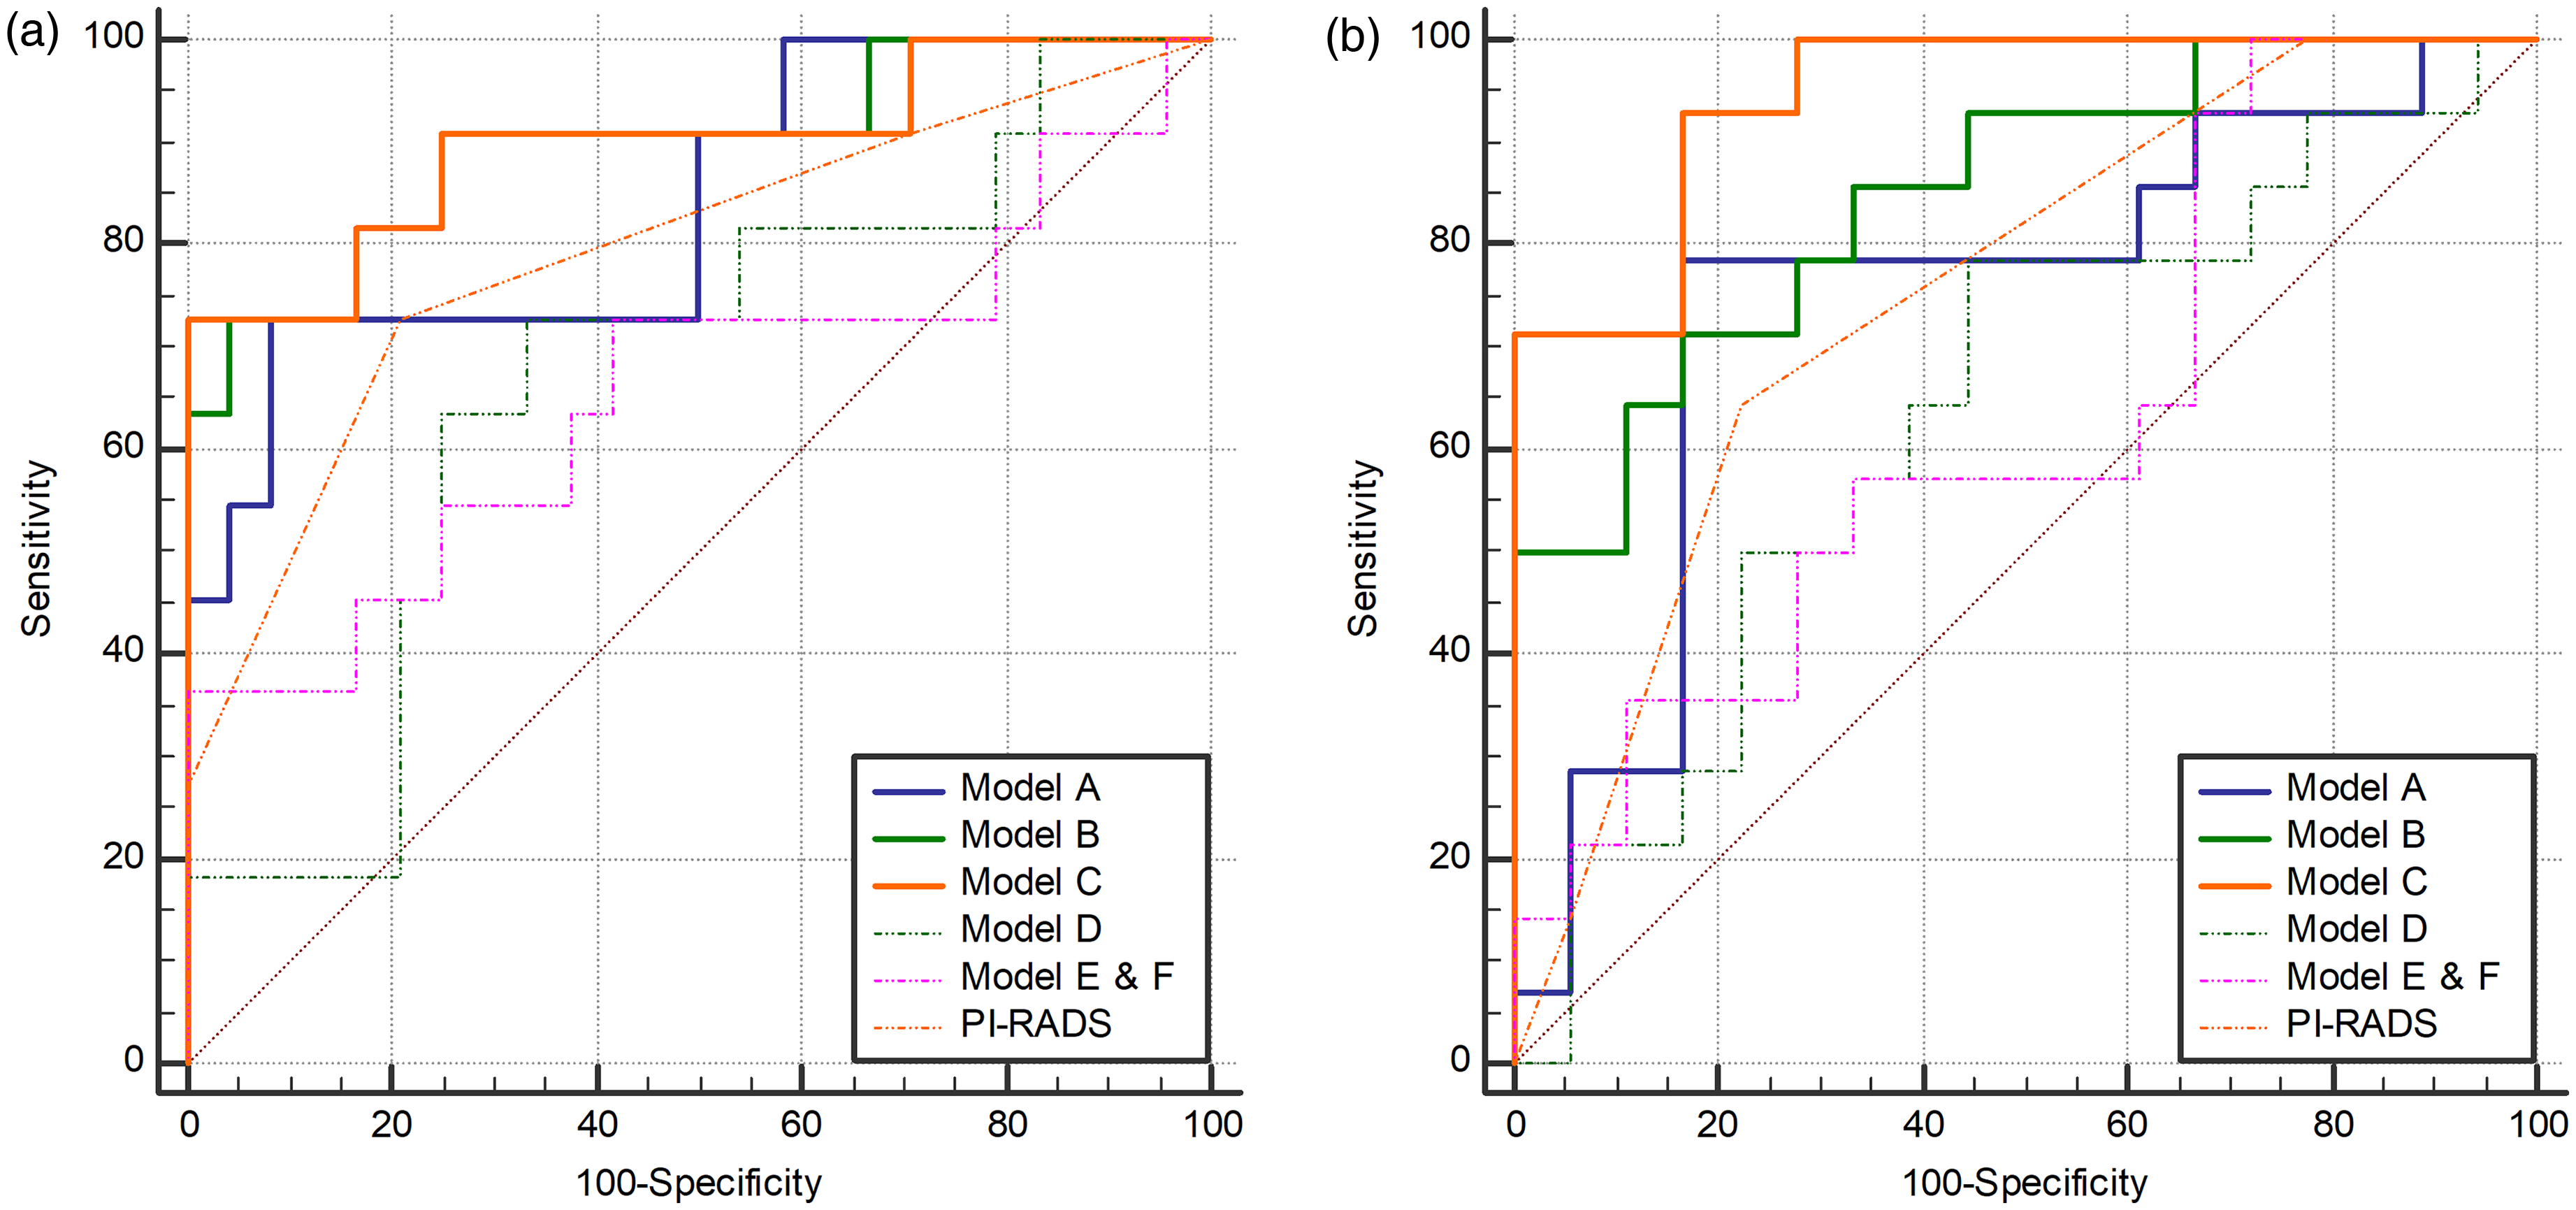
In the validation group, ROC curves demonstrate the diagnostic effectiveness of discriminating csPCa from CIS in (a) the PZ and (b) TZ. Models A, B, and C were histogram analysis models based on SyMRI, DWI, and ADC. Models D, E, and F were mean-value models based on SyMRI and ADC. ADC, apparent diffusion coefficient; CIS, clinically insignificant disease; csPCa, clinically significant prostate cancer; DWI, diffusion-weighted imaging; ROC, receiver operating characteristic; SyMRI, synthetic magnetic resonance imaging; TZ, transition zone.
Comparison with PI-RADS
When compared with the PI-RADS scoring system, histogram analysis models, particularly model C, exhibited superior diagnostic performance for PZ lesions in the training group and for TZ lesions in the validation group. Although the advantage over PI-RADS was less pronounced for TZ lesions in the training group and for PZ lesions in the validation group, the histogram models still demonstrated improved accuracy and reliability.
Discussion
In this study, we comprehensively evaluated the utility of histogram analysis and mean-value models based on SyMRI and DWI for diagnosing csPCa. Our results indicate that histogram analysis models not only demonstrated superior discriminatory ability compared to mean-value models but also achieved diagnostic performance comparable to the standard DWI and ADC approaches. Moreover, the combined model incorporating features from SyMRI, DWI, and ADC (model C) consistently outperformed all other models, including the widely used PI-RADS.
Previous studies have largely focused on applying histogram analysis to T2W imaging, DWI, and ADC maps for csPCa diagnosis (21–23); however, variations in acquisition protocols across imaging centers often compromise reproducibility (28,29). Quantitative T1, T2, and PD mapping offer scanner-independent tissue characterization and have shown promise in differentiating malignant from benign lesions and stratifying Gleason scores (12,30). However, the clinical application of these techniques has been limited by the need for prolonged acquisition times and complex spatial registration among relaxation maps. SyMRI addresses these limitations by simultaneously providing quantitative T1, T2, and PD maps with a single acquisition, enhancing efficiency and reproducibility (16).
The results of this study underscore the value of histogram analysis in extracting microstructural information that goes beyond conventional mean-value metrics. For instance, histogram features capture heterogeneity within lesions, enabling a more nuanced assessment of tumor aggressiveness (31). The higher AUCs achieved by histogram models in both training and validation cohorts highlight their robustness and potential for clinical application. This aligns with findings in other domains, such as myocarditis and liver tumors, where histogram analysis has consistently outperformed mean-value approaches (32,33).
Previous studies have demonstrated the potential of SyMRI in patients with PCa. It has been shown that the images generated by SyMRI have similar image quality to conventional images (17,18), and its diagnostic performance was comparable to that of mpMRI, which held promise for the contrast media-free evaluation of clinically significant prostate cancer (csPCa) (34). In addition, a previous study indicated that the PD value generated by SyMRI can be useful in determining the viability of bone metastases in PCa (35). Our research further supplemented this viewpoint. Our findings also revealed that SyMRI-based histogram models (model A) demonstrated comparable diagnostic performance to DWI and ADC-based histogram models (model B). This is significant because SyMRI-derived relaxation maps provide complementary tissue properties that enhance lesion characterization. For instance, T1 values can reflect the hemorrhage, T2 values were correlated with the amount of residual extra cellular fluid in gland tissue, and PD values primarily indicate water density (11,36,37). Integrating these features into histogram analysis allows for a multidimensional evaluation of lesion properties, bridging the gap between anatomical and functional imaging.
The combination model (model C) achieved the highest diagnostic performance across both PZ and TZ, with AUC values exceeding 0.94 in the validation cohort. This underscores the synergistic value of combining SyMRI, DWI, and ADC-derived features. Notably, model C demonstrated superior specificity and positive predictive value compared to PI-RADS, which has traditionally been limited by high inter-observer variability and modest performance in TZ lesions. This may be because TZ is typically characterized by some degree of BPH, and stromal BPH nodules share important imaging features with csPCa (38). This makes the imaging diagnosis of TZ csPCa more challenging compared to PZ csPCa, with lower accuracy and reproducibility of PI-RADS (39).
The present study has some limitations. First, the relatively small cohort size, particularly for validation, limits the generalizability of our findings. Multicenter studies with larger sample sizes are warranted to confirm these results and ensure reproducibility across different imaging platforms. Second, we focused exclusively on histogram features, which, while interpretable and clinically relevant, may not fully capture the complexity of tumor heterogeneity (40,41). Advanced feature sets and machine learning algorithms could further enhance model performance in future studies. Third, it's important to note that only part of the patients underwent radical prostatectomy. The evaluation of discriminatory ability is based on the conclusions of radical prostatectomy and biopsy. Consequently, based on current evidence, it is expected that a proportion of csPCa remained undetected. However, if including only patients undergoing radical prostatectomy will result in the exclusion of patients only with benign lesions and those who are unsuitable for surgical treatment due to their cancer staging, introducing selection bias into the study cohort.
In conclusion, histogram analysis of SyMRI relaxation maps provides a robust, reproducible, and efficient approach for diagnosing csPCa, offering comparable or superior performance to conventional DWI and ADC methods. The integration of SyMRI with DWI and ADC into histogram analysis models further enhances diagnostic accuracy, particularly for challenging TZ lesions. Our findings suggest that SyMRI-based histogram analysis could enhance csPCa diagnosis, particularly in combination with DWI and ADC. In the future, multicenter studies are needed to further confirm and improve the value of SyMRI in accurately diagnosing csPCa, in order to provide more robust evidence for its clinical application.
Supplemental Material
sj-docx-1-acr-10.1177_02841851251349488 - Supplemental material for SyMRI histogram analysis for diagnosing clinically significant prostate cancer
Supplemental material, sj-docx-1-acr-10.1177_02841851251349488 for SyMRI histogram analysis for diagnosing clinically significant prostate cancer by Hao Cheng, Bowen Yang, Yadong Cui, Ming Liu, Wei Zhang, Bing Wu, Pu-Yeh Wu, Jinxia Guo, Chen Zhang, Jintao Zhang, Min Chen and Chunmei Li in Acta Radiologica
Supplemental Material
sj-pdf-2-acr-10.1177_02841851251349488 - Supplemental material for SyMRI histogram analysis for diagnosing clinically significant prostate cancer
Supplemental material, sj-pdf-2-acr-10.1177_02841851251349488 for SyMRI histogram analysis for diagnosing clinically significant prostate cancer by Hao Cheng, Bowen Yang, Yadong Cui, Ming Liu, Wei Zhang, Bing Wu, Pu-Yeh Wu, Jinxia Guo, Chen Zhang, Jintao Zhang, Min Chen and Chunmei Li in Acta Radiologica
Footnotes
Author contributions
Hao Cheng, Bowen Yang, Yadong Cui, Min Chen, and Chunmei Li made a substantial contribution to the concept and design of the work. Bing Wu, Pu-Yeh Wu, Jinxia Guo made a substantial contribution to analysis and interpretation of data. Ming Liu, Wei Zhang, Chen Zhang, and Jintao Zhang made a substantial contribution to acquisition of patients.
All co-authors drafted the article and revised it critically for important intellectual content.
Declaration of conflicting interests
The authors declared no potential conflicts of interest with respect to the research, authorship, and/or publication of this article.
Ethics approval and consent to participate
This study was performed with the approval of the Ethics Committee of Beijing Hospital. Informed consent was obtained from each subject (2019BJYYEC-116-02).
Funding
The authors disclosed receipt of the following financial support for the research, authorship, and/or publication of this article: This work was supported by grants from the National Natural Science Foundation of China (82371932), the National High Level Hospital Clinical Research Funding (BJ-2023-235), and the Non-profit Central Research Institute Fund of Chinese Academy of Medical Sciences (2023-JKCS-22).

Supplementary material
Supplementary material for this article is available online.
References
Supplementary Material
Please find the following supplemental material available below.
For Open Access articles published under a Creative Commons License, all supplemental material carries the same license as the article it is associated with.
For non-Open Access articles published, all supplemental material carries a non-exclusive license, and permission requests for re-use of supplemental material or any part of supplemental material shall be sent directly to the copyright owner as specified in the copyright notice associated with the article.
