
Abstract
Background
Gout is a common metabolic condition defined by high levels of uric acid in the blood and is linked to notable comorbidities. Despite extensive research on lipid metabolism and gout, the relationship between levels of remnant cholesterol, a non-traditional lipid marker, and gout remains unexplored.
Methods
In this cross-sectional analysis, a total of 11,685 adults aged ≥20 years were selected from the National Health and Nutrition Examination Survey datasets spanning 2007 to 2018. To investigate the link between remnant cholesterol level and gout, multivariate logistic regression models were employed, adjusting for demographic, lifestyle, and health-related covariates. Dose–response associations were examined using restricted cubic spline analysis, and subgroup analyses were performed to examine potential effect modifiers. In addition, mediation analyses were conducted to assess whether body mass index and serum uric acid levels partially mediated the observed association.
Results
Elevated remnant cholesterol levels showed a significant relationship with a higher prevalence of gout (odds ratio = 1.01, 95% confidence interval: 1.01–1.02, per 1-mg/dL increase in remnant cholesterol level). Participants in the top quartile of remnant cholesterol level had 65% greater odds of gout than those in the bottom quartile (odds ratio = 1.65, 95% confidence interval: 1.24–2.19, p for trend <0.001). Restricted cubic spline analysis demonstrated a linear positive relationship between remnant cholesterol level and gout. Subgroup analyses and interaction tests demonstrated the robustness of this association across diverse population subgroups. Further mediation analyses indicated that body mass index and serum uric acid levels mediated for 23% and 40% of the total effect of remnant cholesterol level on gout, respectively.
Conclusion
This study is the first to reveal a significant positive association between remnant cholesterol and gout in US adults, with body mass index and serum uric acid levels acting as partial mediators of this relationship. These findings highlight the potential value of remnant cholesterol as a novel risk marker for gout.
Keywords
Introduction
As a widespread metabolic disorder, gout is associated with high serum uric acid (SUA) levels that promote the accumulation of monosodium urate crystals in tissues or joints, activating inflammatory responses.1–3 Typical symptoms include recurrent episodes of acute arthritis, manifesting as severe joint pain, redness, swelling, and functional impairment. In the absence of appropriate treatment, gout may lead to permanent joint destruction and the development of tophi. 4 The global prevalence of gout is approximately 1%–4%; in the United States, it affects 3.9% of adults, accounting for over 9.2 million individuals, with its incidence steadily increasing.5–7 The economic burden of gout has escalated in recent years, with the average annual medical cost per patient exceeding US$6000. 8 There is a strong association between gout and comorbid conditions such as obesity, hypertension, kidney disorders, and cardiovascular problems, due to which, gout substantially impairs health and quality of life.9–11 As a global public health challenge, gout imposes significant strain on healthcare systems and socioeconomic resources. Therefore, identifying and understanding the potential factors associated with gout is critical.
Remnant cholesterol (RC) is an emerging, non-traditional lipid index representing the total cholesterol (TC) content within lipoproteins rich in triglycerides (TGs), including remnants of chylomicrons (CMs), very-low-density lipoproteins (VLDLs), and intermediate-density lipoproteins (IDLs). Under fasting conditions, RC primarily comprises cholesterol in VLDL and IDL, whereas, in non-fasting states, CM remnants become the predominant source of RC. 12 Recent research has extensively revealed a robust connection between RC level and multiple diseases, such as non-alcoholic fatty liver disease, 13 hypertension, 14 diabetes, 15 periodontitis, 16 rheumatoid arthritis, 17 and ischemic stroke. 18 In addition, compared with traditional lipid indicators, RC level has demonstrated higher sensitivity and superior predictive value for both cardiovascular disease (CVD) risk and total spine bone mineral density (BMD).19,20 However, no studies have examined the relationship between RC level and gout.
To bridge this knowledge gap, we performed a cross-sectional analysis to explore the possible link between RC level and gout, with additional mediation analyses conducted to assess the potential intermediary roles of body mass index (BMI) and SUA.
Methods
Participants and study design
The National Health and Nutrition Examination Survey (NHANES) is a country-wide survey conducted to examine the health and dietary profile of nonhospitalized individuals from diverse regions within the US. Conducted annually, this program systematically gathers extensive data to provide insights into the overall health and nutritional well-being of this population. 21 The National Center for Health Statistics (NCHS), a unit within the US Centers for Disease Control and Prevention (CDC), is responsible for conducting NHANES. 22 The complex survey design and specific sample weighting methods of the NHANES ensure that the study results are statistically accurate and fully representative of the entire population. Participant data were integrated with information obtained through household interviews, physical examinations, and assessments conducted at the mobile examination center (MEC). Written informed consent was obtained from all participants or their legal guardians, and approval for the study protocol was granted by the NCHS Ethics Review Board. The entire NHANES dataset can be accessed from its official site (https://www.cdc.gov/nchs/nhanes/).
The study initially recruited 59,842 participants from the NHANES (2007–2018) dataset, excluding 25,072 individuals who were aged <20 years. Participants with missing data on gout, RC level, or other relevant covariates were subsequently excluded. Finally, 11,685 participants were part of the final analysis. The selection and exclusion procedure are depicted in Figure 1. Furthermore, a comparison of the baseline characteristics between the included participants and those excluded due to missing data is detailed in Supplementary Table S1.
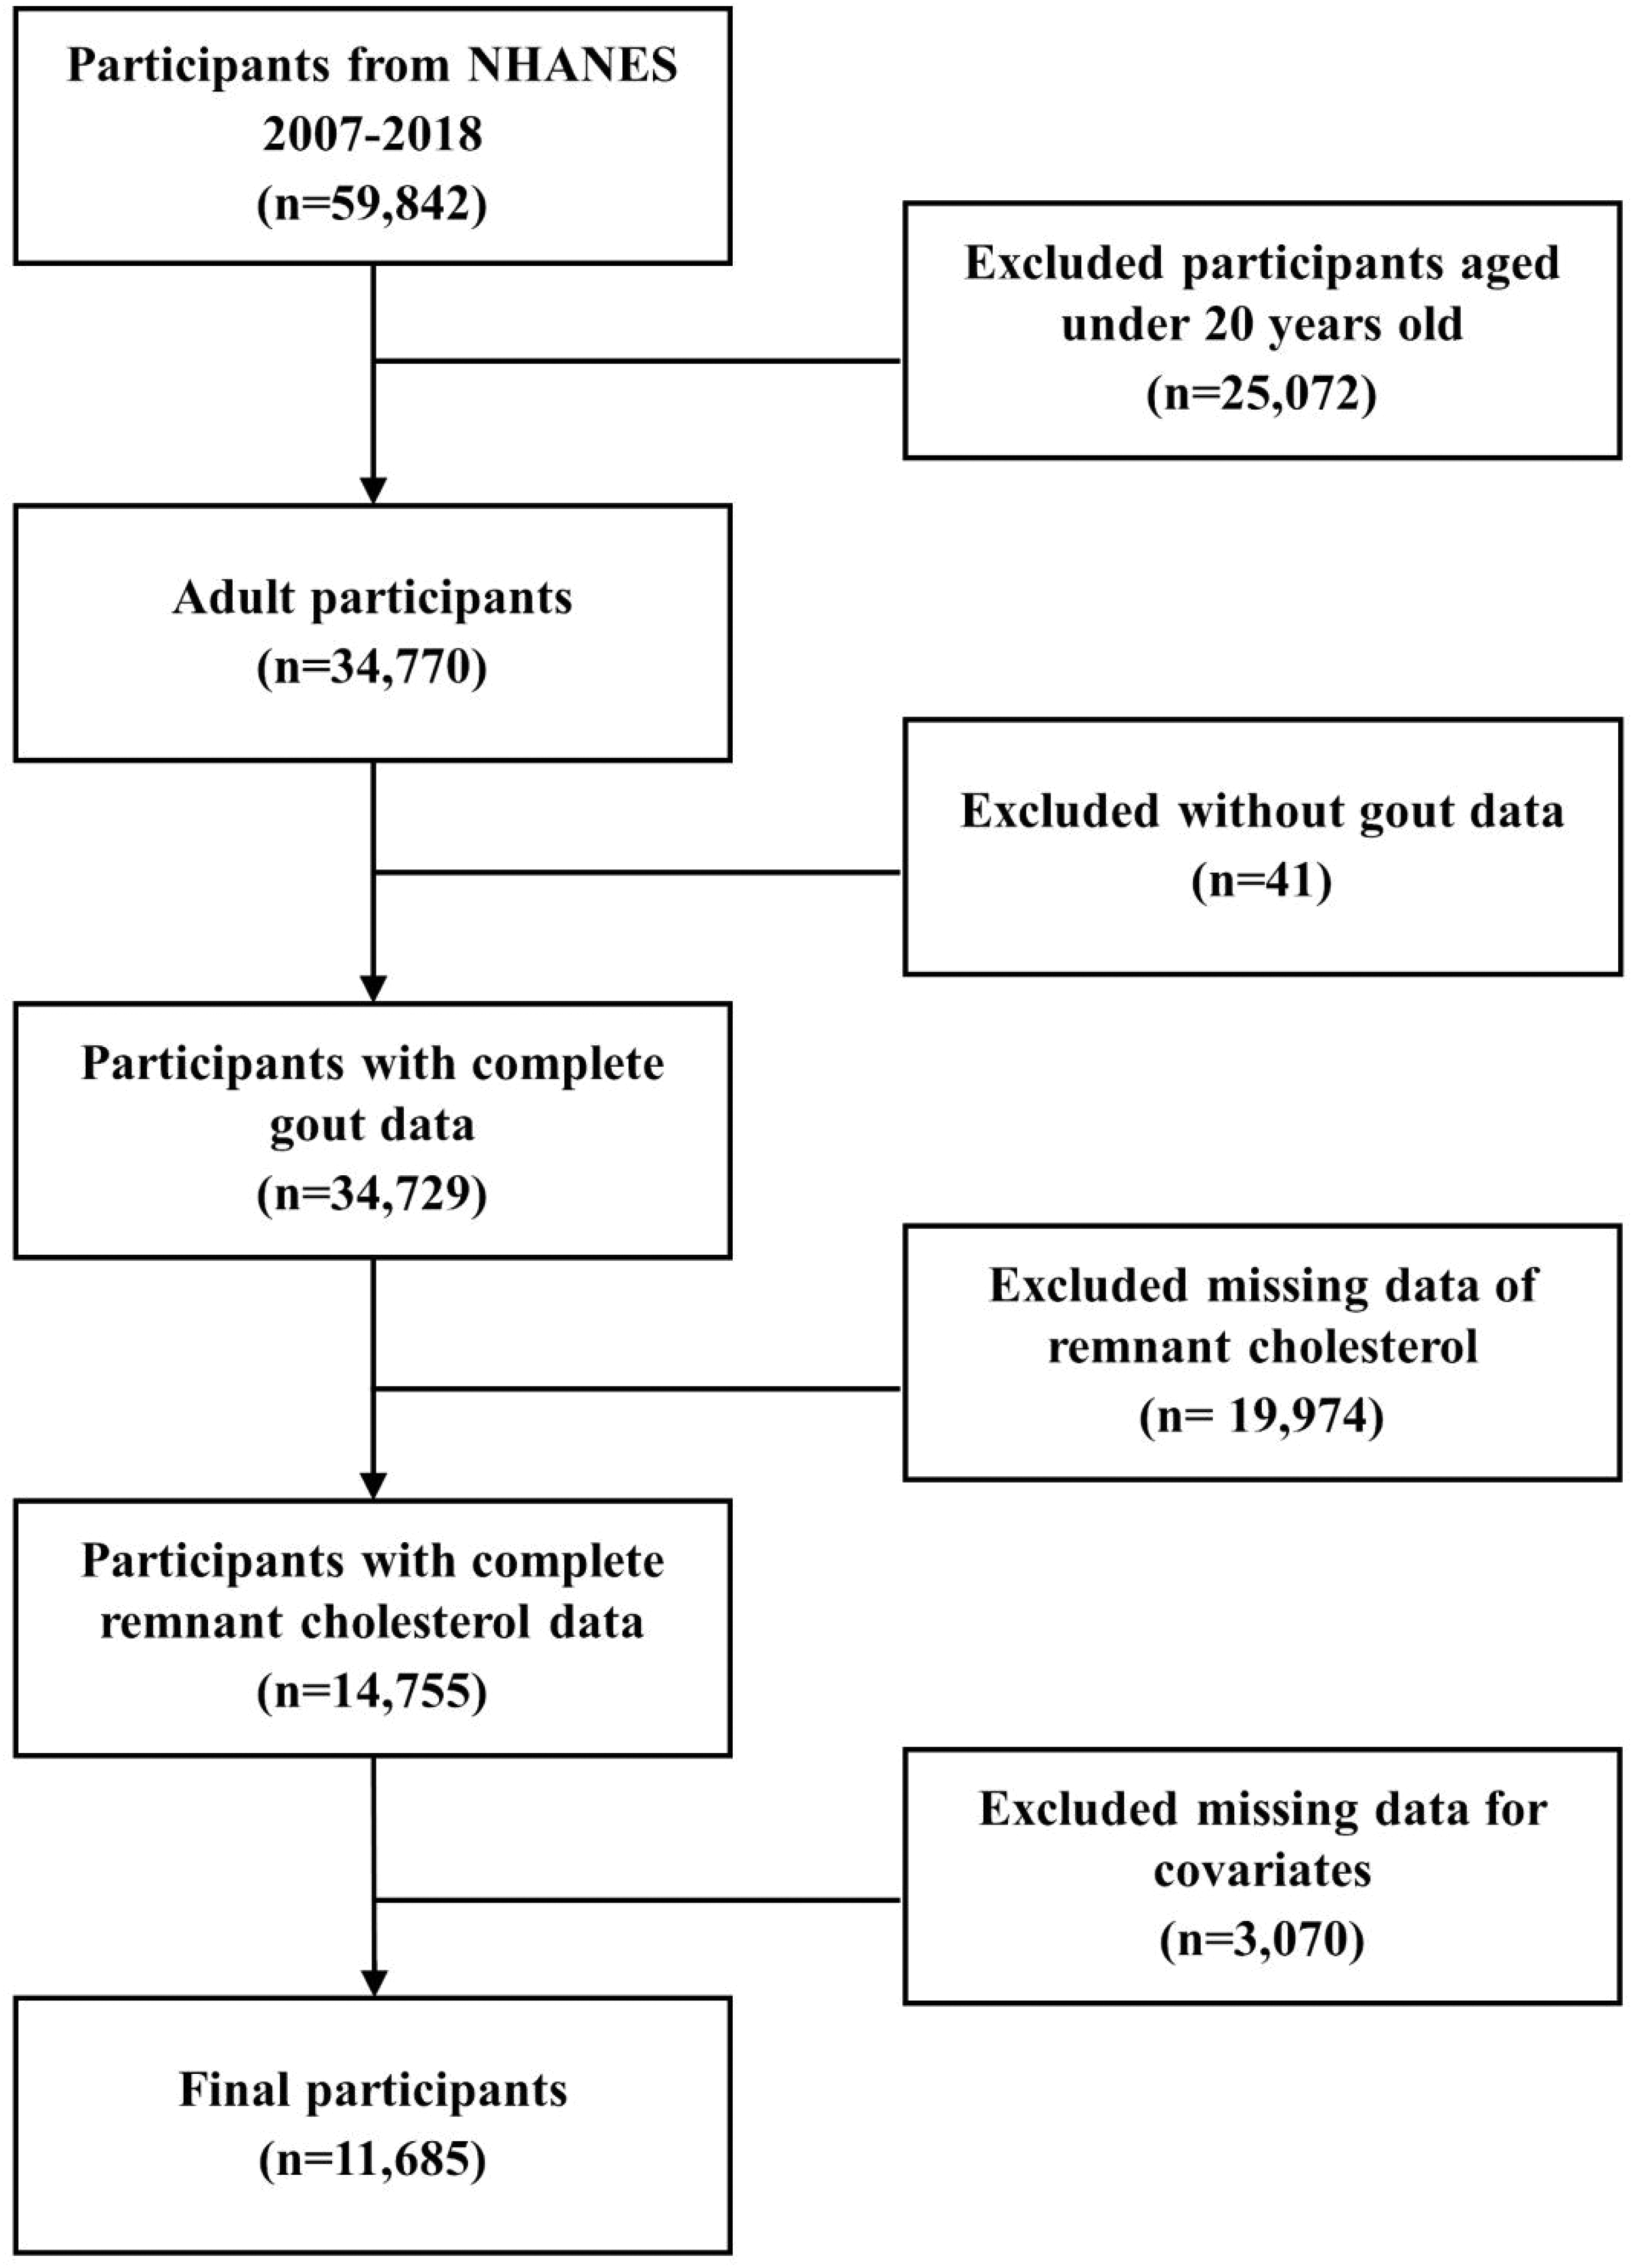
Flow chart of the study.
Assessment of gout
The outcome variable in this study was gout diagnosis. Participants with gout were identified as those who responded “yes” to the question, “Has any doctor or healthcare provider ever informed you that you have gout?” in the MCQ160N health questionnaire during the household interview. This questionnaire is a standardized component of the NHANES survey protocols, which are publicly available. 23
Measurement of RC
RC level (mg/dL) was defined as an exposure variable in this study. Blood samples were drawn from all participants at the MEC following a fasting period of ≥9 h overnight. The collected blood samples were processed and sent to certified laboratories for testing and analysis. The RC level was derived by subtracting the combined levels of high-density lipoprotein cholesterol (HDL-C) and low-density lipoprotein cholesterol (LDL-C) from that of TC, in accordance with dyslipidaemia management guidelines. 24
Assessment of covariates
To identify potential confounders in the relationship between RC level and gout, this study incorporated multiple covariates for adjustment, guided by prior literature and clinical practice. The covariates included demographic factors such as sex, age, race, marital status, educational level, and poverty-to-income ratio (PIR), along with health and lifestyle variables such as BMI, hypertension, diabetes, smoking status, alcohol consumption, white blood cell count (WBC; 109/L), serum alanine aminotransferase (ALT; U/L) level, serum creatinine (SCr; mg/dL) level, and SUA (mg/dL) level. Hypertension, diabetes, smoking status, and alcohol consumption were assessed using a household questionnaire. Relevant questions included: “Has a healthcare provider ever informed you that you have high blood pressure?”, “Has a healthcare provider ever diagnosed you with diabetes?”, “Have you ever smoked 100 or more cigarettes in total?”, and “Have you consumed 12 or more alcoholic drinks in the last year?” The questions used are part of the standardized and previously published NHANES interview instruments. 23
Statistical analyses
Due to the sophisticated sampling approach of the NHANES survey, this study applied specific sample weights (WTSAF2YR), stratification variables (SDMVSTRA), and clustering variables (SDMVPSU) to ensure that the findings accurately represent the characteristics of the US population. To combine data from the 12-year cycle, the 2-year fasting sub-sample weights were divided by 6 to adjust the sampling weights. For continuous data, weighted averages and SDs were used, with analyses conducted using weighted t-tests. Categorical data were quantified as weighted percentages and assessed using chi-square tests.
Participants were categorized into four quartile groups based on their RC levels (Q1: 2.0–14.0, Q2: 14.0–20.0, Q3: 20.0–29.0, and Q4: 29.0–80.0). A multivariate logistic regression model was used to evaluate the connection between RC level and gout. Three models were developed to sequentially adjust for covariates. Model 1 was not adjusted for covariates; Model 2 was adjusted for sex, age, and race; Model 3 was additionally adjusted for marital status, educational level, PIR, BMI, hypertension, diabetes, smoking status, alcohol consumption, WBC, ALT level, SCr level, and SUA level. Simultaneously, the dose–response relationship between RC level and gout was examined using restricted cubic spline (RCS) analysis to evaluate the potential for a nonlinear association.
Additionally, we conducted further subgroup analyses and interaction tests based on sex (male or female), age (<60 or ≥60 years), race (non-Hispanic white, non-Hispanic black, or other race), marital status (married or unmarried/other), educational level (less than high school, high school or General Educational Development (GED), or above high school), PIR (<1.5, 1.5–3.5, or >3.5), BMI (<25, 25–30, or >30 kg/m2), smoking status (yes or no), alcohol consumption (yes or no), hypertension (yes or no), and diabetes (yes or no) to explore whether the association between RC level and gout varied across subgroups.
Mediation analysis was performed to assess whether BMI and SUA levels mediated the relationship between RC level and gout. All covariates included in the fully adjusted Model 3, excluding BMI and SUA level, were controlled for in the models. Mediation was considered present if all the following conditions were met: (a) the indirect effect was statistically significant; (b) total effect was significant; and (c) proportion mediated was greater than zero.
Data processing, statistical analyses, and visualization for this study were performed using R Studio. A p-value of <0.05 was employed to determine statistical significance.
Results
Characteristics of participants from the NHANES (2007–2018)
Table 1 outlines the baseline characteristics of participants based on their gout status. The 11,685 participants represented 185,263,076 individuals from the US population aged ≥20 years. The study population included 48.6% men and 51.4% women, with a mean age of 47.2 ± 16.92 years. The cohort predominantly comprised non-Hispanic White individuals (68.7%). The mean RC level was 23.1 ± 13.15 mg/dL, and 561 participants were diagnosed with gout. Moreover, gout occurrence was significantly associated with sex; age; marital status; BMI; smoking status; hypertension; diabetes; WBC; and SCr, SUA, and RC levels (p < 0.05).
Baseline characteristics of participants with and without gout.
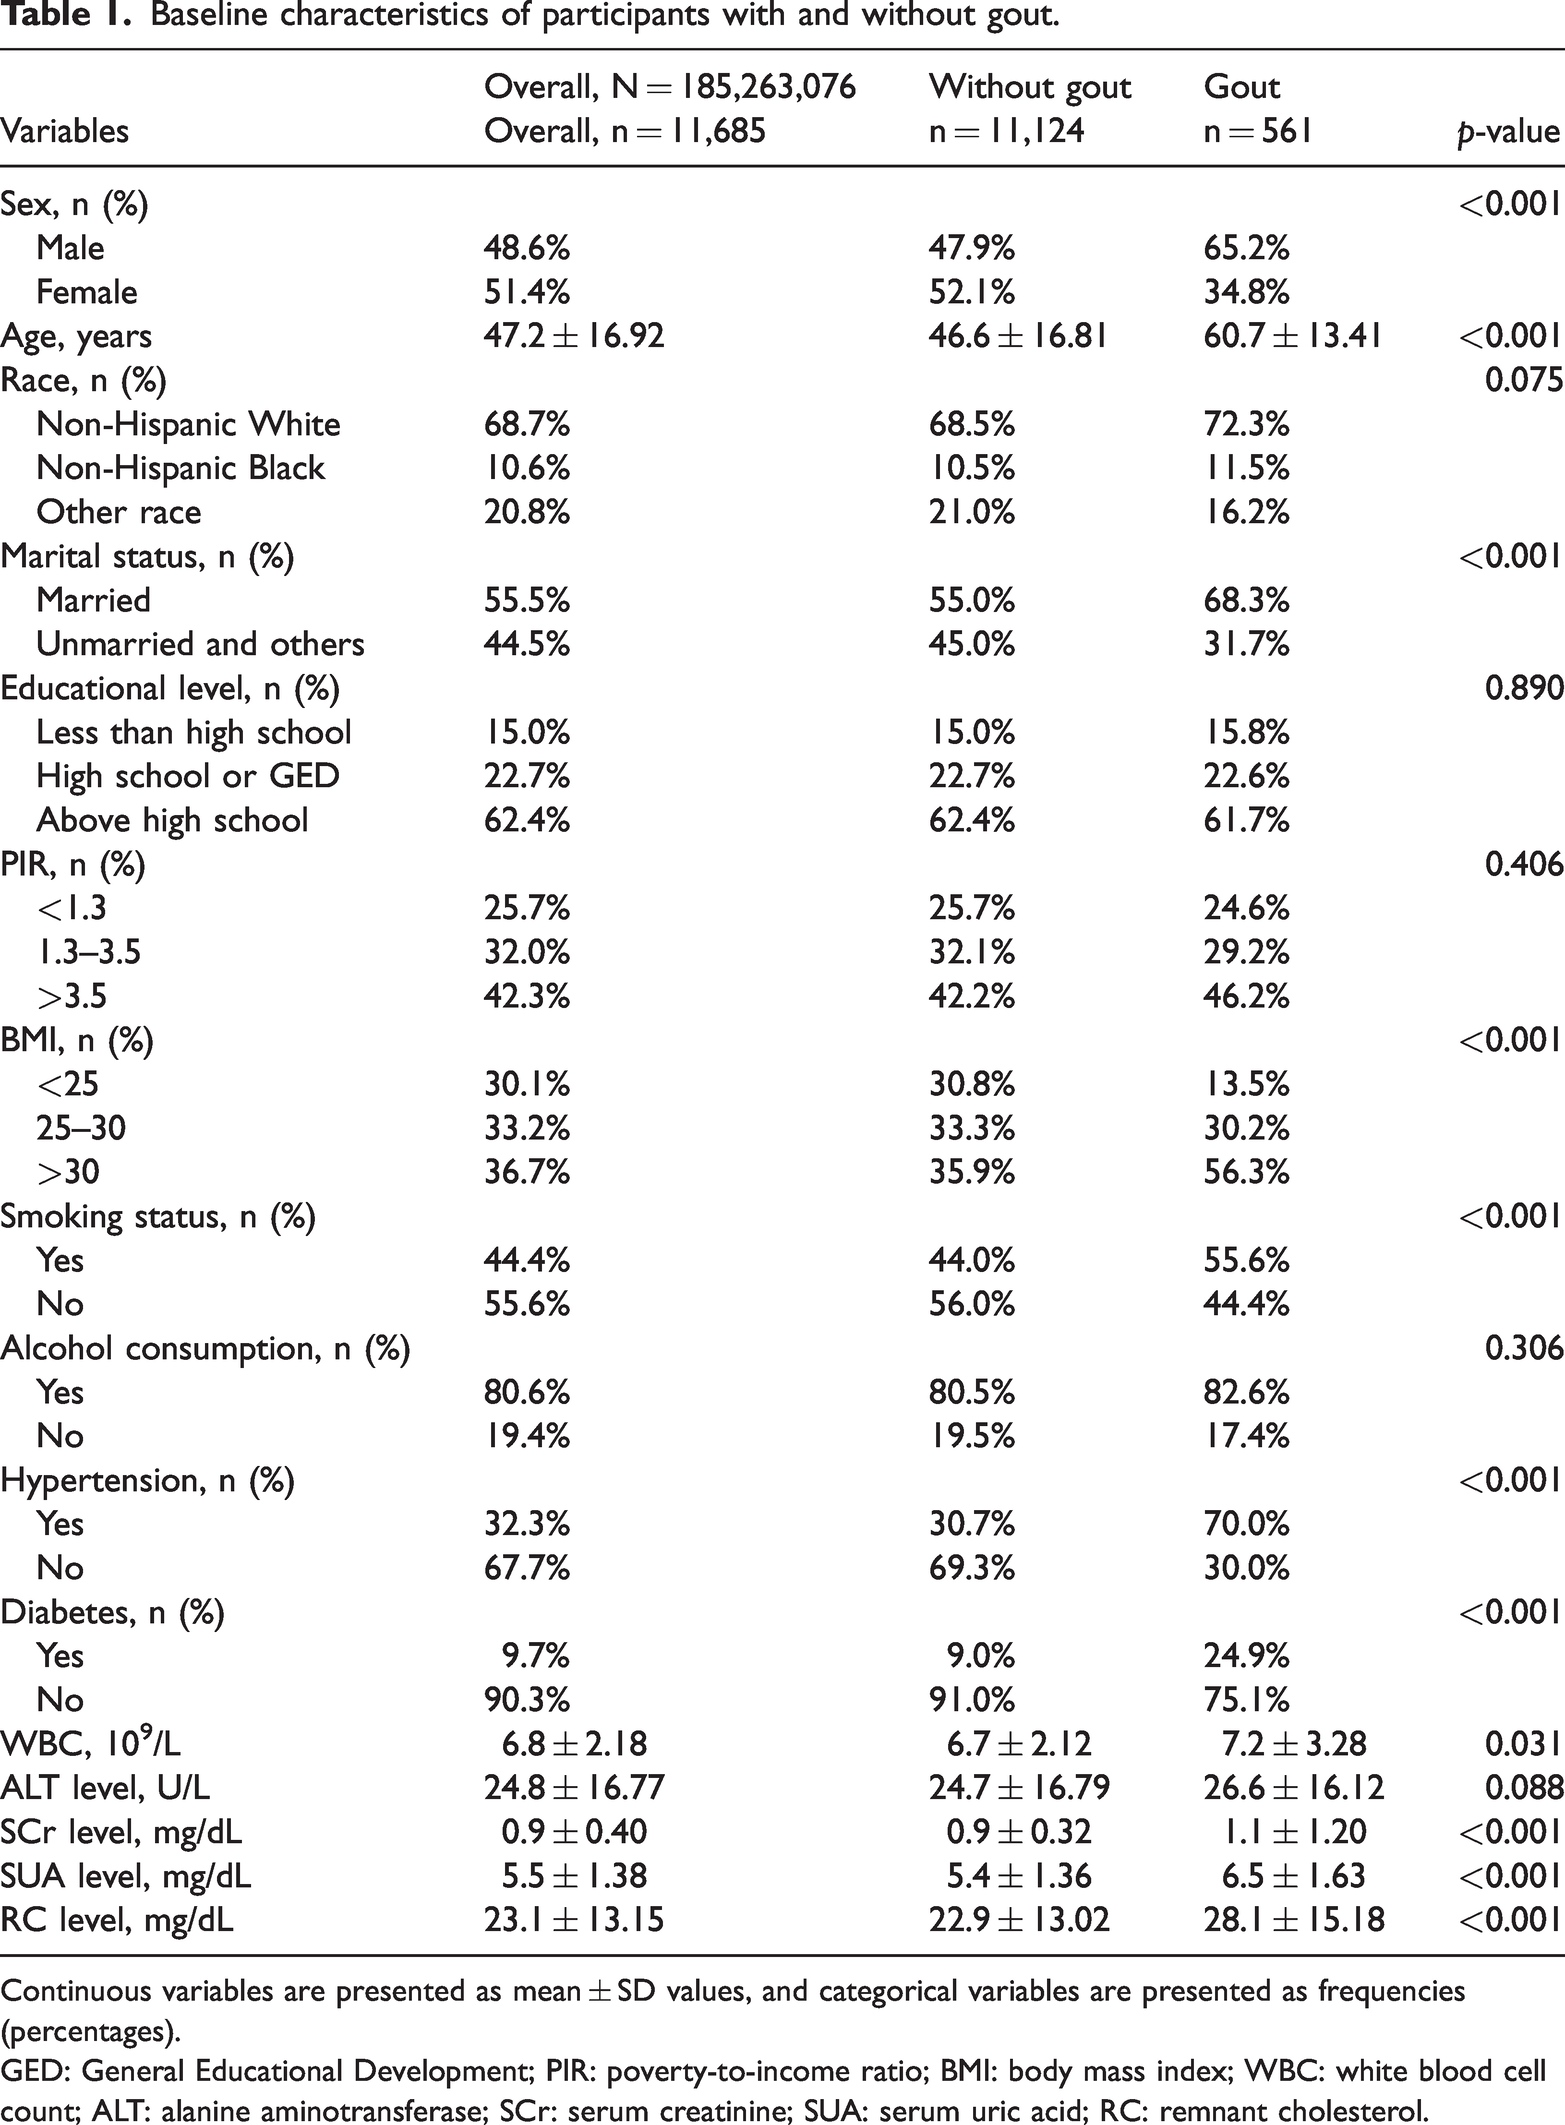
Continuous variables are presented as mean ± SD values, and categorical variables are presented as frequencies (percentages).
GED: General Educational Development; PIR: poverty-to-income ratio; BMI: body mass index; WBC: white blood cell count; ALT: alanine aminotransferase; SCr: serum creatinine; SUA: serum uric acid; RC: remnant cholesterol.
Baseline comparison based on RC quartile grouping
Table 2 summarizes the basic characteristics of participants, stratified by RC level quartiles. Significant differences were observed across RC level quartiles in terms of sex; age; race; marital status; educational level; BMI; hypertension; diabetes; smoking status; WBC; gout; and ALT, SCr, and SUA levels (p < 0.05). When compared with Q1 participants, those in Q4 had a higher probability of being male, older, of non-Hispanic White ethnicity, married, and a lower likelihood of having completed college education. Additionally, they were more likely to be obese, smoke, and have hypertension, diabetes, higher SUA levels, and gout.
Baseline comparison of participants grouped by RC quartiles.
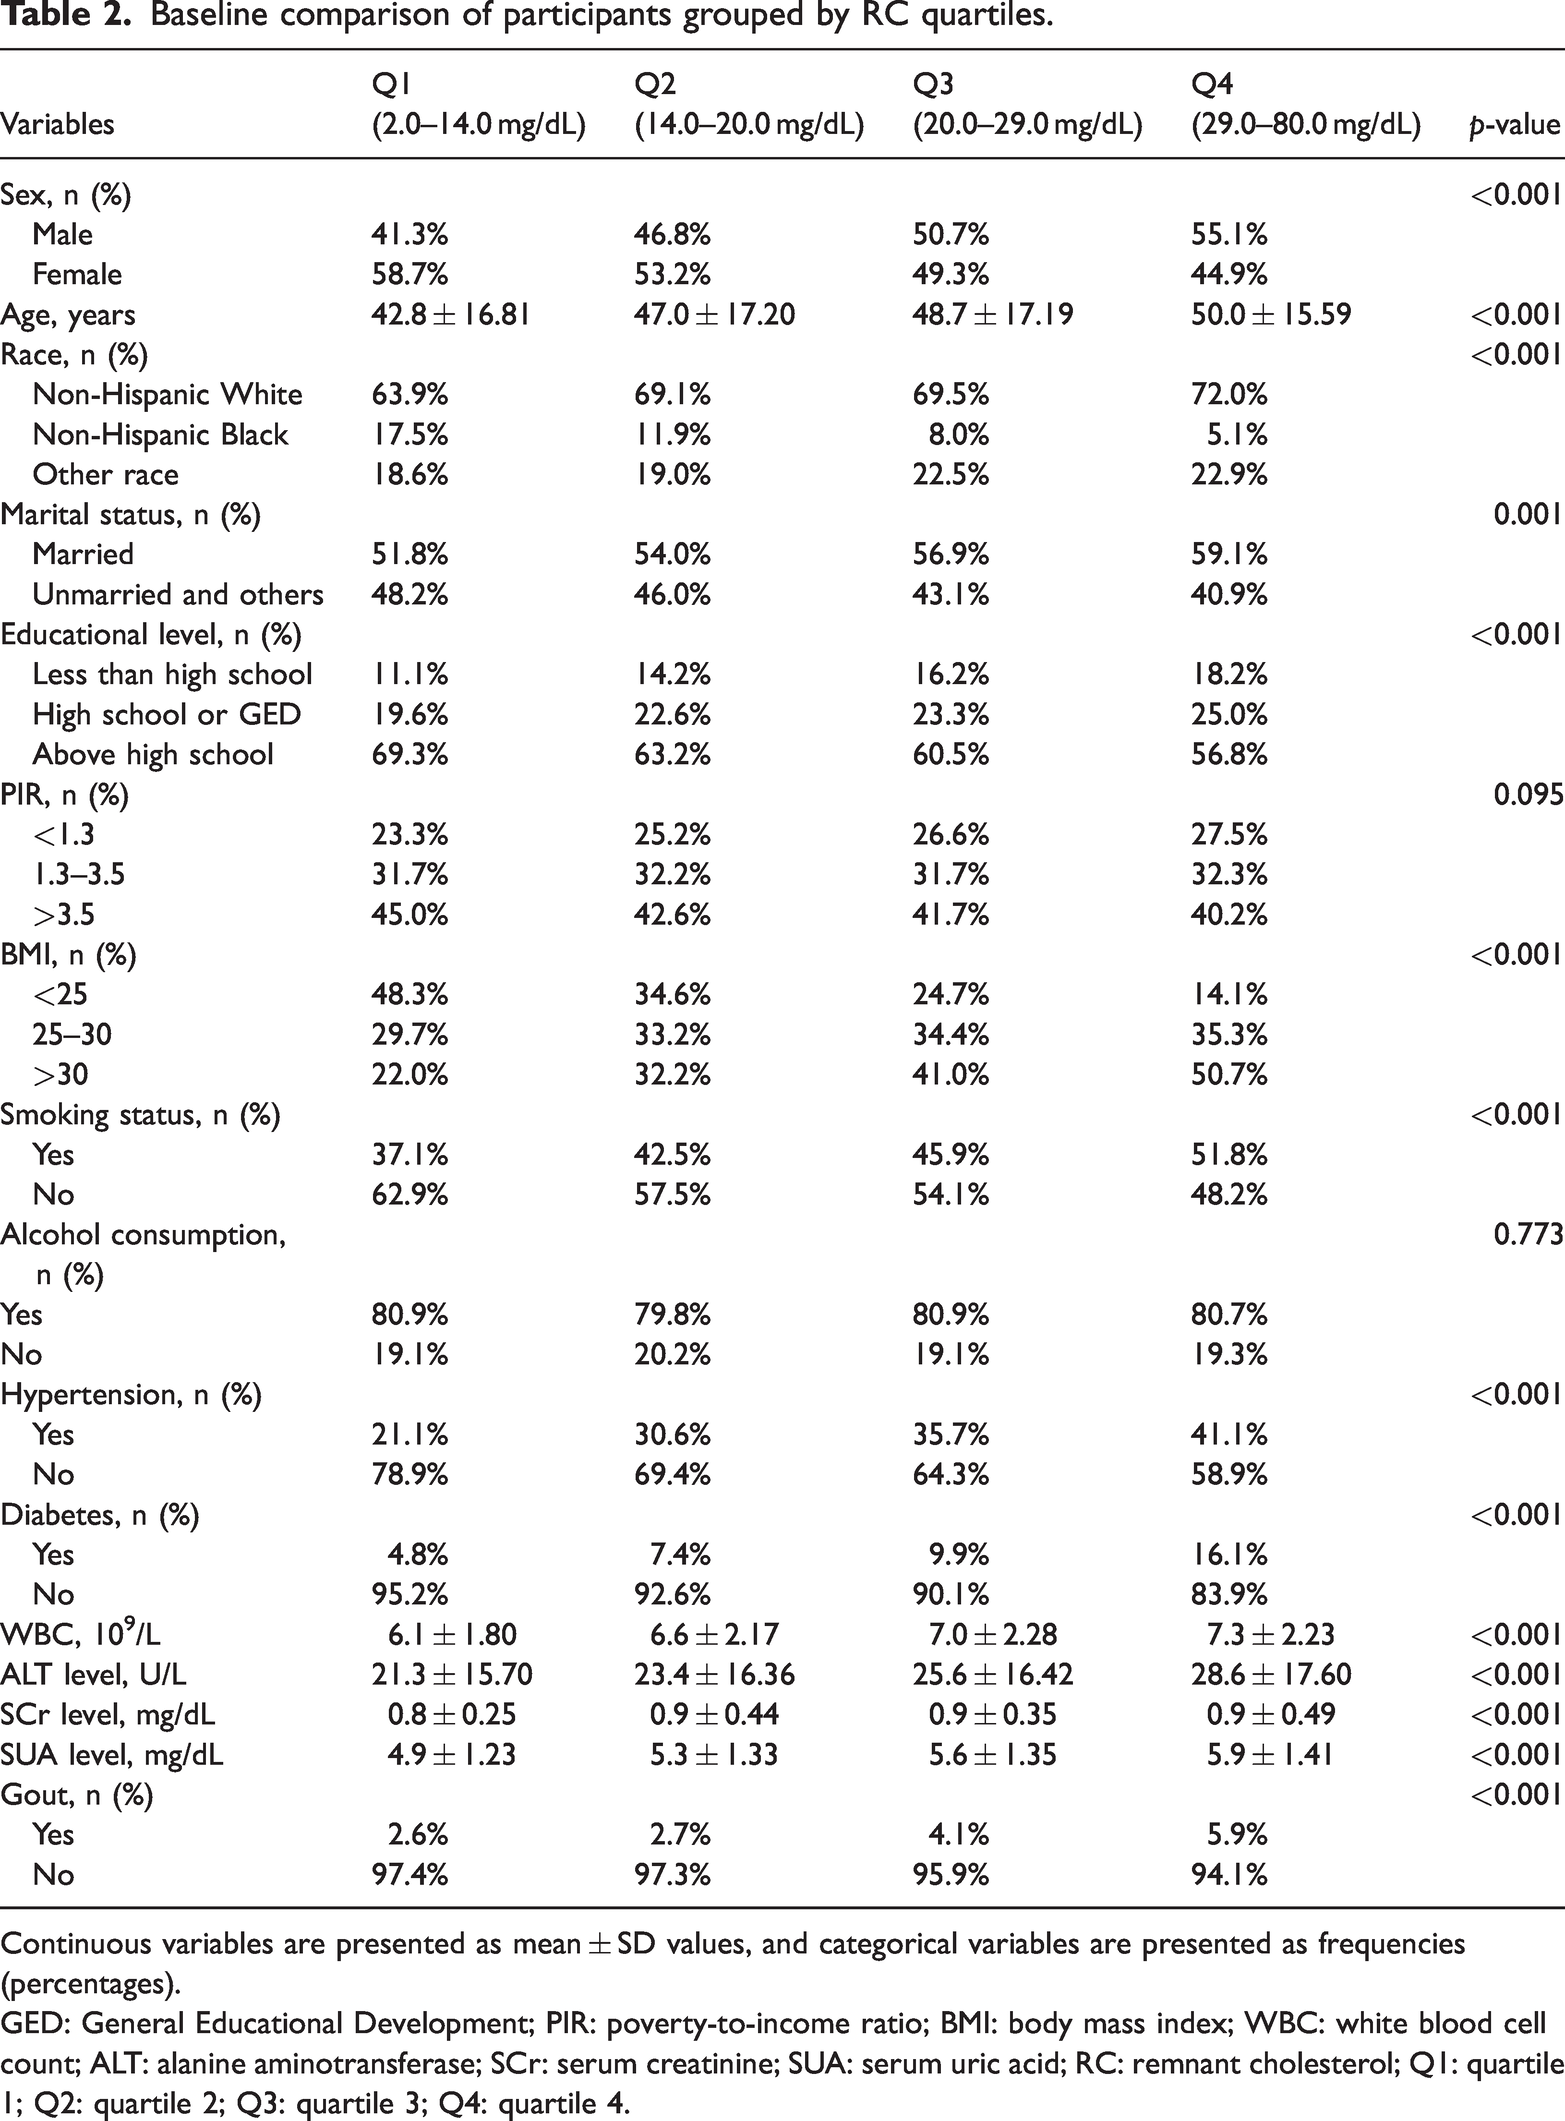
Continuous variables are presented as mean ± SD values, and categorical variables are presented as frequencies (percentages).
GED: General Educational Development; PIR: poverty-to-income ratio; BMI: body mass index; WBC: white blood cell count; ALT: alanine aminotransferase; SCr: serum creatinine; SUA: serum uric acid; RC: remnant cholesterol; Q1: quartile 1; Q2: quartile 2; Q3: quartile 3; Q4: quartile 4.
Associations of RC with gout
Results of multivariate logistic regression assess the association between RC level and gout (Table 3). The analysis indicated that increased RC levels were notably linked to a higher prevalence of gout. When considered as a continuous variable, RC level showed a strong positive relationship with gout in both Model 1 (odds ratio (OR) = 1.02, 95% confidence interval (CI): 1.02–1.03) and Model 2 (OR = 1.02, 95% CI: 1.02–1.03). This relationship remained significant following adjustment for all variables in Model 3 (OR = 1.01, 95% CI: 1.01–1.02). This finding indicates that each 1-mg/dL increase in the RC level corresponds to an approximately 1% higher gout prevalence. In the analysis based on quartiles, the model adjusted for all factors showed that individuals in the Q4 group were 65% more likely to develop gout than those in the Q1 group (OR = 1.65, 95% CI: 1.24–2.19, p for trend < 0.001). To further investigate the relationship between RC level and gout, we conducted RCS analysis. Figure 2 illustrates a linear positive relationship between RC level and gout, with no evidence of a threshold effect or saturation.
Association between RC level and gout.
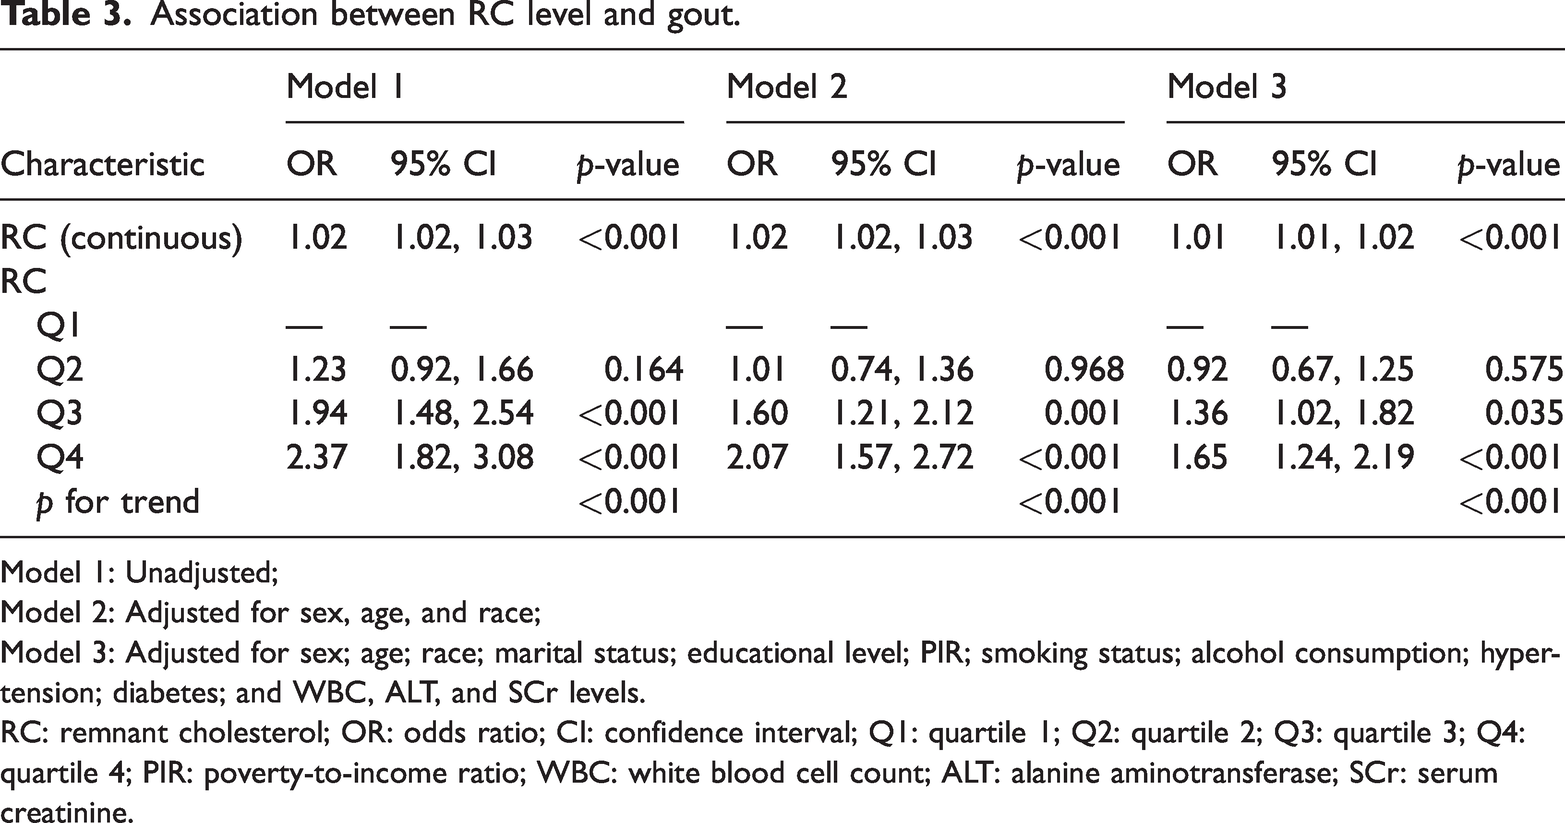
Model 1: Unadjusted;
Model 2: Adjusted for sex, age, and race;
Model 3: Adjusted for sex; age; race; marital status; educational level; PIR; smoking status; alcohol consumption; hypertension; diabetes; and WBC, ALT, and SCr levels.
RC: remnant cholesterol; OR: odds ratio; CI: confidence interval; Q1: quartile 1; Q2: quartile 2; Q3: quartile 3; Q4: quartile 4; PIR: poverty-to-income ratio; WBC: white blood cell count; ALT: alanine aminotransferase; SCr: serum creatinine.
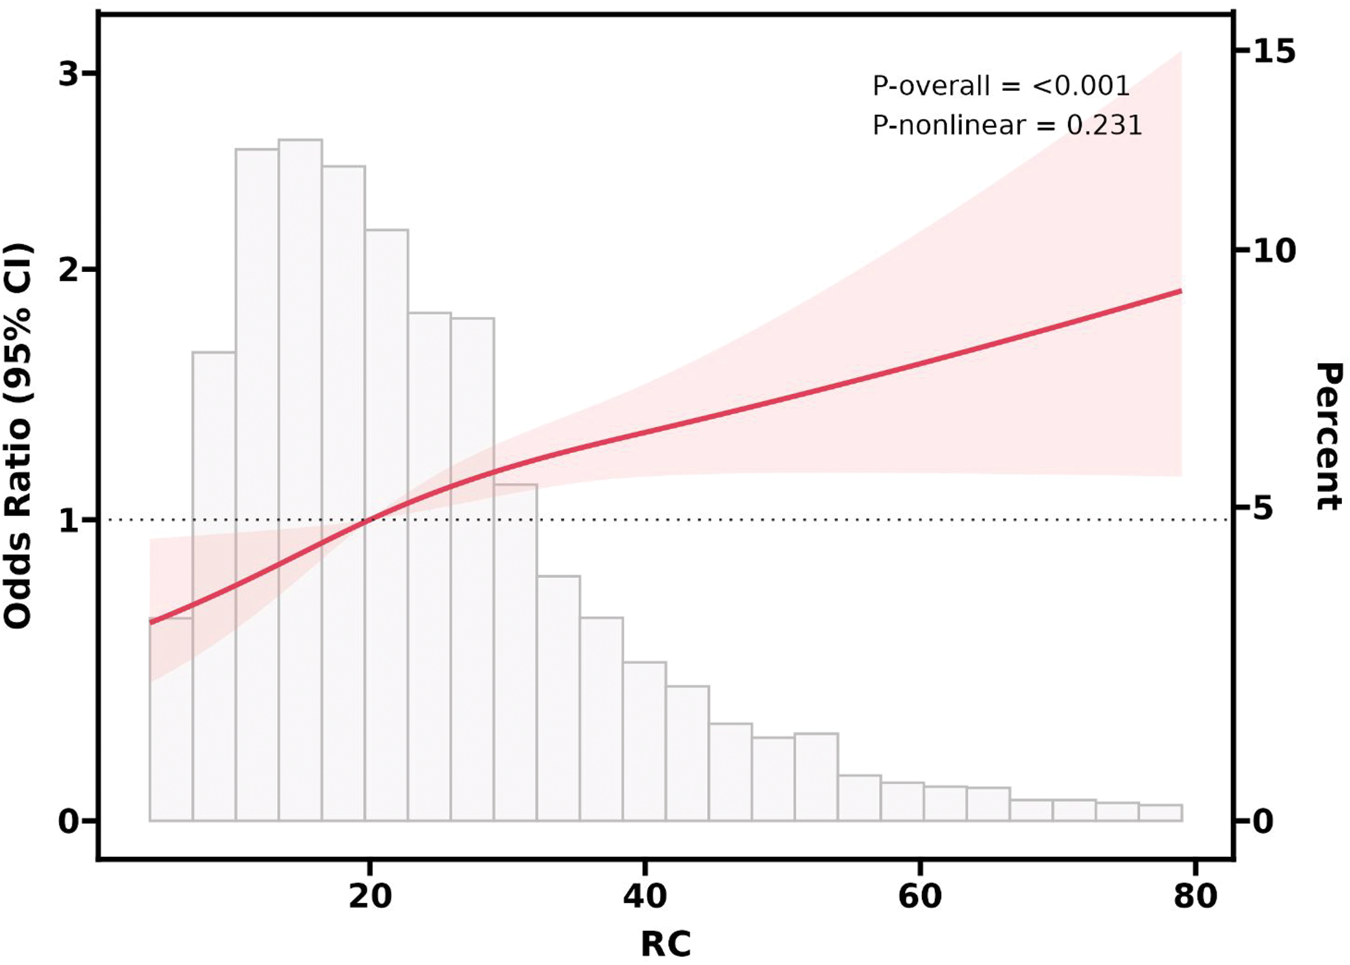
Multivariate-adjusted restricted cubic spline (RCS) model showing a linear relationship between RC levels and gout. RC: remnant cholesterol.
Subgroup analyses
To examine the link between RC level and gout across diverse populations, we conducted subgroup analyses and interaction tests (Figure 3). The results demonstrated no statistically meaningful interactions in any subgroup (p for interaction > 0.05).
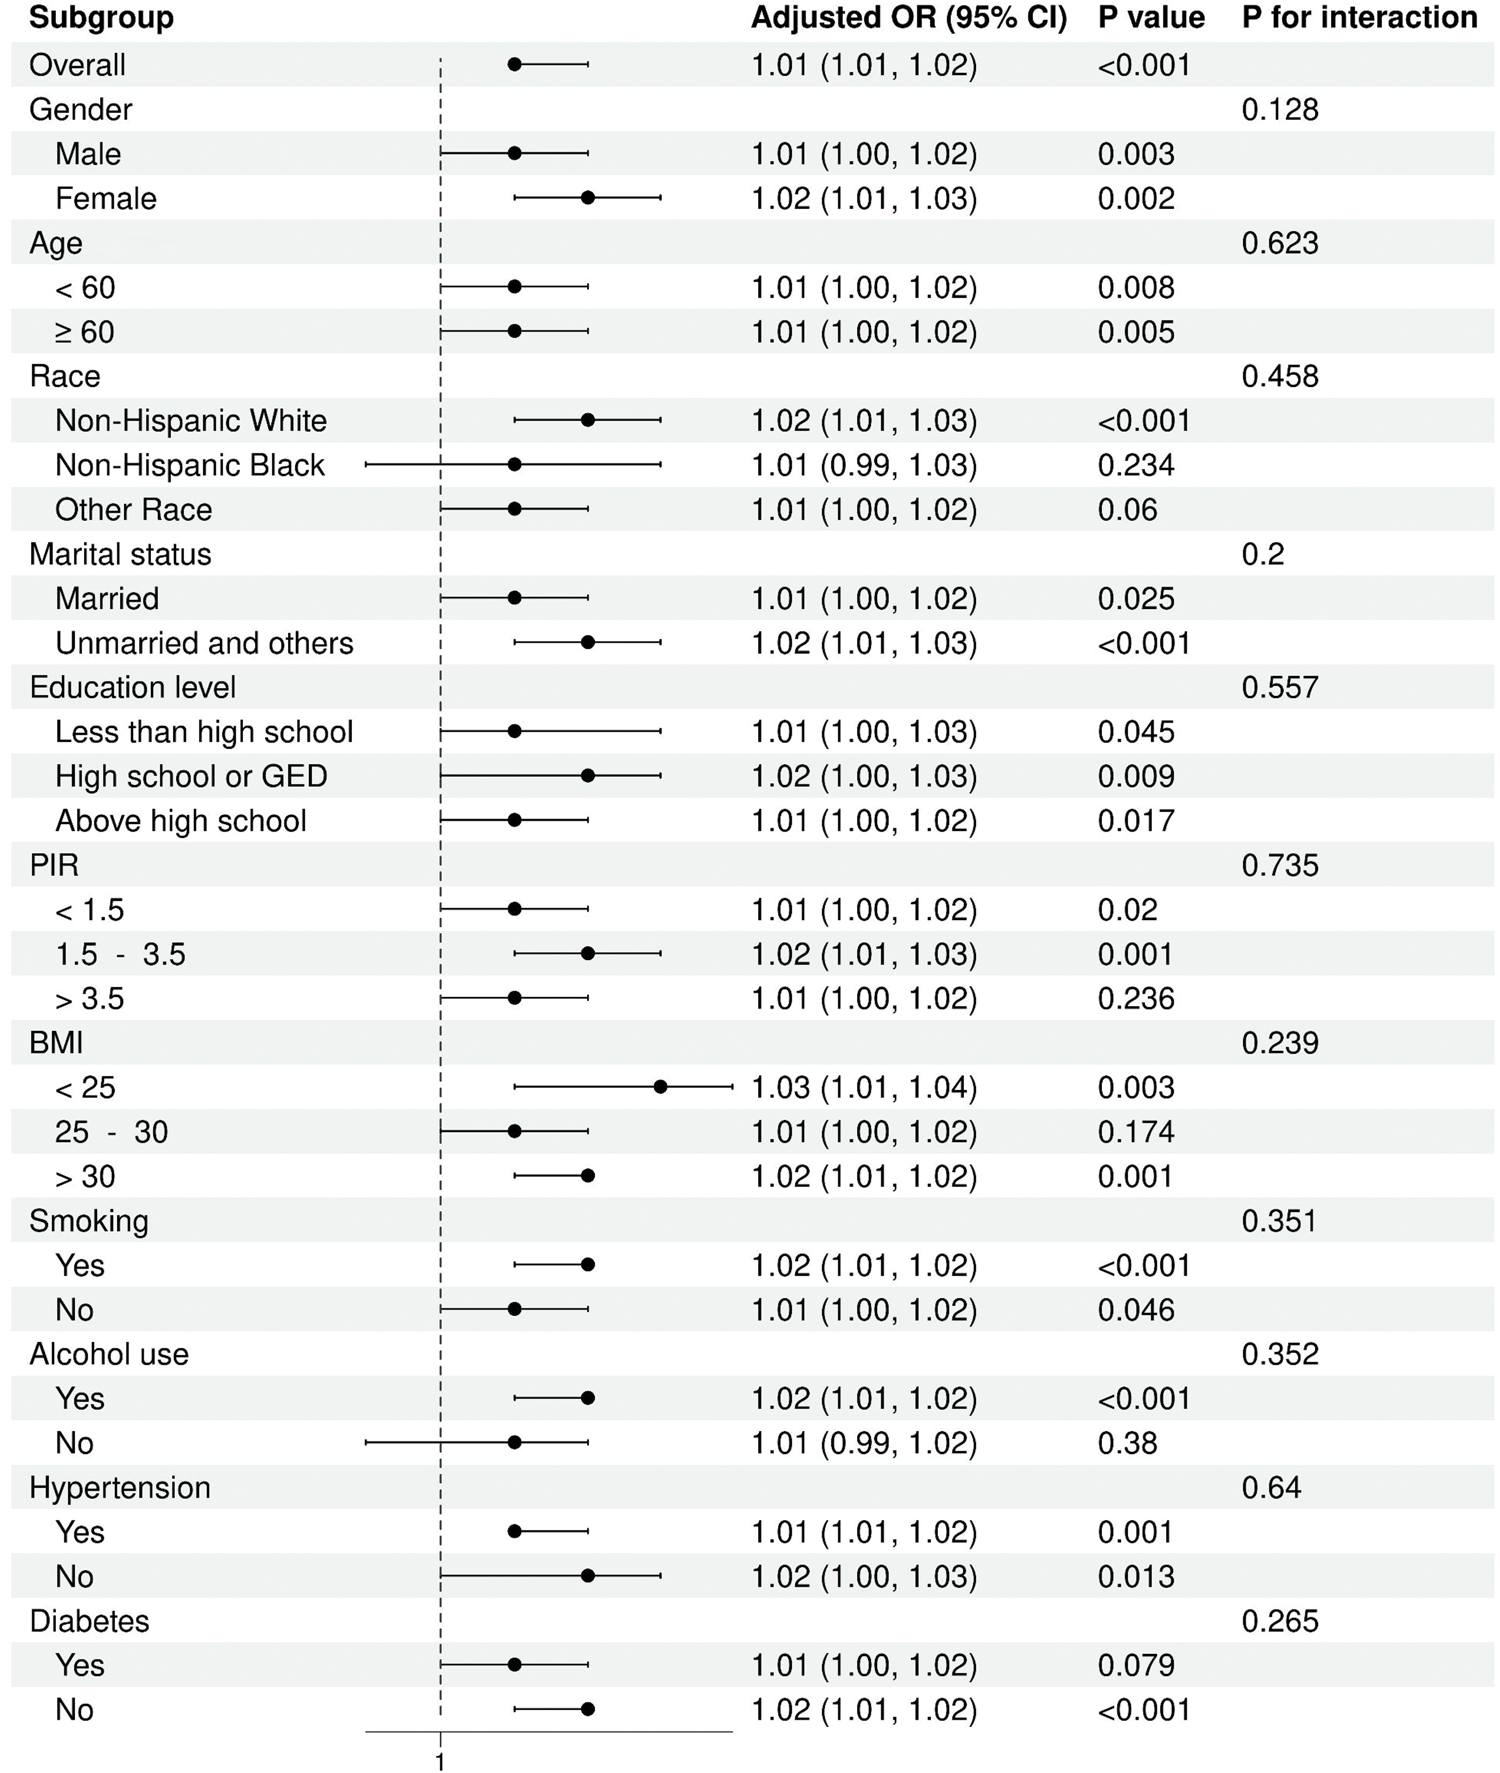
Subgroup analysis of the association between RC levels and gout. RC: remnant cholesterol.
Mediating role of BMI and SUA levels
Figure 4 illustrates a mediation analysis investigating the intermediary roles of BMI and SUA level in the association between RC level and gout. In this framework, RC level was considered the independent variable, gout the dependent variable, and BMI and SUA level potential mediators. After adjusting for all relevant covariates, the analysis revealed that BMI and SUA level mediated 23.0% and 40.0% of the RC level–gout relationship, respectively.
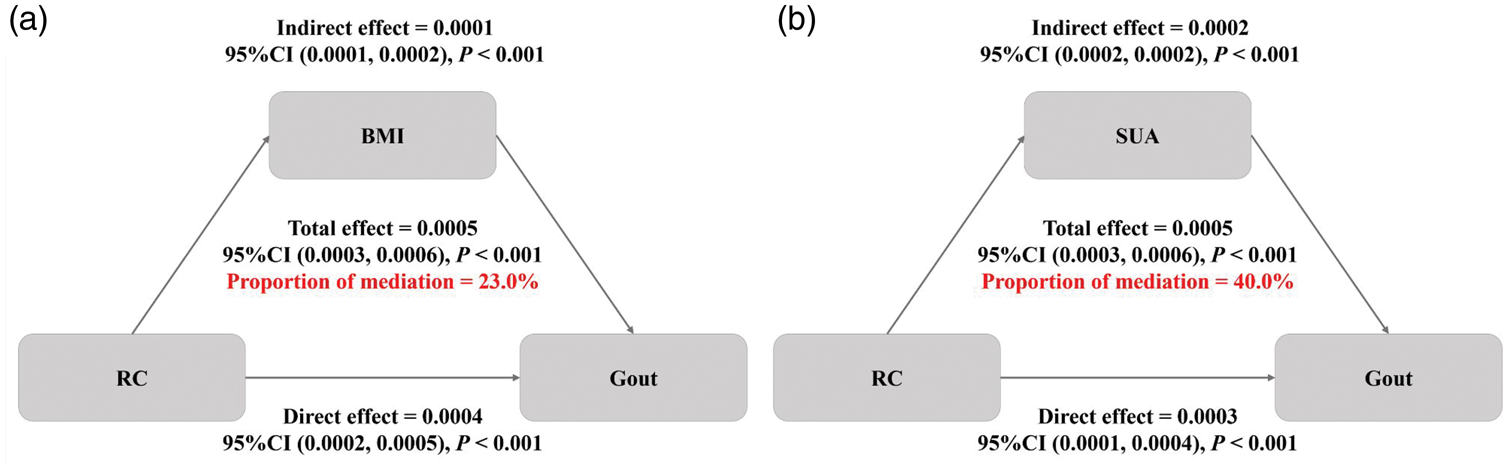
Mediation analysis of the associations between RC levels and gout by (a) BMI and (b) SUA levels.
Discussion
This study employed the NHANES data to assess the link between RC and gout within the adult population of the US. Among the 11,685 participants analyzed, RC levels were significantly and positively associated with gout prevalence, irrespective of whether RC was treated as a continuous or categorical variable. Each 1-unit increase in the RC level corresponded to a higher gout prevalence. RCS analysis confirmed a positive, linear dose–response relationship between the RC level and gout. Interaction testing and subgroup assessments demonstrated that the association was widespread and steady across all subgroups. In addition, mediation analysis suggested that BMI and SUA level played partial mediating roles in the association between RC level and gout. To the best of our knowledge, this study is the first to examine the potential relationship between RC level and gout using a cross-sectional design.
The association between blood lipids and gout has been extensively investigated in previous studies. A cross-sectional study on a French population has reported that lipid metabolism disorders manifest earlier among patients with early-onset gout (EOG). 25 Kvasnička et al. analyzed data from the Prague Institute of Rheumatology and have demonstrated that patients with hyperuricemia (HUA) and gout exhibit significant lipid metabolism abnormalities. 26 An observational study conducted in Sweden has further demonstrated that individuals with lipid abnormalities are at an increased risk of developing gout. 27 In South Korea, Eun et al. have identified a robust association between gout and hypertriglyceridemia in men aged 20–39 years. 28 In an NHANES-based study involving 11,032 US adults, higher TG levels were positively associated with gout, whereas higher HDL-C levels were negatively linked to gout. 29 The conclusions of this study are consistent with the results of previous studies, which have also demonstrated a close association between levels of lipid markers and gout. However, previous studies have mainly focused on traditional blood lipid indicators, whereas the present study is the first to explore the relationship between RC level and gout in a large sample of the general US population.
Lipid alterations in gout patients typically include reduced HDL-C levels and elevated TG, TC, and LDL-C levels. These lipid markers are strongly associated with RC levels.30,31 Yu et al. performed a Mendelian randomization study to investigate the causal relationship between lipid marker levels and gout, revealing that increased TG or decreased HDL levels may influence gout development via SUA pathways. 32 Elevated TG or reduced HDL-C level may induce insulin resistance, which triggers compensatory hyperinsulinemia. This state inhibits renal uric acid excretion, ultimately contributing to HUA and gout.33,34 Additionally, TG and HDL-C levels are crucial in obesity regulation, which elevates the burden of nucleic acid metabolism and further enhances uric acid synthesis and accumulation via the purine metabolic pathway. 35 Elevated RC levels promote the production and utilization of free fatty acids (FFAs), which accelerate the catabolism of adenosine triphosphate (ATP) and increase SUA synthesis, thereby inducing gout. 36 Recent evidence highlights that, unlike traditional lipids, RC directly penetrates the arterial intima, promoting macrophage foam cell formation and exacerbating low-grade systemic inflammation and oxidative stress.37,38 This systemic inflammatory state, combined with FFAs, may synergistically lower the threshold for monosodium urate monohydrate (MSU) crystal–induced apoptosis-associated speck-like protein containing a CARD (ASC)/caspase-1 pathway activation via Toll-like receptor 2 (TLR-2), thereby promoting interleukin-1beta (IL-1β) secretion and triggering the inflammatory response associated with gout. 39 Moreover, elevated RC levels are also related to a decline in estimated glomerular filtration rate (eGFR) and a higher chance of renal dysfunction, potentially reducing uric acid excretion by the kidneys and further exacerbating gout. 40 Consistent with these mechanisms, our mediation analysis revealed that both BMI and SUA level partially mediated the association between RC level and gout, highlighting their intermediary roles in the pathophysiological pathway.
Although previous studies have established a link between RC level and HUA,41,42 only a proportion of HUA patients develop clinical gout. 43 Our findings provide evidence that the mediating effects of BMI and SUA level may partly explain how RC contributes to gout development, and our study extends this association to gout-specific clinical endpoints, suggesting that RC functions not only as a participant in uric acid dysregulation but potentially as a pathogenic driver in gout pathogenesis. These insights underscore the potential benefits of managing BMI and lowering SUA levels as modifiable interventions that may interrupt the pathogenic pathway linking elevated RC to gout, thereby offering novel preventive and therapeutic opportunities.
This study has several notable strengths. First, it is grounded in the NHANES, a comprehensive database with national representativeness. All data were collected through a standardized process, with sample design and weights meticulously accounted for to ensure broad applicability of the results. Second, this study is the first to explore the potential association between RC level and gout, introducing a novel research perspective to this field. Methodologically, we employed multivariate logistic regression and adjusted extensively for confounding factors, enhancing the reliability of our findings. Additionally, the positive linear association between RC level and gout was corroborated using RCS analysis. Finally, subgroup analyses confirmed the robustness of this association across diverse populations, offering valuable theoretical support for the early screening and management of gout. Even though this study has valuable strengths, there are specific limitations that should be acknowledged. First, its cross-sectional nature constrains the capacity to infer a cause-and-effect relationship between RC level and gout. Readers should interpret the clinical significance of the mediating effects with caution, and prospective studies should elucidate potential mechanisms and establish true causal pathways. Second, a large number of participants were excluded due to missing RC data. As detailed in Supplementary Table S1, baseline differences existed between the included and excluded populations, which may affect the generalizability of our findings. Moreover, gout diagnosis relied exclusively on participant-reported data, an approach susceptible to recall bias. This typically leads to nondifferential misclassification, which may dilute the effect on the ORs, biasing the results toward the null and potentially underestimating the true strength of the association. Finally, as this study utilized data from the adult population of the US, the generalizability of its findings to other countries or ethnic groups requires further validation. Hence, caution is advised when extrapolating these findings to broader populations.
Conclusion
This study provides strong evidence in favor of a positive link between higher RC levels and gout prevalence and further elucidates the mediating roles of BMI and SUA in this pathway. Nevertheless, owing to the study’s cross-sectional nature, large-scale prospective studies are required to establish causality and evaluate the clinical utility of RC as a risk marker for gout assessment.
Supplemental Material
sj-pdf-1-imr-10.1177_03000605261455125 - Supplemental material for Association between remnant cholesterol level and gout in US adults
Supplemental material, sj-pdf-1-imr-10.1177_03000605261455125 for Association between remnant cholesterol level and gout in US adults by Yan Xu, Jing Ye and Shuaiqing Chen in Journal of International Medical Research
Footnotes
Acknowledgments
We would like to acknowledge the participants and investigators of the National Health and Nutrition Examination Survey (NHANES).
Author contributions
The study was designed by SC. Data analysis and initial drafting of the manuscript were carried out by YX. The manuscript was revised by JY. All authors have read and approved for the final manuscript.
Availability of data and materials
Consent for publication
Not applicable.
Clinical trial number
Not applicable.
Declaration of conflicting interests
The authors declare no competing interests.
Ethics approval and consent to participate
The studies involving humans were approved by the National Center for Health Statistics Institutional Review Board of the United States. The studies were conducted in accordance with the local legislation and institutional requirements. The participants provided written informed consent to participate in this study.
Funding
This work was supported by the Zhejiang Province Traditional Chinese Medicine Science and Technology Plan Project (project number 2025ZL616). The funding body did not participate in the design of the study, data collection, analysis, interpretation of data or in writing the manuscript.
References
Supplementary Material
Please find the following supplemental material available below.
For Open Access articles published under a Creative Commons License, all supplemental material carries the same license as the article it is associated with.
For non-Open Access articles published, all supplemental material carries a non-exclusive license, and permission requests for re-use of supplemental material or any part of supplemental material shall be sent directly to the copyright owner as specified in the copyright notice associated with the article.