
Abstract
Objective
Inflammation and immunohematological biomarkers are recognized as contributing factors in the progression of solid tumors. This study aimed to develop nomograms incorporating inflammatory and immunohematological biomarkers to predict the prognosis of colorectal cancer.
Methods
We retrospectively enrolled 432 patients with colorectal cancer at Yunnan Cancer Hospital from January 2019 to December 2022. Clinicopathologic data and blood samples were obtained at initial diagnosis before any treatment, and therapy was initiated within 3 days. Patients with prior therapy, secondary cancers, or systemic conditions affecting hematology were excluded. Metastases were confirmed by pathology or imaging, and overall survival and progression-free survival were recorded through follow-up. Multivariate logistic and Cox regression analyses, nomogram construction, and internal validation with 1000-bootstrap resampling were performed using R, with risk groups defined by receiver operating characteristic curve–derived cutoffs.
Results
In the training cohort, the model accuracy for predicting distant metastasis was 66.25%. The concordance index values for the three nomograms were 0.791 (95% confidence interval, 0.745–0.838), 0.752 (95% confidence interval, 0.699–0.806), and 0.687 (95% confidence interval, 0.647–0.726), respectively. Calibration plots showed strong agreement between predicted and observed outcomes, while decision curve analysis indicated potential clinical utility. Subgroup analyses confirmed that the nomograms were effective prognostic indicators across stage I–IV colorectal cancer patients (P < 0.05).
Conclusion
Single or combined hematological indicators are readily obtainable and feasible and possess high prognostic value. Nomograms based on cancer-associated inflammatory factors and immunohematological biomarkers demonstrated robust accuracy in predicting distant metastasis, overall survival, and progression-free survival in patients with colorectal cancer. These tools may assist clinicians in risk stratification and treatment decision-making, ultimately supporting improved oncological outcomes.
Keywords
Introduction
Colorectal cancer (CRC) is the third most common cancer and the second leading cause of cancer-associated deaths globally, and its epidemiology varies markedly across regions, age groups, sexes, and races. 1 Although some countries in Europe and the United States have seen a decrease in CRC incidence, China has witnessed a substantial rise in both incidence and mortality. 2 Xi et al. 3 predicted that the number of new CRC cases worldwide will reach 3.2 million by 2040, driven by population aging and growth. The tumor–node–metastasis (TNM) staging system, which considers tumor volume, depth of infiltration, and regional lymph node metastasis, is commonly used to predict prognosis. However, due to individual patient disparities and tumor heterogeneity, patients with the same TNM stage may have different survival outcomes. Therefore, identifying simple, rapid, and cost-effective prognostic factors for risk stratification is necessary for predicting the biological behavior of CRC and for early determination of prognosis.
With advances in the understanding of tumor microenvironment mechanisms, the systemic inflammatory response has been recognized as an important immunological mechanism involved in cancer cell proliferation, migration, metastasis, and chemotherapy resistance. 4 Several studies have shown that chronic inflammation could inhibit tumor cell apoptosis, increase tumor angiogenesis, and enhance the likelihood of tumor metastasis. Immunoinflammatory cells, which play crucial roles in the tumor microenvironment, are also important in tumor growth, progression, invasion, and metastasis. Peripheral blood parameters that can be routinely measured, such as lymphocyte (LYM), platelets (PLT), systemic immune-inflammation index (neutrophil*platelet-to-lymphocyte ratio, SII), derived neutrophil-to-lymphocyte ratio (dNLR), CD4+ T-helper cells, CD8+ T cells, and other immune-inflammation indexes, have been shown to be reliable predictors and surrogates of cancer-associated immunological inflammation and have progressively been regarded as important prognostic predictors of certain solid tumors.5–9 In CRC, host inflammation is associated with tumor characteristics and disease progression. Persistently progressing cancer can induce tissue inflammation, creating a microenvironment favorable for tumor survival. Elevated systemic inflammatory responses have been linked to poor outcomes independent of tumor stage. 10 The recently emerged concept of cancer immunoediting also suggests that the immune system has a dual role in cancer development. Studies have demonstrated that either CD4+ T-cell or CD8+ T-cell infiltrates in breast cancer tumors participate in the immune response but mediate different clinical roles. Patients with high levels of CD4+ T-cell infiltration have an increased cumulative risk of mortality and recurrence over time, whereas high levels of tumor-infiltrating CD8+ T cells are prognostically beneficial. The ratio of the two, known as the CD4+ T-helper cell-to-CD8+ T-cell ratio (CD4+Th/CD8+T), is a valuable clinical indicator for evaluating the risk of late recurrence and survival in breast cancer. 7 Meanwhile, natural killer (NK) cells can attack tumor cells, and patients with CRC and gastric cancer may benefit from high NK cell levels in controlling tumor progression.11–12 However, some studies suggest that NK cell activity is influenced by tumor burden, with a heavier tumor burden leading to lower NK cell activity and a subsequent rebound of NK cells to destroy tumor cells. 13 This study aimed to develop nomograms incorporating inflammatory and immunohematological biomarkers to predict the prognosis of CRC.
Methods
Sample collection and laboratory analysis
We retrospectively enrolled 432 patients with CRC from January 2019 to December 2022 at Yunnan Cancer Hospital. Inclusion criteria were as follows: (a) CRC confirmed by pathology, imaging, and clinical evaluation, with data reviewed by at least two independent observers; (b) no prior treatment and complete clinical and imaging records; and (c) absence of secondary cancers. Exclusion criteria included the following: (a) systemic diseases affecting hematological parameters; (b) inability or refusal to cooperate with clinical data collection or follow-up; and (c) shortened survival or death due to factors unrelated to the primary tumor.
All laboratory samples were collected at diagnosis, before any therapeutic intervention. Treatment was initiated within 3 days of diagnosis and sample collection, resulting in a short time to treatment initiation (TTI) that is unlikely to influence baseline laboratory measurements or their predictive validity. Metastases were confirmed by pathology or imaging, and overall survival (OS) and progression-free survival (PFS) were documented during follow-up. Survival time was defined as the period from diagnosis to either death or December 2023.
Collected clinicopathologic indicators included sex, age, Karnofsky Performance Status (KPS), body mass index (BMI), smoking history, drinking history, family history, primary tumor site, and pathologic TNM stage, determined according to the American Joint Committee on Cancer (AJCC) 8th edition (2017). The study was conducted and reported in accordance with the STROBE (Strengthening the Reporting of Observational Studies in Epidemiology) guidelines. 14 The Ethics Committee of the Third Affiliated Hospital of Kunming Medical University, Yunnan Cancer Hospital, approved the study on 9 December 2022. The review number was KY LX 2022210.
Statistical analysis
All statistical analyses, including development and validation of nomograms, were performed using R software version 4.3.1 (https://www.r-project.org/). Predictive models were internally validated using the bootstrap method with 1000 resamples, and the concordance index (C-index) was calculated. Calibration curves were generated based on the Hosmer–Lemeshow test. For baseline variables with missing values, multiple imputation was performed using the fully conditional specification discriminant function for categorical variables and fully conditional specification regression for continuous variables. The sample size of 432 patients was deemed adequate for developing and internally validating the 3 prognostic models based on established methodological guidelines. Specifically, the number of outcome events for distant metastasis, OS, and PFS satisfied the recommended events-per-variable ratio, ensuring sufficient statistical power and stability of model estimates. The number of candidate predictors relative to the number of events supports the reliability of the multivariate analyses, and internal validation using 1000-bootstrap resampling further mitigated potential overfitting.
Survival outcomes were estimated using the Kaplan–Meier method and compared using the log-rank test. Variables associated with distant metastasis, OS, and PFS in univariate analyses were subsequently entered into multivariate models. Distant metastasis was defined as tumor spread beyond the primary site, confirmed by pathological examination or imaging modalities, including ultrasound, computed tomography, or magnetic resonance imaging, and included both synchronous and metachronous events. OS was defined as the interval from diagnosis to death from any cause or last follow-up, while PFS was defined as the time from diagnosis to disease progression, recurrence, metastasis, or death. Patients were monitored through scheduled clinical visits or telephone follow-up. Multivariable logistic regression and Cox regression analyses were used to identify independent prognostic factors. Predictors with P < 0.05 in univariate analyses were included in the multivariate regression models. Due to the retrospective design and heterogeneity of clinical management across disease stages, detailed treatment-related variables (e.g. surgical margin status, adjuvant chemotherapy, targeted therapy, and immunotherapy) were not consistently available and were therefore not incorporated into the multivariable analyses. Optimal cutoff values for risk score–based grouping were determined using receiver operating characteristic (ROC) curves, with thresholds selected according to the Youden index and derived exclusively from the training set. Missing data were handled using multiple imputation, with all candidate variables included, and the proportion of missingness was reported. Model stability was ensured by generating multiple imputations and evaluating convergence and plausibility of the imputed datasets. A P-value <0.05 was considered statistically significant. All patient details were de-identified to ensure anonymity.
Results
Clinicopathological characteristics
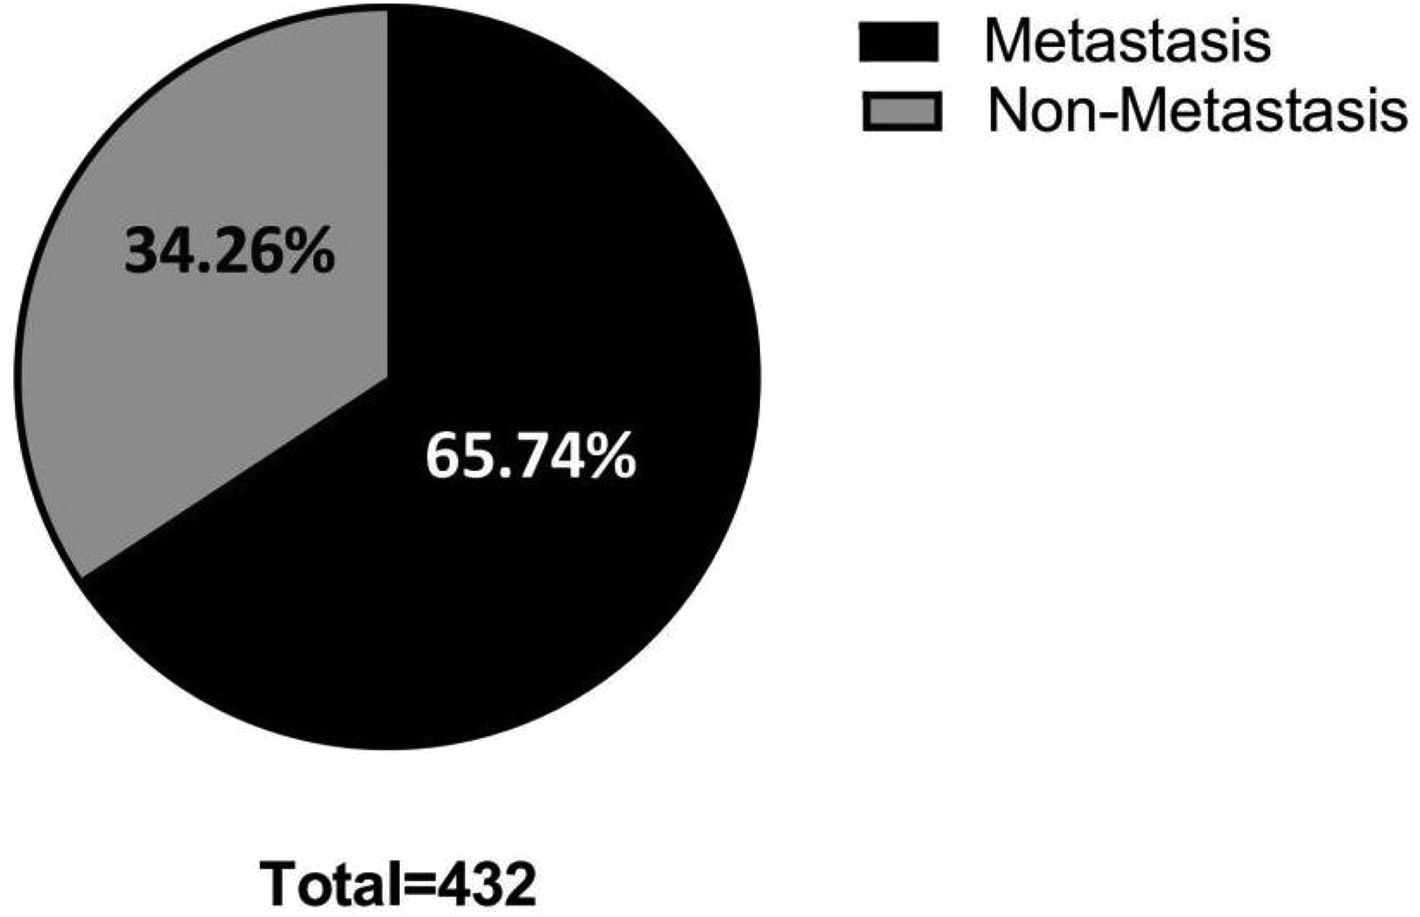
A total of 432 patients with CRC who met all inclusion criteria were enrolled in the study. Their clinical characteristics are summarized in Table 1. The cohort comprised 252 males (58.33%) and 180 females (41.67%), with a median age of 61.25 (range: 23–86) years. More than half of the patients presented with higher KPS (>90; n = 236, 54.63%), a BMI (>18.33; n = 403, 93.29%), and a history of smoking (n = 235, 54.40%) and alcohol consumption (n = 255, 59.03%) at initial diagnosis. Regarding primary tumor location, 106 tumors (24.54%) were detected in the right colon, 93 (21.53%) in the left colon, and 226 (52.31%) in the rectum, while the tumor site remained undetermined in 7 patients (1.62%). The distribution of disease stages I, II, III, and IV was 51 (11.81%), 151 (34.95%), 127 (29.40%), and 103 (23.84%), respectively. Regional lymph node metastasis was identified in 254 patients (58.80%). Among the 432 patients, 102 (23.61%) had synchronous metastases at initial diagnosis. During follow-up, 182 patients (42.13%) who were metastasis-free at baseline developed new metastatic lesions, whereas 148 patients (34.26%) remained free of metastasis throughout the study period (Table 2, Figure 1).
Demographic and clinicopathological characteristics of the study population.

KPS: Karnofsky Performance Status; BMI: body mass index.
Metastatic condition.

Group composition.
Independent prognostic factors for distant metastasis, OS, and PFS
Univariate and multivariate logistic regression analyses demonstrated that the presence of regional lymph node metastasis at initial diagnosis (odds ratio (OR): 9.104, 95% confidence interval (CI): 5.567–14.890), LYM (OR: 1.973, 95% CI: 1.139–3.416), the CD4+/CD8+ T-cell ratio (OR: 1.722, 95% CI: 1.045–2.837), and the proportion of NK cells (NK%) (OR: 2.094, 95% CI: 1.228–3.572) were independent predictors of distant metastasis (all P < 0.05) (Table 3, Figure 2(a)). Interestingly, higher peripheral lymphocyte counts and NK cell percentages were associated with an increased risk of distant metastasis in our cohort. Although these findings appear counterintuitive given the known antitumor roles of these cells, sensitivity analyses confirmed the robustness of the associations. We emphasize that these results should be interpreted cautiously and require validation in independent cohorts and mechanistic studies. Tables 4 and 5 present the univariate and multivariate Cox regression analyses, in which all variables were dichotomized according to predefined cutoff values. Patient characteristics included age (<53.5 vs. ≥53.5 years), KPS (≤90 vs. >90), and BMI (≤18.33 vs. >18.33 kg/m2), together with tumor-related factors such as infiltration depth (below the mucous layer vs. above the mucous layer) and initial regional lymph node metastasis (yes vs. no). Hematological parameters comprised white blood cell count (WBC; <4.75 vs. ≥4.75 × 10⁹/L), LYM (<1.42 vs. ≥1.42 × 10⁹/L), monocytes (MNO; <0.25 vs. ≥0.25 × 10⁹/L), neutrophils (NEUT; <3.06 vs. ≥3.06 × 10⁹/L), and PLT (<224.5 vs. ≥224.5 × 10⁹/L). Inflammatory ratios and indices included the neutrophil-to-WBC ratio (NWR; <3.06 vs. ≥3.06), neutrophil-to-lymphocyte ratio (NLR; <1.08 vs. ≥1.08), lymphocyte-to-monocyte ratio (LMR; ≤3.26 vs. >3.26), platelet-to-lymphocyte ratio (PLR; <92.74 vs. ≥92.74), SII (<435.93 vs. ≥435.93), aggregate index of systemic inflammation (AISI; <474.39 vs. ≥474.39), dNLR (<0.62 vs. ≥0.62), monocyte-to-lymphocyte ratio (MLR; ≤0.46 vs. >0.46), neutrophil-to-(lymphocyte × platelet) ratio (NLPR; <110.67 vs. ≥110.67), and systemic inflammation response index (SIRI; <1.95 vs. ≥1.95). Nutritional and composite indices included albumin (ALB; ≤41.5 vs. >41.5 g/L), prognostic nutritional index (PNI; ≤51.53 vs. >51.53), and advanced lung cancer inflammation index (ALI; ≤171.38 vs. >171.38). Immune cell subsets were defined as CD45+T/CD3+T-cell ratio (≤87.55% vs. >87.55%), CD3+T/CD4+ T-helper (Th) cell ratio (≤26.95% vs. >26.95%), CD3+T/CD8+ T suppressor (Ts) cell ratio (≤8.0% vs. >8.0%), CD4+Th/CD8+T ratio (<1.36 vs. ≥1.36), NK cells (<13.55% vs. ≥13.55%), and cytokine-induced killer (CIK) cells (<7.1% vs. ≥7.1%). Cytokine levels included interleukin (IL)-10 (<12.15 vs. ≥12.15 pg/mL), IL-6 (<13.35 vs. ≥13.35 pg/mL), IL-4 (<30.15 vs. ≥30.15 pg/mL), and IL-2 (<22.25 vs. ≥22.25 pg/mL). Univariate and multivariate Cox regression analyses identified three and four independent prognostic factors for OS and PFS, respectively. TNM stage (hazard ratio (HR): 6.905, 95% CI: 4.554–10.472), PLT (HR: 2.616, 95% CI: 1.498–4.569), and AISI (HR: 0.486, 95% CI: 0.280–0.844) were independently associated with OS. For PFS, TNM stage (HR: 3.949, 95% CI: 2.875–5.424), PLT (HR: 1.528, 95% CI: 1.087–2.147), SII (HR: 1.515, 95% CI: 1.087–2.114), and dNLR (HR: 1.453, 95% CI: 1.082–1.951) were identified as independent risk factors (all P < 0.05) (Tables 4 and 5, Figure 2(b) and 2(c)).
Univariate and multivariate logistic regression analysis of prognostic factors for predicting distant metastasis.

OR: odds ratio; CI: confidence interval; KPS: Karnofsky score; BMI: body mass index; LNs: lymph nodes; WBC: white blood cells; LYM: lymphocytes; MNO: monocytes; NEUT: neutrophils; PLT: platelets; NWR: neutrophil-to-white blood cell ratio; NLR: neutrophil-to-lymphocyte ratio; LMR: lymphocyte-to-monocyte ratio; PLR: platelet-to-lymphocyte ratio; SII: systemic immune-inflammation index; AISI: aggregate systemic inflammation index; dNLR: derived neutrophil-to-lymphocyte ratio; MLR: monocyte-to-lymphocyte ratio; NLPR: neutrophil-to-(lymphocyte × platelet) ratio; SIRI: systemic inflammation response index; ALB: albumin; PNI: prognostic nutritional index; ALI: advanced lung cancer inflammation index; CD45+T/CD3+T: CD45+T/CD3+T ratio; CD3+T/CD4+Th: CD3+T/CD4+Th ratio; CD3+T/CD8+Ts: CD3+T/CD8+Ts ratio; CD4+Th/CD8+T: CD4+Th/CD8+T ratio; NK: natural killer cells; CIK: cytokine-induced killer cells; IL-10: interleukin-10; IL-6: interleukin-6; IL-4: interleukin-4; IL-2: interleukin-2.

Multivariate forest map (a) for distant metastasis, (b) OS, and (c) PFS. AISI acts as a protective factor for OS, consistent with the regression analysis. AISI: aggregate index of systemic inflammation; OS: overall survival; PFS: progression-free survival.
Univariate and multivariate Cox regression analysis of prognostic factors for OS.

HR: hazard ratio; CI: confidence interval; KPS: Karnofsky Performance Status; BMI: body mass index; TNM: tumor–node–metastasis stage; WBC: white blood cells; LYM: lymphocytes; MNO: monocytes; NEUT: neutrophils; PLT: platelets; NWR: neutrophil-to-white blood cell ratio; NLR: neutrophil-to-lymphocyte ratio; LMR: lymphocyte-to-monocyte ratio; PLR: platelet-to-lymphocyte ratio; SII: systemic immune-inflammation index; AISI: aggregate index of systemic inflammation; dNLR: derived neutrophil-to-lymphocyte ratio; MLR: monocyte-to-lymphocyte ratio; NLPR: neutrophil-to-(lymphocyte × platelet) ratio; SIRI: systemic inflammation response index; ALB: albumin; PNI: prognostic nutritional index; ALI: advanced lung cancer inflammation index; CD45+T/CD3+T: CD45+ to CD3+ T-cell ratio; CD3+T/CD4+Th: CD3+ to CD4+ T-helper cell ratio; CD3+T/CD8+Ts: CD3+ to CD8+ T suppressor cell ratio; CD4+Th/CD8+T: CD4+ T-helper to CD8+ T-cell ratio; NK: natural killer cells; CIK: cytokine-induced killer cells; IL-10: interleukin-10; IL-6: interleukin-6; IL-4: interleukin-4; IL-2: interleukin-2.
Univariate and multivariate Cox regression analysis of prognostic factors for PFS.

HR: hazard ratio; CI: confidence interval; KPS: Karnofsky Performance Status; BMI: body mass index; TNM: tumor–node–metastasis; WBC: white blood cells; LYM: lymphocytes; MNO: monocytes; NEUT: neutrophils; PLT: platelets; NWR: neutrophil/WBC ratio; NLR: neutrophil/lymphocyte ratio; LMR: lymphocyte/monocyte ratio; PLR: platelet/lymphocyte ratio; SII: systemic immune-inflammation index; AISI: aggregate systemic inflammation index; dNLR: derived neutrophil/lymphocyte ratio; MLR: monocyte/lymphocyte ratio; NLPR: neutrophil/(lymphocyte × platelet) ratio; SIRI: systemic inflammation response index; ALB: albumin; PNI: prognostic nutritional index; ALI: advanced lung cancer inflammation index; CD45+T/CD3+T: CD45+/CD3+ T-cell ratio; CD3+T/CD4+Th: CD3+/CD4+ T-helper ratio; CD3+T/CD8+Ts: CD3+/CD8+ T suppressor ratio; CD4+Th/CD8+T: CD4+/CD8+ T-cell ratio; NK: natural killer cells; CIK: cytokine-induced killer cells; IL-10: interleukin-10; IL-6: interleukin-6; IL-4: interleukin-4; IL-2: interleukin-2.
Prognostic nomograms for distant metastasis, OS, and PFS
Nomograms for predicting the probability of distant metastasis, OS, and PFS in CRC patients are presented in Figures 3(a), 4(a), and 5(a). These models were constructed based on the independent risk factors identified in the multivariate analyses. Among the variables included, the presence of regional lymph node metastasis at initial diagnosis, LYM ≥1.42 (×109/L), CD4+/CD8+ T-cell ratio ≥1.36, and NK cell percentage ≥13.55% were assigned higher scores for predicting distant metastasis. Furthermore, TNM stage ≥ IV, PLT ≥224.5, AISI <474.39, SII ≥435.93, and dNLR ≥0.62 were associated with poorer OS and PFS. The point allocation for each independent risk factor is detailed in Tables 6, 7, and 8. For example, in the metastasis nomogram, regional lymph node metastasis at diagnosis was assigned 100 points, while LYM, CD4+/CD8+ T-cell ratio, and NK cell percentage were assigned 29, 26, and 33 points, respectively, yielding a total possible score ranging from 0 to 188. Similarly, in the OS and PFS nomograms, TNM stage contributed 100 points in both models. PLT accounted for 47 points (OS) and 30 points (PFS), while AISI, SII, and dNLR contributed 33, 30, and 26 points, respectively. The total scores ranged from 0 to 180 for OS and 0 to 186 for PFS. Based on optimal cutoff values, patients were subsequently stratified into low- and high-risk groups.

Development and performance of the nomogram for predicting distant metastasis. (a) Nomogram for predicting the probability. (b) ROC curves of the nomogram. (c) Calibration plots of the nomogram. (d) DCA of the nomogram. (e) NIR of the nomogram. ROC: receiver operating characteristic; DCA: decision curve analysis; NIR: net improvement rate.

Development and performance of the nomogram for predicting OS. (a) Nomogram for predicting the probability. (b) ROC curves of the nomogram. (c) Time-AUC and C-index of the nomogram. (d) Calibration plots of the nomogram. (e) DCA of the nomogram. AISI acts as a protective factor for OS, consistent with the regression analysis. OS: overall survival; ROC: receiver operating characteristic; AUC: area under the curve; C-index: concordance index; DCA: decision curve analysis; AISI: aggregate index of systemic inflammation.

Development and performance of the nomogram for predicting PFS. (a) Nomogram for predicting the probability. (b) ROC curves of the nomogram. (c) Time-AUC and C-index of the nomogram. (d) Calibration plots of the nomogram. (e) DCA of the nomogram. AISI acts as a protective factor for OS, consistent with the regression analysis. PFS: progression-free survival; ROC: receiver operating characteristic; AUC: area under the curve; C-index: concordance index; DCA: decision curve analysis; AISI: aggregate index of systemic inflammation.
Point assignment and prognostic score of the nomogram for distant metastasis.

LYM: lymphocyte; CD: cluster of differentiation; CD4+Th/CD8+T: CD4+ T-helper cell-to-CD8+ T-cell ratio; NK: natural killer.
Point assignment and prognostic score of the nomogram for OS.

OS: overall survival; TNM: TNM: tumor–node–metastasis; PLT: platelets; AISI: aggregate index of systemic inflammation.
Point assignment and prognostic score of the nomogram for PFS.

TNM: tumor–node–metastasis; PLT: platelets; SII: systemic immune-inflammation index; dNLR: derived neutrophil-to-lymphocyte ratio.
Performance of the nomogram in predicting distant metastasis, OS, and PFS
Internal validation was performed using bootstrapping with 1000 replications. The area under the curve (AUC) for predicting distant metastasis was 0.791 (95% CI: 0.745–0.838). The model demonstrated good discriminative ability, with an apparent C-index of 0.785 and a bootstrap-corrected C-index of 0.791. Calibration analysis further showed strong agreement between predicted and observed outcomes, supported by a Brier score of 0.164 (Figure 3(b) and 3(c)), indicating minimal prediction error and good model accuracy. Decision curve analysis (DCA), performed across a range of threshold probabilities, demonstrated the clinical utility of the model by quantifying the net benefit of risk stratification (Figure 2(d)). The results showed a consistent improvement in clinical benefit over a wide range of threshold values. In addition, a clinical impact curve derived from the DCA provided a visual representation of the model’s practical performance. The “number of high-risk patients” curve closely paralleled the “number of high-risk patients with events” curve at threshold probabilities between 0.38 and 1.0, suggesting excellent predictive performance of the model (Figure 3(e)). The time-dependent ROC analysis showed that the AUCs for predicting OS at 12, 24, 36, and 48 months were 0.733 (95% CI: 0.603–0.864), 0.789 (95% CI: 0.707–0.871), 0.797 (95% CI: 0.735–0.860), and 0.750 (95% CI: 0.681–0.818), respectively (Figure 4(b)). Bootstrap validation yielded a corrected C-index of 0.752 (95% CI: 0.699–0.806) (Figure 4(c)). Calibration curves demonstrated good agreement between predicted and observed OS probabilities at all time points (Figure 4(d)). Moreover, DCA showed that the net benefit at each time point exceeded the reference lines, indicating that patients could benefit from the model across a range of high-risk thresholds (Figure 4(e)). Similar results were observed for the PFS nomogram. The AUCs for predicting PFS at 12, 24, 36, and 48 months were 0.720 (95% CI: 0.656–0.785), 0.742 (95% CI: 0.690–0.794), 0.747 (95% CI: 0.695–0.800), and 0.725 (95% CI: 0.660–0.789), respectively (Figure 5(b)). The bootstrap-corrected C-index was 0.687 (95% CI: 0.647–0.726) (Figure 5(c)). Consistently, DCA curves for all time points were above the reference lines, further supporting the clinical utility of the model at higher risk thresholds (Figure 5(e)).
Evaluation of the discriminative performance of the nomogram in predicting the probabilities of distant metastasis, OS, and PFS
The discriminative performance of the nomograms was further evaluated using Kaplan–Meier (KM) curves stratified by optimal cutoff values derived from the models. Patients with CRC were categorized into low- and high-risk groups for metastasis based on the total nomogram scores. Comparison of survival outcomes between these groups showed that both OS and PFS were significantly worse in the high-risk group (mean OS: 53.53 vs 47.56 months; median PFS: 27 vs 58 months; both P < 0.001) (Figure 6). In addition, the incidence of distant metastasis was markedly higher in the high-risk group compared with the low-risk group (85.05% vs 39.22%, P < 0.001). For OS and PFS prediction, patients were similarly stratified into low- and high-risk subgroups using the nomograms. The high-risk group consistently showed poorer survival outcomes, with 12-, 24-, 36-, and 48-month OS rates of 84.76%, 68.10%, 46.51%, and 31.14%, respectively, compared with 97.75%, 94.75%, 89.50%, and 83.97% in the low-risk group (all P < 0.001). The mean OS time was also significantly shorter in the high-risk group (34.66 vs 53.95 months, P < 0.001) (Figure 7(a)). Similarly, the high-risk group demonstrated lower PFS rates at 12, 24, 36, and 48 months (58.36%, 37.96%, 27.83%, and 20.09%, respectively) compared with the low-risk group (86.46%, 76.55%, 69.90%, and 63.37%; all P < 0.001). The mean PFS time was significantly reduced in the high-risk group (23.41 vs 44.46 months, P < 0.001) (Figure 7(b)). Further stratified analyses according to TNM stage (Figures 8 and 9) demonstrated that the nomogram-based risk classification effectively distinguished survival outcomes within each stage, with significant differences observed in KM curves across all subgroups (all P < 0.001). Overall, these findings support the strong discriminatory ability of the proposed stratification approach.

Survival analysis of low-/high-risk metastatic group (a) for OS and (b) PFS.

Survival analysis of low-/high-risk group (a) for OS and (b) PFS.

KM curves of OS in risk group stratification within each TNM stage. (a) KM curve in stage I. (b) KM curve in stage II. (c) KM curve in stage III. (d) KM curve in stage IV. OS: overall survival; KM: Kaplan–Meier.

KM curves of PFS in risk group stratification within each TNM stage. (a) KM curve in stage I. (b) KM curve in stage II. (c) KM curve in stage III. (d) KM curve in stage IV. PFS: progression-free survival; KM: Kaplan–Meier; TNM: tumor–node–metastasis.
Discussion
Invasion and metastasis are defining features of cancer and represent major causes of treatment failure and cancer-related mortality. Increasing evidence has demonstrated a strong association between chronic inflammation and tumor development. Histologically, advanced tumors are often characterized by substantial infiltration of inflammatory cells at the invasive front of malignant cells. Chronic inflammation exerts a dual role in tumor progression. On the one hand, its persistent presence can disrupt the cellular microenvironment and impair immune regulation, leading to aberrant post-translational modifications of proteins that facilitate malignant transformation. On the other hand, activation of oncogenic pathways within tumor tissues can further amplify the inflammatory milieu, creating a self-perpetuating cycle. Inflammation is now recognized as the seventh hallmark of cancer and is estimated to contribute to approximately 25% of newly diagnosed cancer cases worldwide.15–16 Delprat et al. 17 demonstrated that chronic inflammation can induce genetic alterations in tumor cells, thereby promoting invasion and metastasis at early stages of tumorigenesis. These findings suggest that the risk of metastasis may be assessable even in the early phases of cancer development. LYM and NK cells both play critical roles in the host immune response and contribute to antitumor activity by enhancing the function of effector immune cells. Therefore, changes in their levels may reflect the overall status of the immune response.11,18 Although higher counts of LYM and NK cells in peripheral blood are generally considered favorable prognostic indicators, patient outcomes are also influenced by immune cell functionality and their degree of infiltration into tumor tissue. As tumor progression occurs, immune cell activity may decline, resulting in an apparent increase in circulating immune cell counts but reduced infiltration into the tumor microenvironment. Consequently, a rebound elevation of LYM and NK cells in peripheral blood may indirectly indicate an increased tumor burden. 13 PLT also represent an important prognostic factor. When activated, PLT contribute to the formation of a procoagulant microenvironment that facilitates tumor cell evasion from immune surveillance. In addition, PLT can suppress immune responses and promote epithelial–mesenchymal transition through aggregation, degranulation, and the release of various cytokines, ultimately contributing to chemoresistance.19–20 NEUT, the most abundant leukocytes in human blood, serve as a major indicator of inflammation. Studies have shown that activated NEUT can promote cancer cell proliferation and create a tumor-supportive microenvironment by releasing cytokines such as tumor necrosis factor and IL-1, as well as chemokines and matrix metalloproteinase-9, which inhibit the antitumor effects of activated T cells and NK cells. Moreover, tumors can produce myeloid growth factors, including granulocyte colony-stimulating factor and tumor necrosis factor-α, which directly stimulate NEUT expansion. Consequently, increased NEUT levels in tumor tissues are generally considered a poor prognostic indicator of inflammation.21–22
Several cell-based inflammatory indices derived from NEUT, PLT, and LYM, such as the SII, dNLR, and AISI, have also been shown to be elevated across various cancers and associated with poor prognosis.23–27 However, it has been suggested that acute inflammation may, under certain conditions of intensity and duration, inhibit cancer progression and act as a protective factor. In this study, the potential coexistence of acute and chronic inflammation in some patients could not be excluded, which may have introduced bias into the results. 28 The role of immune cells in cancer has become increasingly recognized, particularly the functions of CD4+ T cells and CD8+ T cells. A study on breast cancer progression demonstrated that CD8+ T cells are primarily involved in tumor immunosurveillance and antitumor responses during the early stages of disease. As the tumor progresses, however, CD4+ Th cells infiltrate the tumor more rapidly, becoming the dominant population in later stages. This shift results in an elevated CD4+ Th/CD8+ T-cell ratio, which serves as a reliable predictor of prognosis. Maintaining a balanced ratio between these two cell types within the tumor microenvironment is associated with favorable outcomes. 7 Consistently, in our study, the peripheral blood CD4+ Th/CD8+ T-cell ratio was predictive of prognosis in CRC patients, with higher ratios correlating with faster development of distant metastasis. In addition, univariate and multivariate regression analyses identified several other independent prognostic risk factors in CRC. Based on these findings, nomograms were constructed that integrated peripheral blood inflammatory and immune indices along with TNM stage to predict patient outcomes. Calibration plots demonstrated strong agreement between predicted and observed survival rates, while DCA indicated the models’ potential clinical utility. Patients were further stratified into low- and high-risk subgroups using the three nomograms to evaluate their discriminative performance. Significant differences in survival outcomes were observed between the subgroups, with the high-risk group exhibiting shorter OS and PFS. Notably, even among patients within the same TNM stage, high-risk individuals experienced poorer survival, underscoring the reliability of the nomograms in prognostic prediction. These models may serve as valuable tools to assist clinicians in tailoring individualized treatment strategies for CRC patients. Although the models demonstrated acceptable discrimination, particularly for distant metastasis and OS, their relatively modest performance for PFS may reflect the greater heterogeneity and complexity of progression events. Therefore, the clinical utility suggested by DCA within specific threshold ranges should be interpreted cautiously, and further prospective validation is required before clinical implementation. However, as a retrospective, single-center study, several limitations should be acknowledged. First, selection bias is inherent in retrospective designs, and future research should aim to mitigate this by enrolling larger patient cohorts across multiple centers and conducting prospective studies. In addition, treatment-related variables were not incorporated into the multivariable models. Given the heterogeneity of therapeutic strategies across TNM stages, including surgical quality, adjuvant chemotherapy, and systemic therapies for advanced disease, the absence of these factors may introduce residual confounding and potential omitted variable bias. Consequently, the observed associations between inflammatory biomarkers and survival outcomes should be interpreted with caution, as these markers may partially reflect treatment selection or tolerance rather than purely independent prognostic effects. In addition, all baseline measurements were obtained at the time of initial diagnosis prior to treatment initiation, with a short TTI (<3 days). While this approach minimizes the influence of tumor progression and treatment-related changes on inflammatory and immunological biomarkers, it may limit the generalizability of our findings to clinical settings with longer TTIs. In healthcare systems where delays between diagnosis and treatment initiation are more prolonged, dynamic changes in tumor biology and systemic inflammation may alter baseline biomarker levels, potentially affecting the stability and predictive performance of the model. Therefore, caution is warranted when extrapolating these findings to such settings, and external validation in multicenter cohorts with heterogeneous treatment timelines is needed. In addition, model recalibration may be required prior to clinical implementation in different healthcare contexts. Furthermore, although internal validation was performed using bootstrap resampling, no external validation cohort was included, which may limit the generalizability and clinical applicability of the models; therefore, independent external validation is required before routine clinical use. Additionally, the nomograms developed in this study were based on readily available clinicopathological factors, and incorporating more specific molecular or immunological markers may further improve predictive accuracy for tumor recurrence and patient survival. Interestingly, we observed that higher peripheral LYM counts and NK cell percentages were associated with an increased risk of distant metastasis, a finding that appears counterintuitive given their established antitumor functions. This paradox may reflect complex immune–tumor interactions or compensatory changes in peripheral blood and highlights the need for cautious interpretation and validation in independent cohorts and mechanistic studies.
Conclusion
In summary, the nomograms constructed based on cancer-associated inflammatory factors and immunological hematological indicators demonstrated good accuracy in predicting the prognosis of CRC patients, including distant metastasis, OS, and PFS. These indicators are readily accessible, cost-effective, and widely used in clinical practice, providing a valuable supplement to TNM staging. They may help clinicians anticipate the biological behavior of CRC, make informed prognostic evaluations, and support therapeutic decision-making, ultimately contributing to improved oncological outcomes. Nevertheless, this study has limitations inherent to its single-center, retrospective design, which may introduce selection bias and limit the generalizability of the findings. Future research should include prospective, multicenter validation to confirm the clinical utility and robustness of these nomograms. Additionally, integrating molecular markers could further enhance predictive accuracy and enable a more comprehensive assessment of patient prognosis.
Footnotes
Acknowledgments
The authors would like to thank the corresponding author for her suggestions on the design of the present study.
Authors’ contributions
Jiadai Tang contributed to the conception of the present study and completed the draft of the manuscript. All authors participated in the design of the study and conducted the research. Mengying Xiang, Guangrui Xiong, and Liuhan Chen processed and analyzed the dataset. Yedan Liao, Rong Li, Xin Shen, Yanping Lin, and Ke Zhang were responsible for clinical data collection. Lin Xie contributed to the experimental design and was responsible for revising the manuscript and approving the version to be published. All authors reviewed all the data and approved the final version of the manuscript.
Availability of data and materials
The datasets used and/or analyzed during the current study are available from the corresponding author on reasonable request.
Declaration of competing interest
The authors declare that they have no competing interests.
Ethics approval and consent to participate
Informed consent was obtained from all participants involved in the study. The present study was conducted in accordance with the Declaration of Helsinki as revised in 2024. The Ethics Committee of the Third Affiliated Hospital of Kunming Medical University, Yunnan Cancer Hospital, approved the study on 9 December 2022. The review number is KY LX 2022210.
Funding
This work was supported by the Yunnan Province Xing Dian Talent Programme (XDYC-MY-2022-0011), Yunnan Fundamental Research Projects (202501AT070135), the Joint Special Project of Applied Basic Research of Yunnan Provincial Science and Technology Department and Kunming Medical University (202501AY070001-171), Yunnan Provincial Department of Education Scientific Research Fund Project (2026J0279), and the Kunming Medical University Postgraduate Innovation Fund (2025B032).”
Patient consent for publication
Not applicable.