
Abstract
Objective
Cataracts represent the predominant cause of global blindness. Although previous research has implicated aqueous humor uric acid in cataract pathogenesis, its invasive measurement method limits clinical utility. Consequently, the association between readily accessible serum uric acid levels and cataract risk remains poorly defined. This study aimed to elucidate this relationship in two large, independent populations.
Methods
This cross-sectional analysis utilized data from 11,473 participants in the China Health and Retirement Longitudinal Study (CHARLS, 2011) and 9754 participants from the National Health and Nutrition Examination Survey (NHANES, 1999–2008). Cataract status was defined by self-reported history of cataract surgery. Multivariable logistic regression analysis was employed to calculate odds ratios, using restricted cubic splines and subgroup analyses used to assess dose–response relationships and the robustness of associations.
Results
In both cohorts, significant crude associations between higher serum uric acid and cataract prevalence were observed (CHARLS, odds ratio: 1.14, 95% confidence interval: 1.03–1.25; NHANES, odds ratio per SD: 1.23, 95% confidence interval: 1.16–1.30). However, these associations were no longer statistically significant after full adjustment for demographic, socioeconomic, and cardiometabolic covariates (CHARLS, odds ratio: 1.09, 95% confidence interval: 0.98–1.22; NHANES, odds ratio per SD: 1.05, 95% confidence interval: 0.98–1.12). Restricted cubic spline analyses confirmed no significant linear or nonlinear dose–response relationship (all p > 0.05). Subgroup analyses consistently demonstrated a null association across key demographic and clinical strata.
Conclusions
This large-scale, two-country study suggests that the apparent association between serum uric acid and cataracts is not independent; it may be largely explained by confounding factors such as age, cardiometabolic diseases, and socioeconomic factors. Serum uric acid levels may not be independently associated with self-reported cataract surgery status and may have limited utility as a marker for risk assessment in population-based settings.
Keywords
Introduction
Cataract, a pathological condition characterized by the opacification of the ocular lens, constitutes a principal cause of visual impairment and blindness in the aging global population. 1 Notably, among individuals aged ≥60 years, the prevalence is substantially higher, and it affects an estimated 53%–58% of this demographic. 2 Accumulating evidence implicates aqueous humor uric acid in the pathogenesis of cataracts.3–7 However, the clinical utility of aqueous humor measurement is limited by its invasiveness and the difficulty of collection. Consequently, the association between readily accessible serum uric acid levels and cataract risk remains poorly defined. Clarification of this relationship could have clinical relevance, potentially contributing to risk assessment and improving our understanding of systemic factors in cataract development.
Toxic free radicals, generated as by-products of normal cellular metabolism, induce chronic oxidative stress. 8 This oxidative stress can subsequently trigger senescence or apoptosis of lens epithelial cells, a process implicated in cataract pathogenesis. 9 Uric acid is a recognized marker for oxidative stress and exhibits a complex physiological role. 10 Hyperuricemia is a known cause of gout and is associated with an elevated risk of conditions such as diabetes, cardiovascular diseases, and chronic kidney disease.11–14 In contrast, at physiological concentrations, uric acid functions as a key antioxidant in the blood,15–17 and its role in systemic redox balance may influence cataract development.
Epidemiological evidence suggests a link between uric acid levels and cataract risk. Specifically, long-term hyperuricemia has been associated with a higher prevalence of cortical cataract, posterior subcapsular cataract (PSC), 5 and mixed cataracts. Furthermore, elevated uric acid levels in the aqueous humor have been correlated with PSC in human studies. 4 A primary limitation of these existing investigations is their relatively small sample sizes. Consequently, evidence from large-scale, cross-sectional studies examining the association between serum uric acid level and cataract risk is lacking. This study therefore aimed to utilize data from the China Health and Retirement Longitudinal Study (CHARLS) and National Health and Nutrition Examination Survey (NHANES) to investigate the association between serum uric acid level and cataract risk in Chinese and American populations.
Materials and methods
Data source and study population
The NHANES and CHARLS are two large-scale, nationally representative surveys that provide data on the health of noninstitutionalized populations in the United States and China, respectively. The NHANES, conducted by the National Center for Health Statistics (NCHS), releases data in 2-year cycles. The CHARLS, led by Peking University, focuses on individuals aged ≥45 years and releases data periodically. To ensure robust sample sizes, the present study integrated cataract status data from five consecutive NHANES cycles (1999–2008) and the data released by the CHARLS in 2011. This retrospective study utilized publicly available data from the NHANES in the United States and the CHARLS in China. Both these original studies were conducted strictly in accordance with the principles of the Helsinki Declaration (adopted in 1975 and revised in 2013). The NHANES protocol has been approved by the Research Ethics Review Committee of the NCHS, and the CHARLS protocol has been approved by the Biomedical Ethics Committee of Peking University. All participants in the original surveys provided written informed consent. For this secondary analysis, all patient information was de-identified and anonymized before the interviews. As the data used were publicly available and de-identified, no additional ethical approval was required. This study did not access or use any personal identification information, ensuring adequate protection of participant privacy.
Cataract assessment
Cataract status was defined based on a self-reported history of cataract surgery—a validated proxy commonly used in epidemiological research. In the NHANES, it was ascertained using the survey items VIQ070 (1999–2002) and VIQ071 (2005–2008), which asked participants whether they had ever undergone cataract surgery (response: yes/no). An affirmative response was classified as indicative of cataract presence. Similarly, in the CHARLS, cataract status was defined analogously using a positive response to the corresponding question (variable code: da035).
Definition of serum uric acid
The CHARLS cohort. Plasma uric acid levels were measured using 4 mL of whole blood samples. The samples were centrifuged to separate the plasma, which was subsequently aliquoted and stored at −20°C temporarily before long-term storage at −80°C at the Chinese Center for Disease Control and Prevention. The analysis was ultimately performed at the You’anmen Clinical Laboratory Center of Capital Medical University.
The NHANES cohort. In contrast, in the NHANES, uric acid measurement was performed using serum specimens. The collection, processing, storage, and transportation of these specimens to the analysis laboratory were conducted in strict accordance with the detailed protocols outlined in the NHANES Laboratory/Medical Technologists Procedures Manual (LPM). The entire process adhered to rigorous quality assurance and quality control (QA/QC) protocols, consistent with the requirements of the Clinical Laboratory Improvement Amendments (CLIA) of 1988.
Assessment of covariates
In the analysis using the CHARLS dataset, covariates were selected a priori based on established associations with both serum uric acid level and cataract risk. These included demographic and socioeconomic factors such as age (continuous), sex, educational level (10 categories), and birthplace/residence (5 categories); marital status (6 categories); lifestyle factors, including smoking status and alcohol consumption (3 levels); and clinical comorbidities comprising hypertension, diabetes, and dyslipidemia (response for all: yes/no). In the NHANES analysis, a comparable set of covariates was included to ensure consistency across cohorts. Demographic covariates consisted of age (continuous), sex, race/ethnicity (5 categories), educational level (5 categories), and marital status (6 categories, including a specific category for living with a partner). Comorbidity covariates were defined similarly to that in the CHARLS analysis and included hypertension, diabetes, and dyslipidemia (all response: yes/no).
Statistical analyses
Statistical analyses were performed using R software (version 4.3.2; R Foundation for Statistical Computing, Vienna, Austria). We used the CBCgrps library to evaluate the differences between participants with and without cataract. 18 Continuous variables were described using median and interquartile range (IQR), while categorical variables were presented as numbers and percentages. Intergroup comparisons between participants with and without cataracts were performed using unpaired t-tests or Wilcoxon rank-sum tests for continuous variables and Pearson's chi-square or Fisher's exact tests for categorical variables, as appropriate based on data distribution and sample size. To assess the primary association, we employed multivariable logistic regression to calculate odds ratios (ORs) for the risk of cataract per unit increase in serum uric acid level. The potential nonlinearity of this relationship was examined using restricted cubic spline (RCS) regression. Furthermore, subgroup analyses were conducted to evaluate the robustness of the primary findings across different population strata. A two-sided p value <0.05 was defined as the threshold for statistical significance. For both cohorts, complex survey weights, stratification, and clustering variables were not incorporated in the regression analyses. Therefore, the two cohorts were analyzed using an unweighted logistic regression model, which may have affected the precision of estimates and their generalizability to the broader population. Throughout the writing of this manuscript, the artificial intelligence tool “DeepSeek” was used solely for refining the language. This study report adheres to the Strengthening the Reporting of Observational Studies in Epidemiology (STROBE) guidelines. 19
Results
Comparative analysis of baseline characteristics between participants with and without cataract
This cross-sectional analysis included 11,473 participants from the CHARLS, among whom 222 (1.9%) were identified as cataract cases, and 9754 participants from the NHANES (1999–2008), which included 1400 (14.4%) cataract cases. A consistent pattern of associations with cataract status was observed across both cohorts. Participants with cataracts were significantly older in both CHARLS (median age: 68 vs. 58 years; p < 0.001) and NHANES (median age: 78 vs. 58 years; p < 0.001) datasets. Furthermore, the cataract group had a higher proportion of women in both CHARLS (61% vs. 53%; p = 0.049) and NHANES (53.1% vs. 50.2%; p = 0.043) datasets. Lower educational level was also strongly associated with cataract risk in both analyses (both p < 0.001). Clinically, cataracts were strongly associated with a higher prevalence of hypertension and diabetes in both cohorts (all p < 0.01). Cohort-specific differences were noted. In the CHARLS population, cases were more likely to be widowed (18% vs. 10%; p = 0.004), to report less frequent alcohol consumption (p = 0.024), and to have been born outside their current village or neighborhood (p < 0.001). In the NHANES population, cataracts were more prevalent among nonHispanic White individuals (70.6% vs. 52.6%; p < 0.001) and those who were widowed (37.1% vs. 11.3%; p < 0.001), while the proportion of married individuals was lower (49.9% vs. 59.8%; p < 0.001). A significant difference of cataract with dyslipidemia was observed only in the NHANES cohort (67.9% vs. 65.1%; p = 0.040). Detailed results are presented in Tables 1 and 2.
Demographic and clinical characteristics of the study population in the CHARLS.
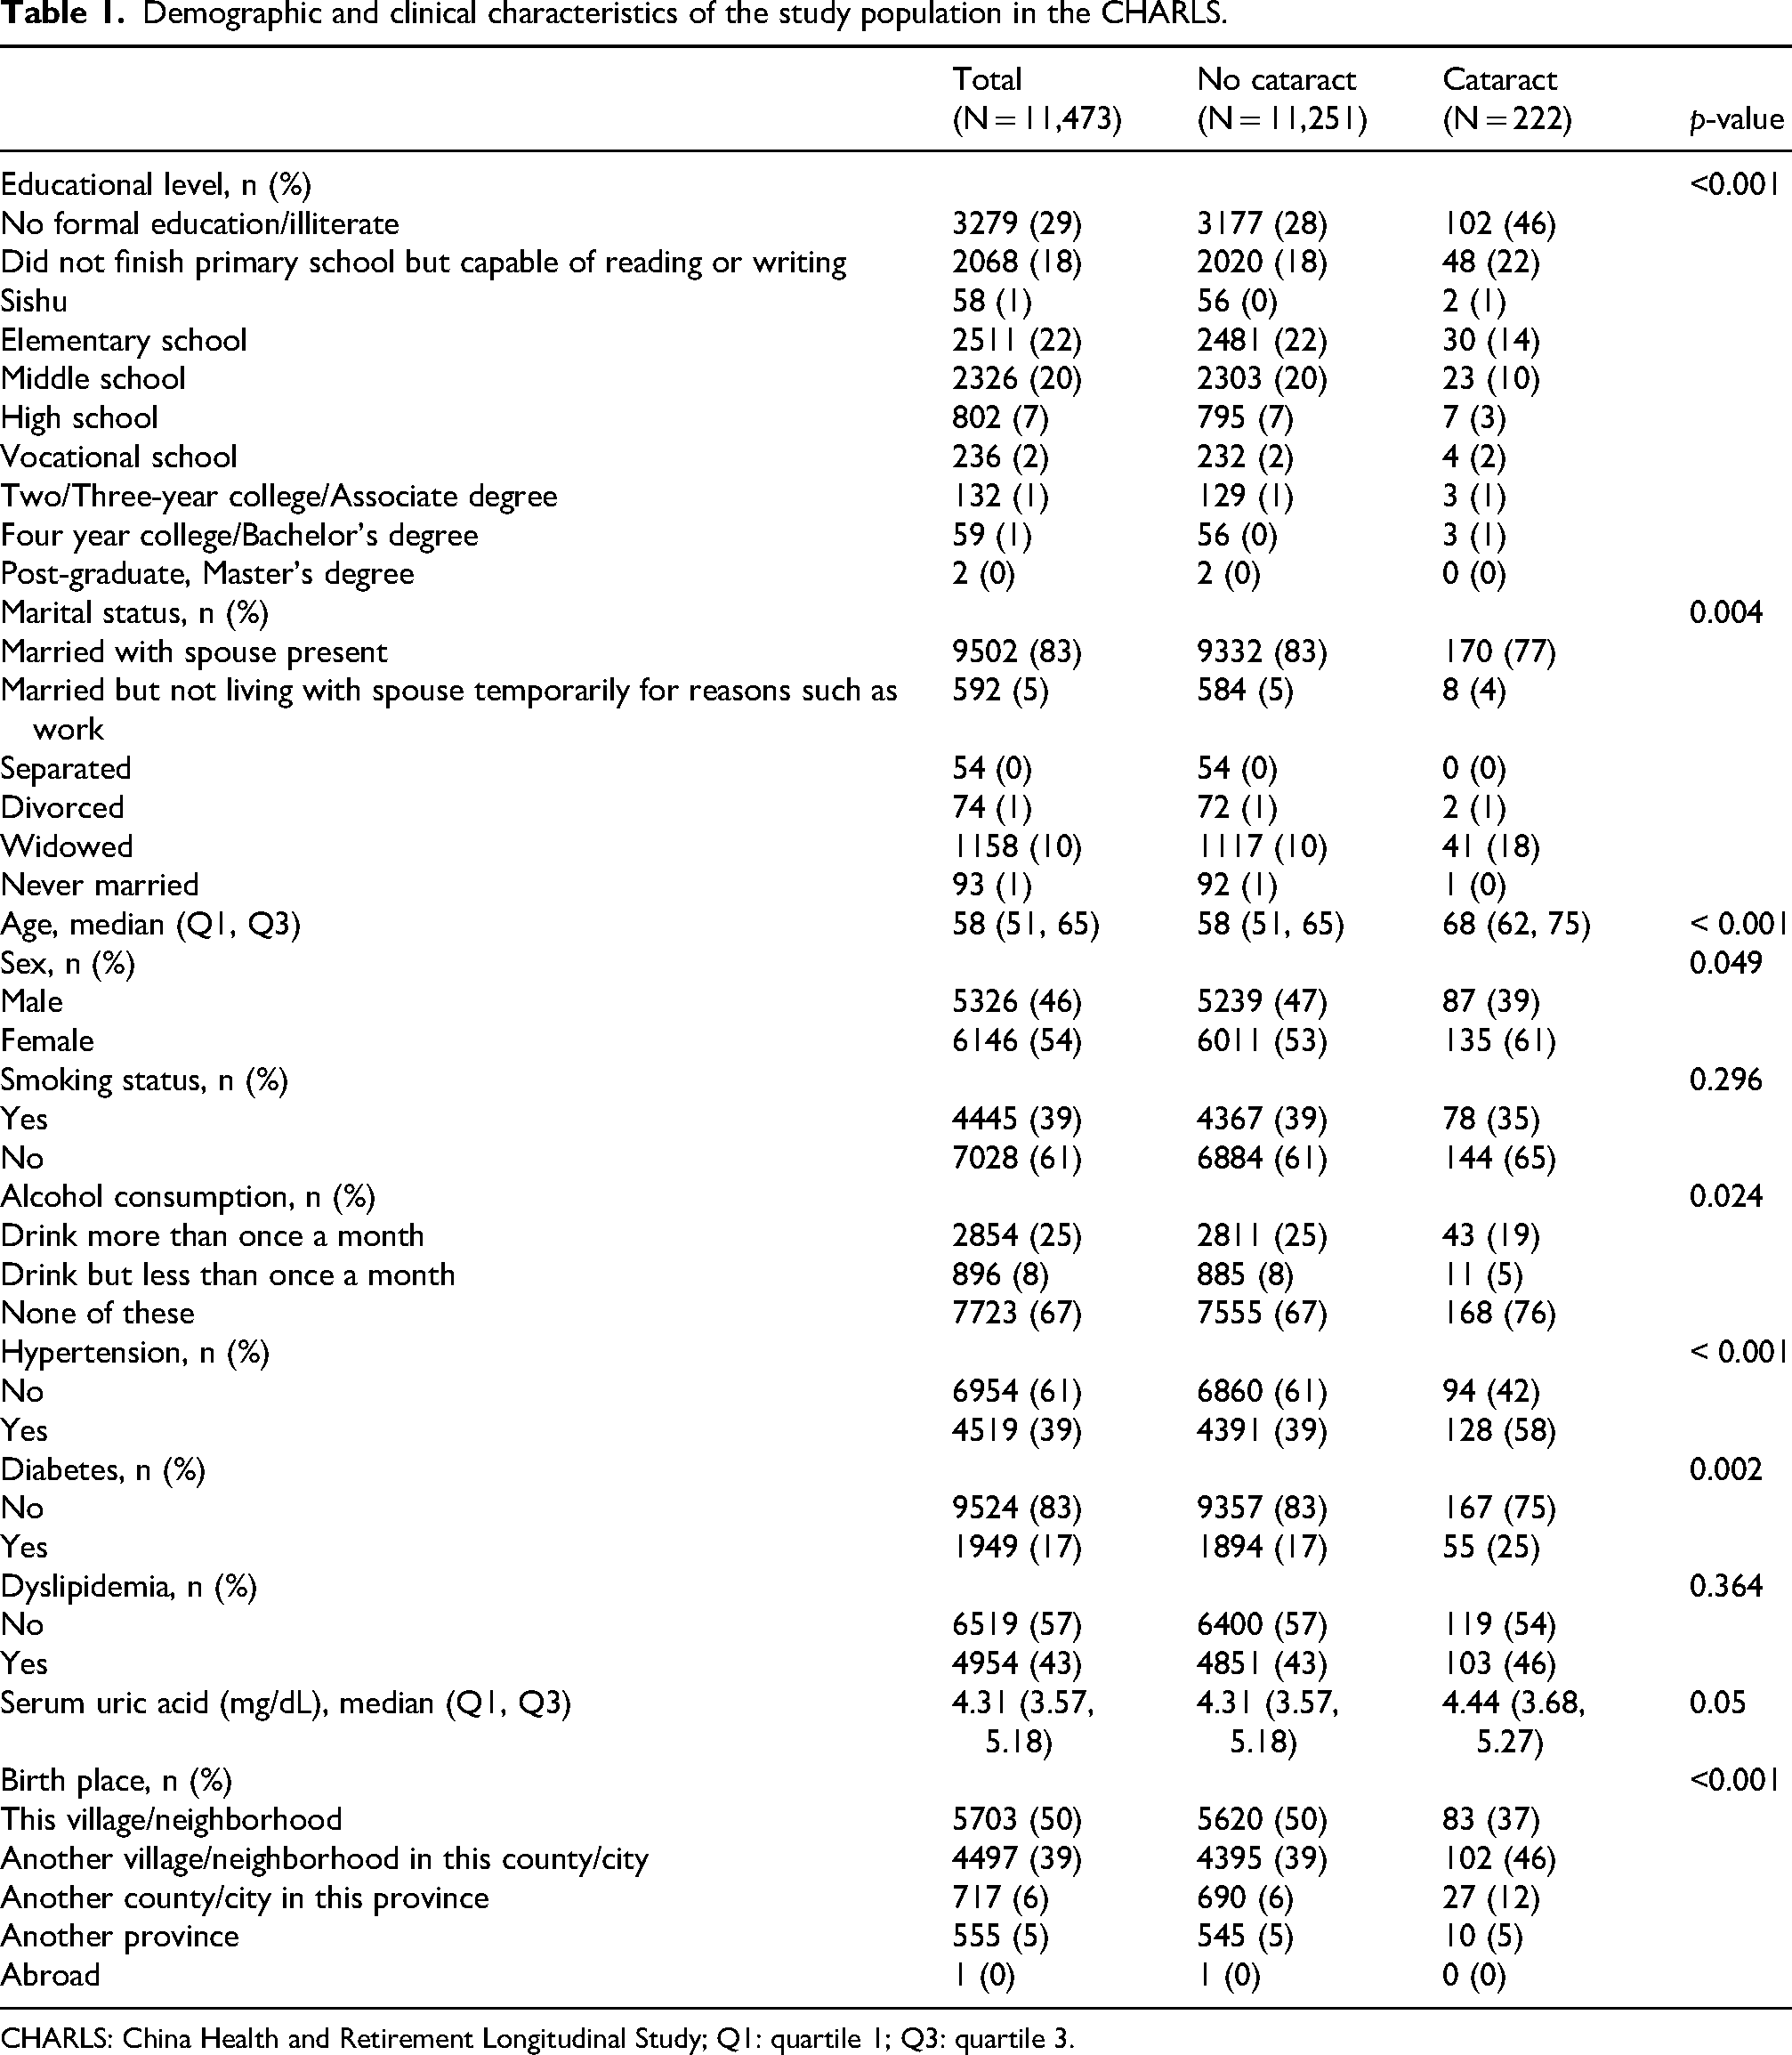
CHARLS: China Health and Retirement Longitudinal Study; Q1: quartile 1; Q3: quartile 3.
Baseline characteristics of study participants stratified by cataract status: NHANES (1999–2008).

Data are presented as median (interquartile range) values for continuous variables and number (percentage) for categorical variables.
p-values were derived from Wilcoxon rank-sum tests for continuous variables and χ2 tests for categorical variables.
NHANES: National Health and Nutrition Examination Survey; IQR: interquartile range.
Analysis of the correlation between cataract risk and uric acid level
In the CHARLS cohort (n = 11,473), a per-unit increase in serum uric acid level was associated with a higher odds of cataract in crude (OR: 1.14, 95% confidence interval (CI): 1.03–1.25; p = 0.012) and demographically adjusted models (OR: 1.11, 95% CI: 1.00 – 1.24; p = 0.044). However, this association was attenuated to null after full adjustment for behavioral and cardiometabolic risk factors (OR: 1.09, 95% CI: 0.98–1.22; p = 0.105). Similarly, in quartile analyses, no significant trend or dose–response relationship was observed across increasing serum uric acid levels in the fully adjusted model (Q4 vs. Q1: OR: 1.13, 95% CI: 0.74–1.73; p = 0.572). Consistent findings were observed in the NHANES cohort (n = 9754). Although higher serum uric acid levels were strongly associated with cataract risk in the crude model (OR: per SD: 1.23, 95% CI: 1.16–1.30; p < 0.001), this association was fully attenuated after adjustment for demographic, socioeconomic, and cardiometabolic covariates (fully adjusted OR: per SD: 1.05, 95% CI: 0.98–1.12; p = 0.175; OR per µmol/L: 1.001, 95% CI: 1.000–1.001). Together, these results from two large, nationally representative cohorts indicate that the apparent association between serum uric acid level and cataract risk is largely explained by age, sex, socioeconomic factors, and comorbidities—particularly hypertension and diabetes—and does not persist after comprehensive adjustment. Detailed results are presented in Tables 3 and 4.
Association between serum uric acid level and cataract risk in the CHARLS study.
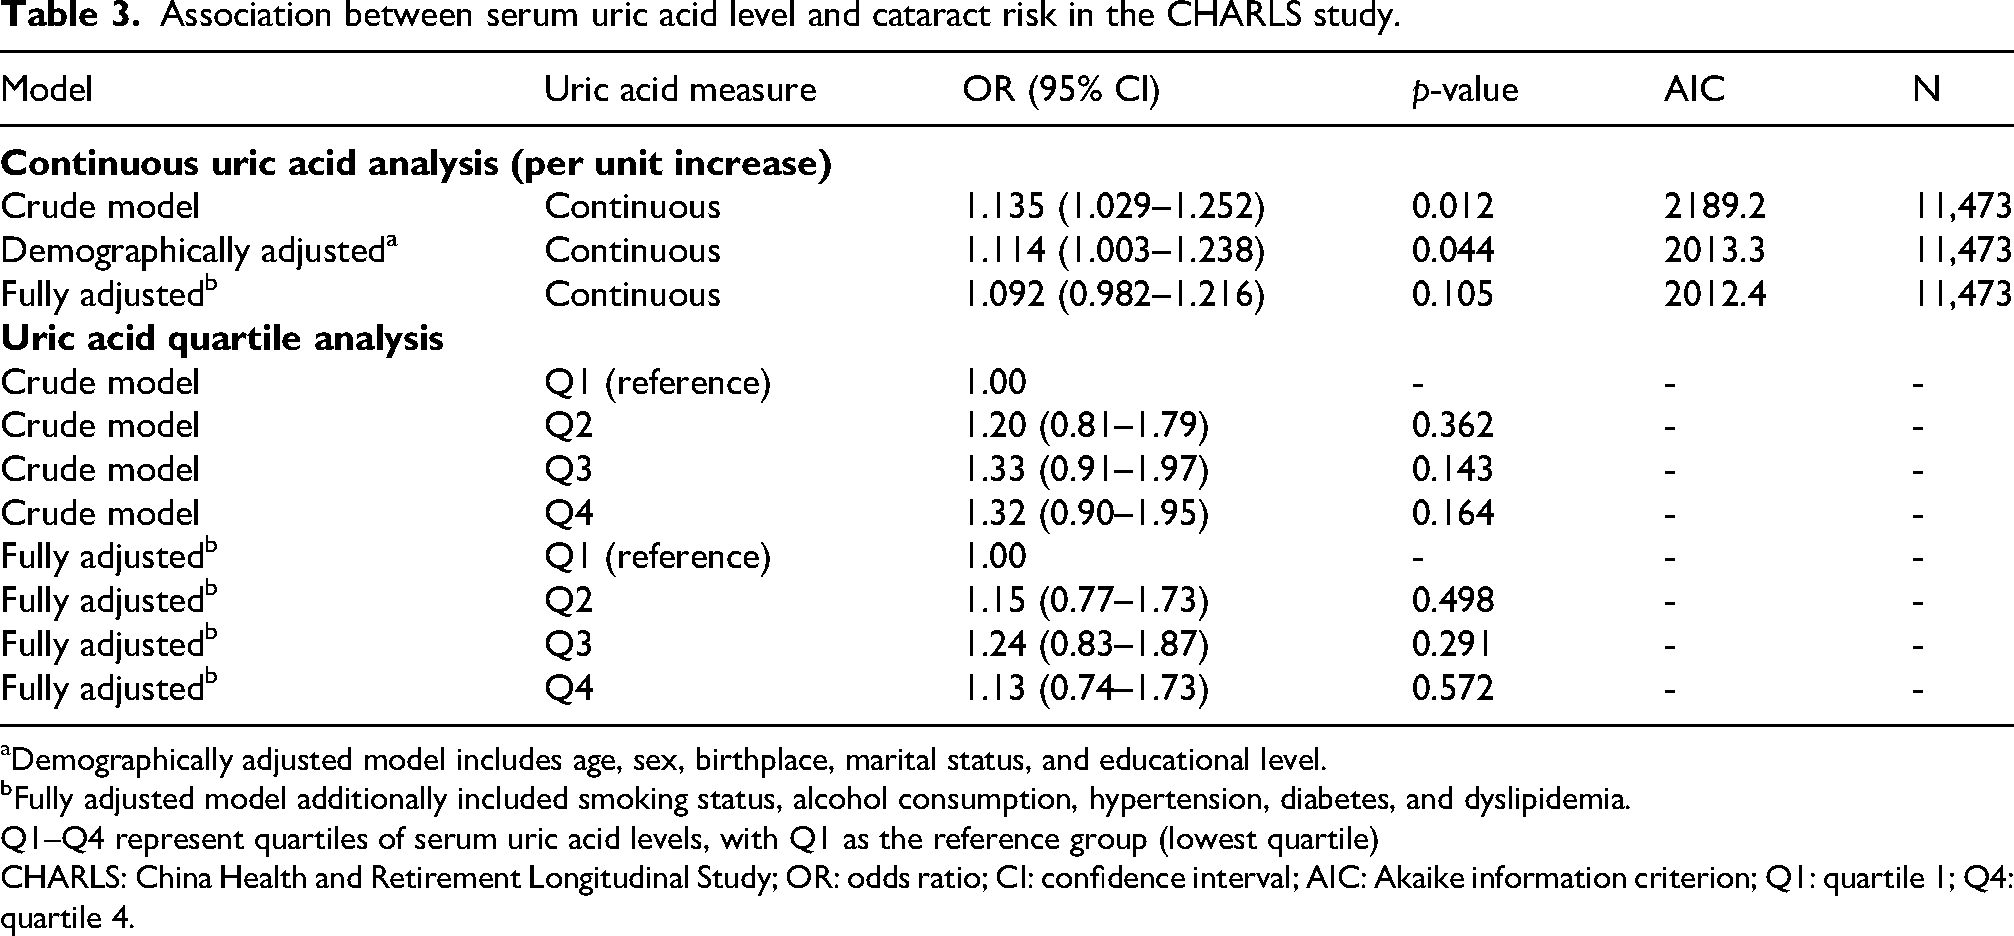
Demographically adjusted model includes age, sex, birthplace, marital status, and educational level.
bFully adjusted model additionally included smoking status, alcohol consumption, hypertension, diabetes, and dyslipidemia.
Q1–Q4 represent quartiles of serum uric acid levels, with Q1 as the reference group (lowest quartile)
CHARLS: China Health and Retirement Longitudinal Study; OR: odds ratio; CI: confidence interval; AIC: Akaike information criterion; Q1: quartile 1; Q4: quartile 4.
Association between serum uric acid levels and cataract risk in us adults: results from NHANES-based multivariable logistic regression models.
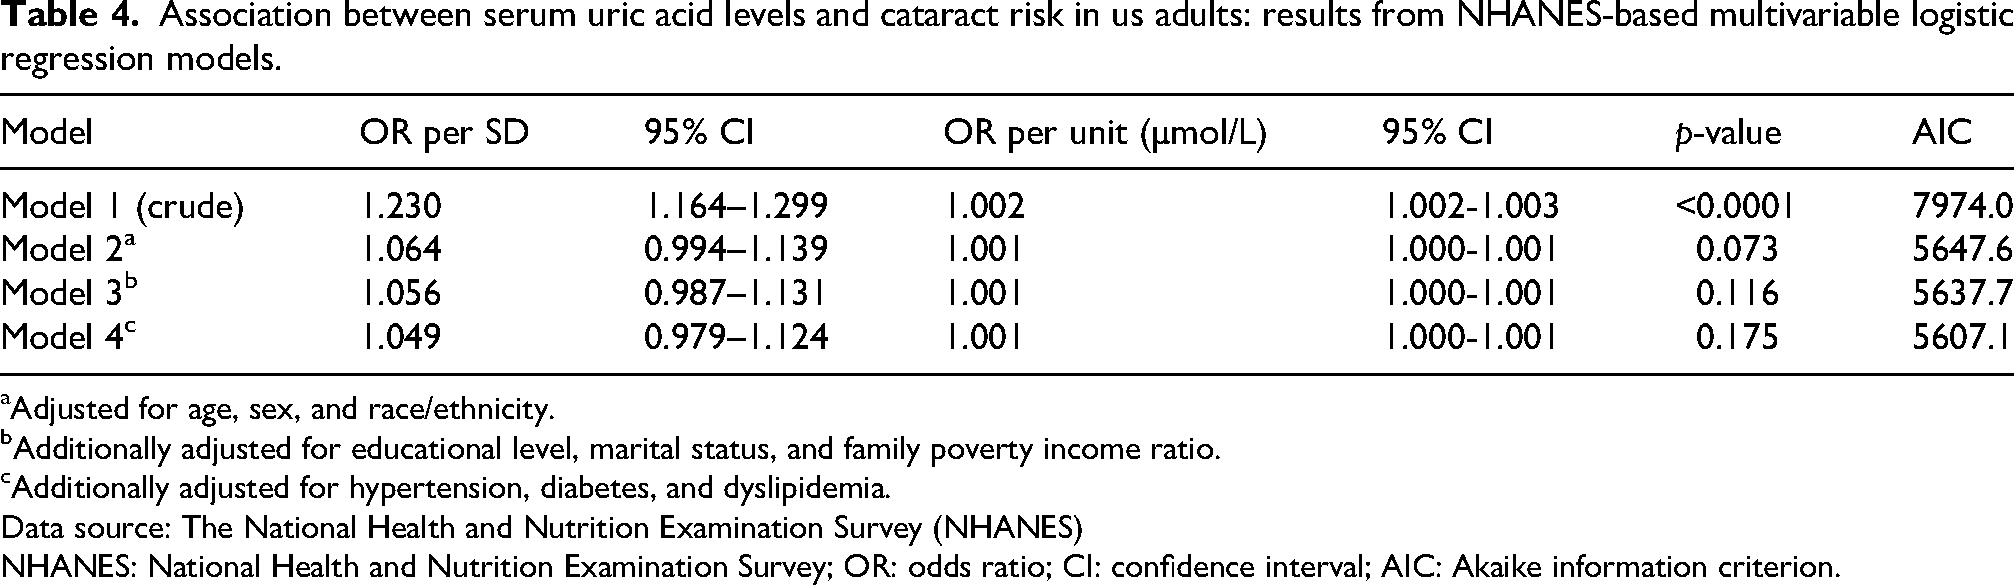
Adjusted for age, sex, and race/ethnicity.
Additionally adjusted for educational level, marital status, and family poverty income ratio.
Additionally adjusted for hypertension, diabetes, and dyslipidemia.
Data source: The National Health and Nutrition Examination Survey (NHANES)
NHANES: National Health and Nutrition Examination Survey; OR: odds ratio; CI: confidence interval; AIC: Akaike information criterion.
To elucidate the potential dose–response relationship between serum uric acid level and cataract risk, RCS analyses were performed on both cohorts. After full adjustment for relevant covariates, no significant association was observed in either population. In the CHARLS cohort, the RCS model revealed no significant linear or nonlinear relationship between serum uric acid levels and cataract risk. The overall association and test for nonlinearity were nonsignificant (poverall = 0.329 and pnonlinear = 0.844, respectively). The spline curve fluctuated around an OR of 1.0 across the entire range of serum uric acid concentrations, with the 95% CI consistently encompassing the null value. Similarly, in the NHANES cohort, the RCS analysis, which modeled uric acid in µmol/L, showed no statistically significant dose–response relationship. The overall association (poverall = 0.262) and nonlinearity test (pnonlinear = 0.384) were both nonsignificant. The fitted curve remained close to the null line, indicating a lack of association. These consistent null findings from the RCS analyses in two independent cohorts robustly support the results of the primary logistic regression models, confirming that serum uric acid levels were not independently associated with self-reported cataract surgery status. Detailed results are presented in Figures 1 and 2.
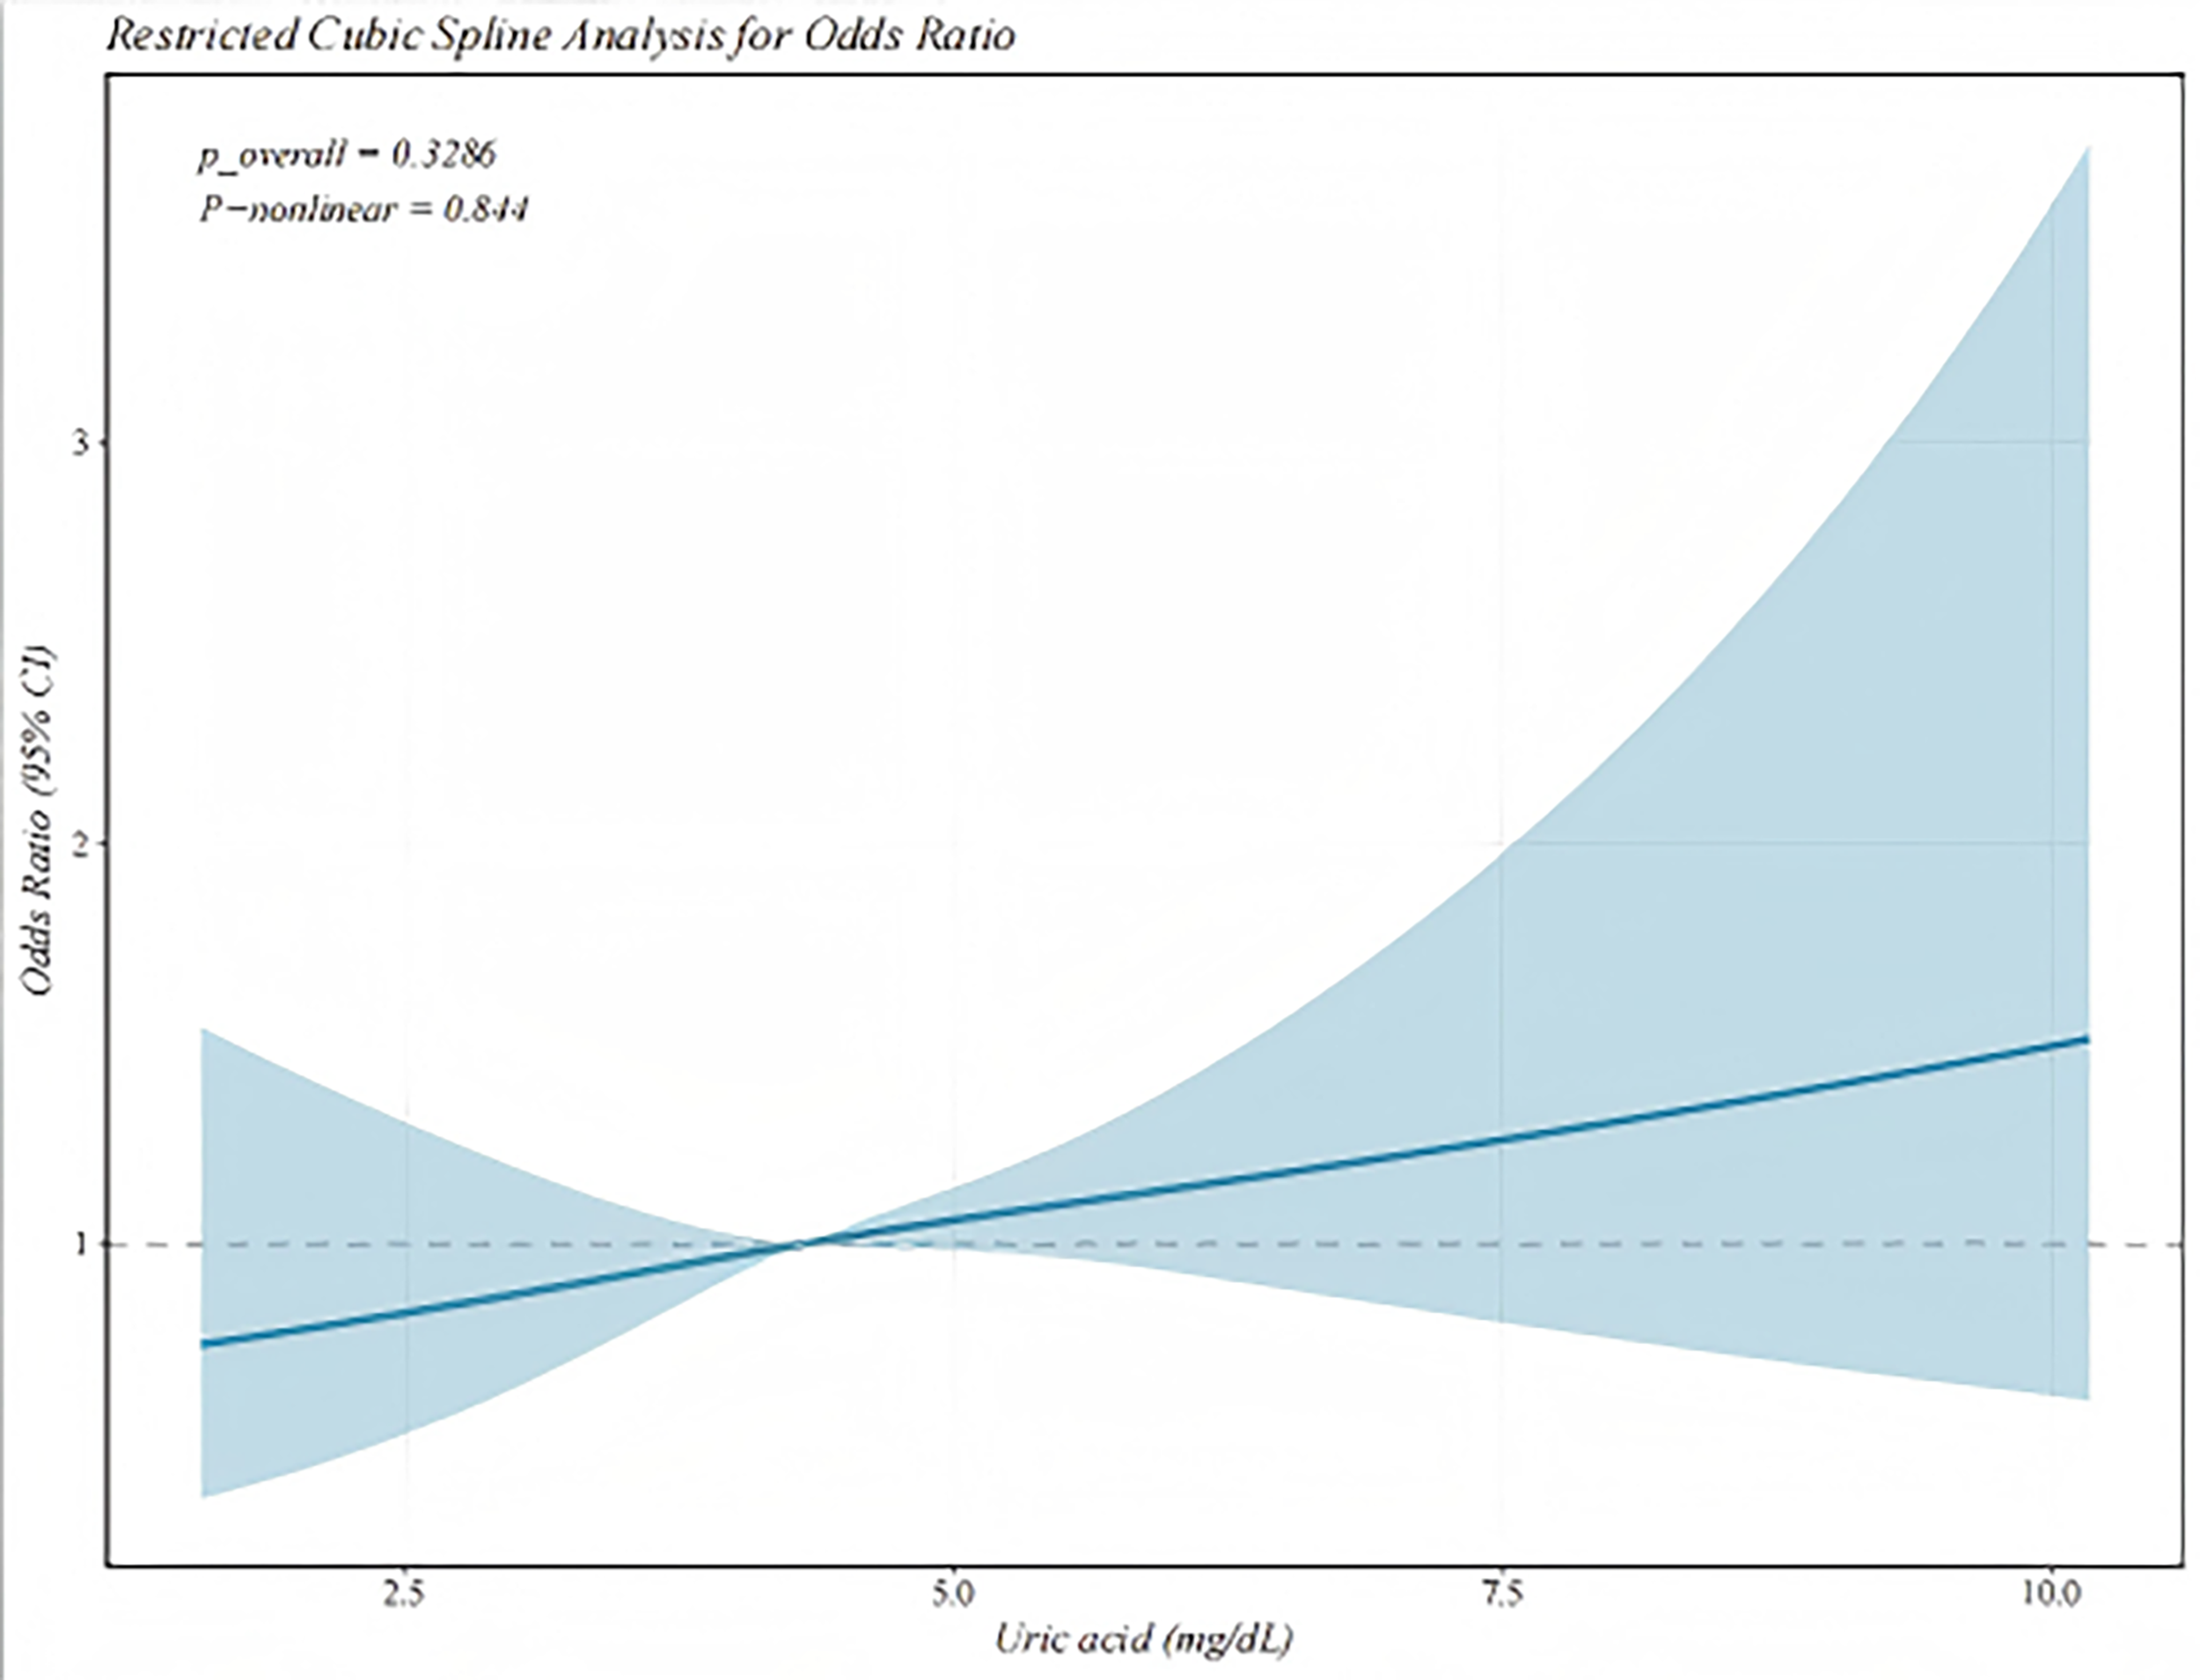
Nonlinear association between serum uric acid levels and cataract risk (adjusted model) in the CHARLS.
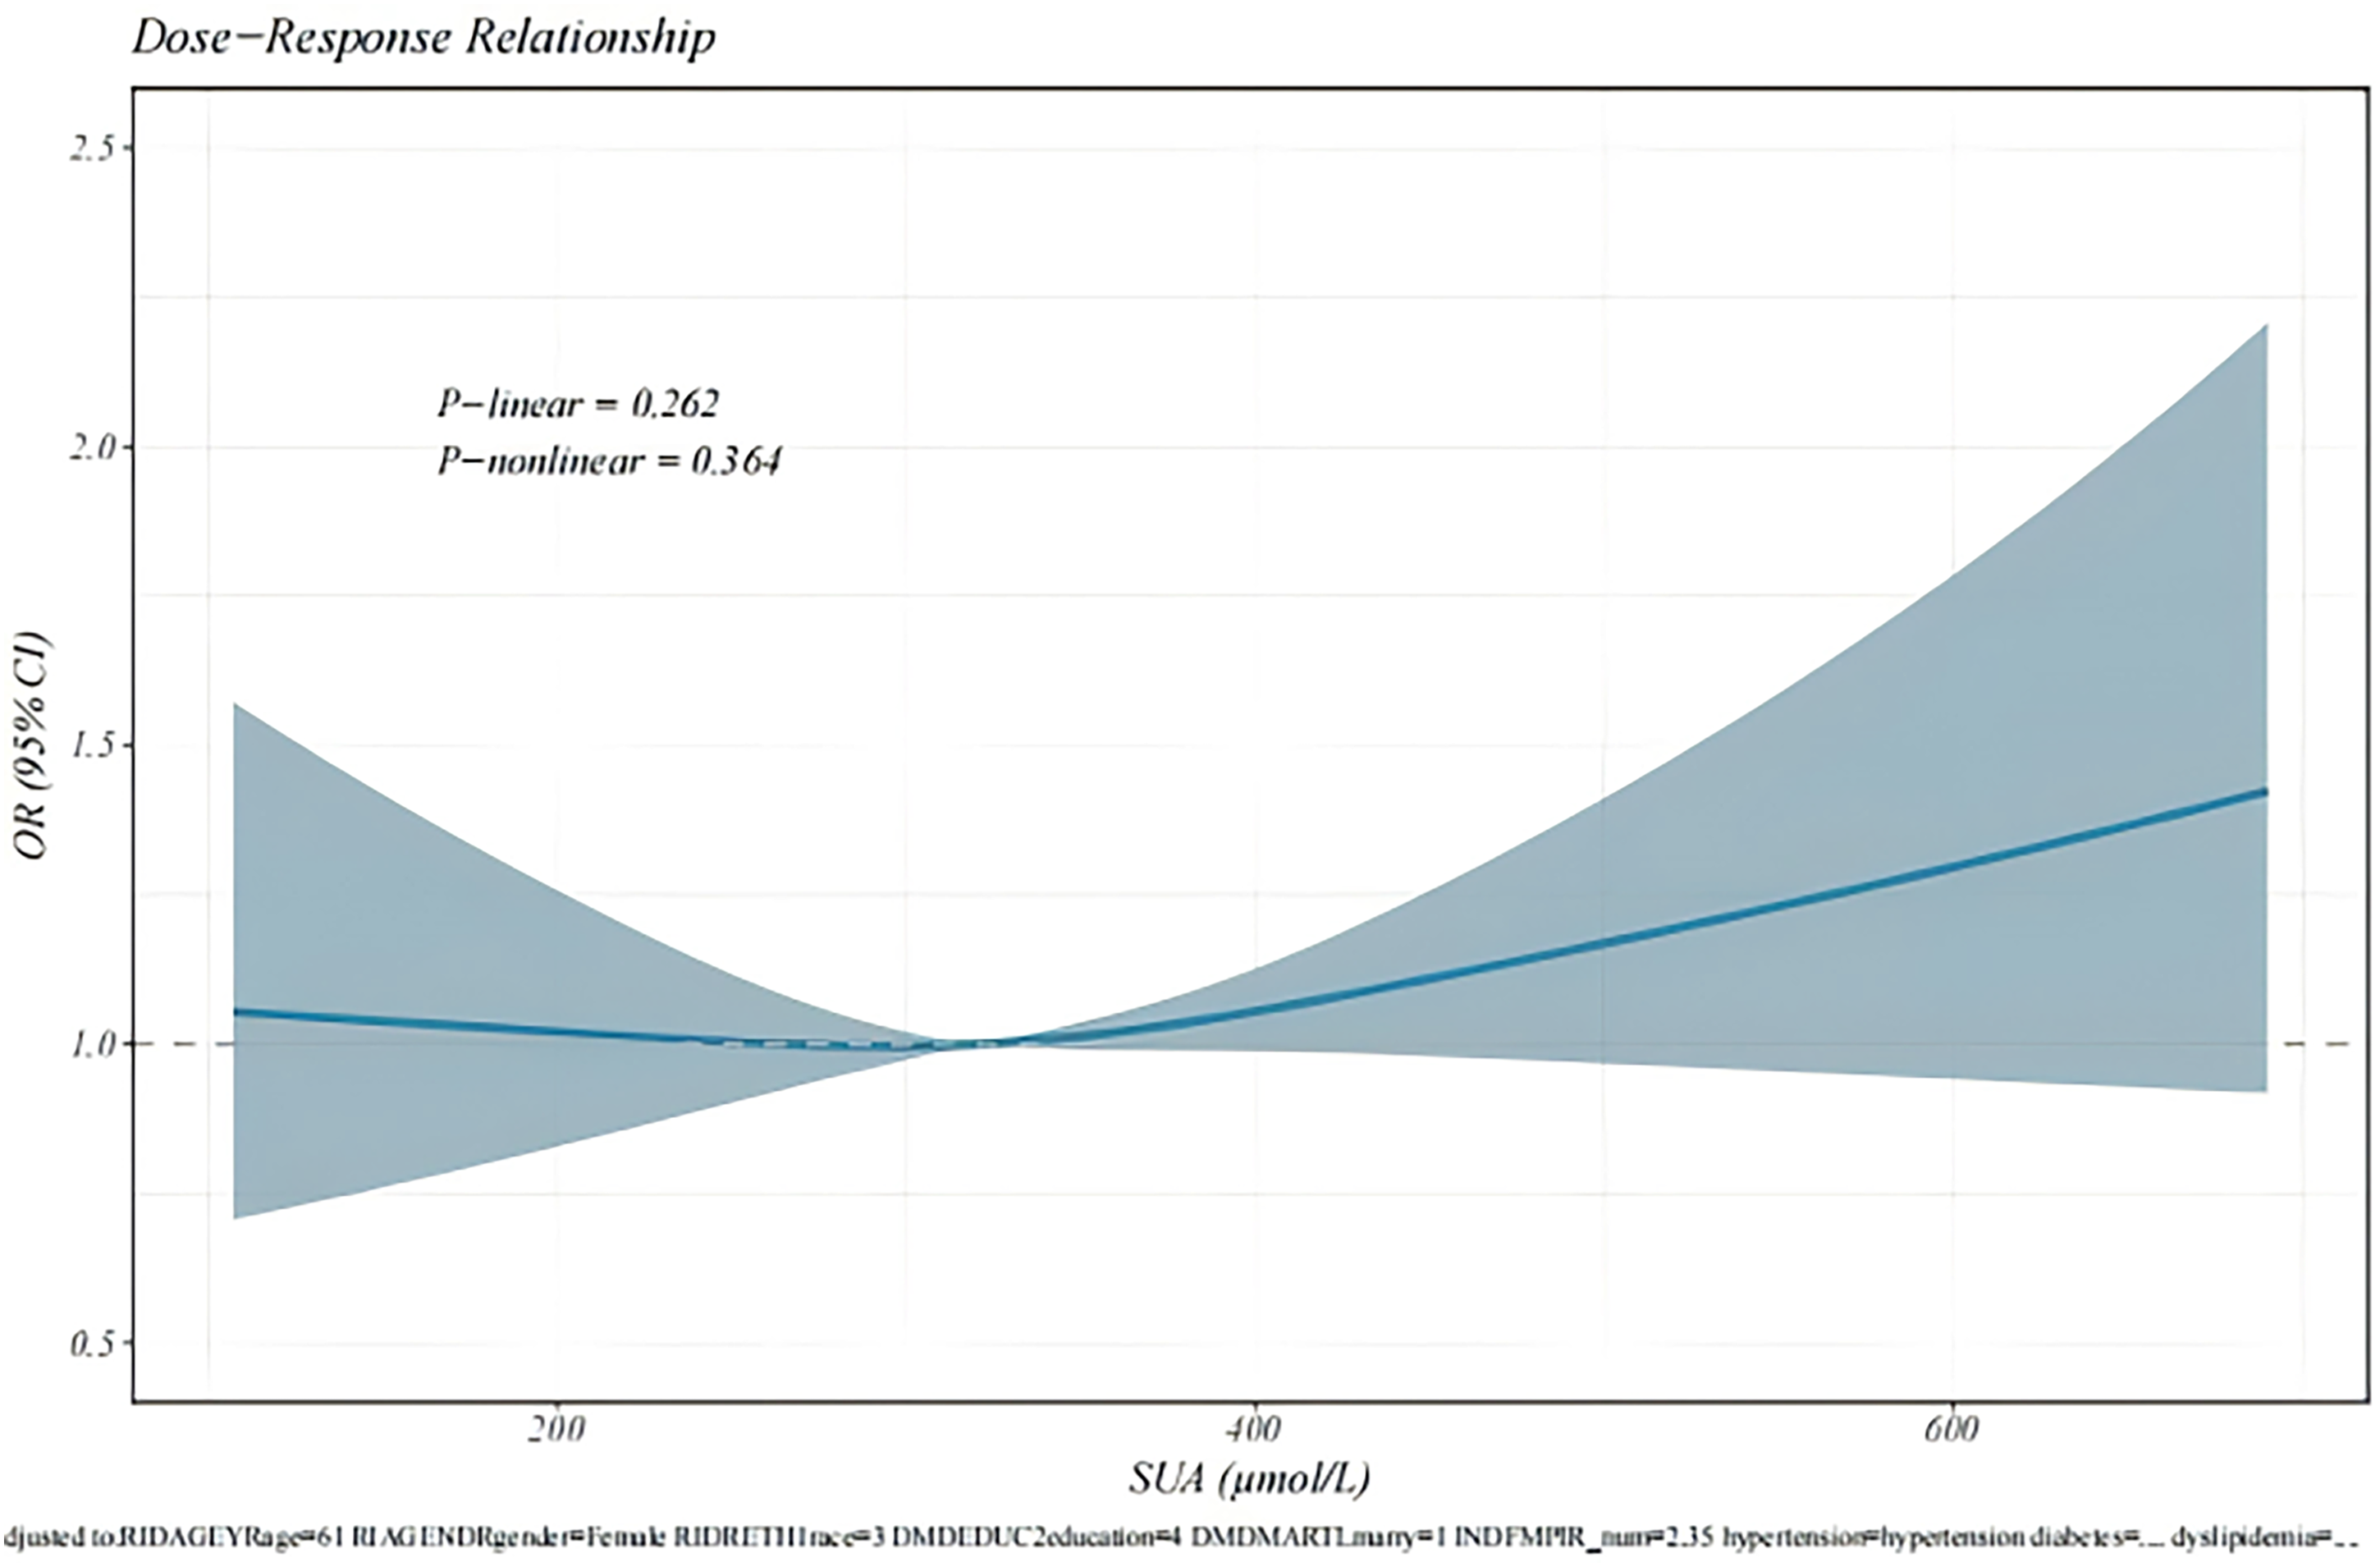
Nonlinear association between serum uric acid levels and cataract risk (adjusted model) in the NHANES.
Subgroup analyses were conducted to assess the consistency of the association between serum uric acid level and cataract risk across key demographic and clinical strata in both cohorts. The results were remarkably congruent; no statistically significant effect modification was observed in either population (all p for interaction > 0.05). In the CHARLS cohort, the overall null association demonstrated no significant heterogeneity across subgroups. Although point estimates suggested marginally stronger associations among participants with certain characteristics (e.g. lower educational level and current smoking), these differences were not statistically significant. Similarly, in the NHANES cohort, the null association remained consistent across all subgroups, including those defined by sex, race/ethnicity, and cardiometabolic status. A nominally significant positive association was observed within the small “other race” subgroup (OR: 2.16, 95% CI: 1.26–3.71); however, the nonsignificant interaction test (p = 0.10) suggests that this is a spurious finding, resulting from a limited sample size rather than a true biological interaction. Detailed results are presented in Figures 3 and 4.
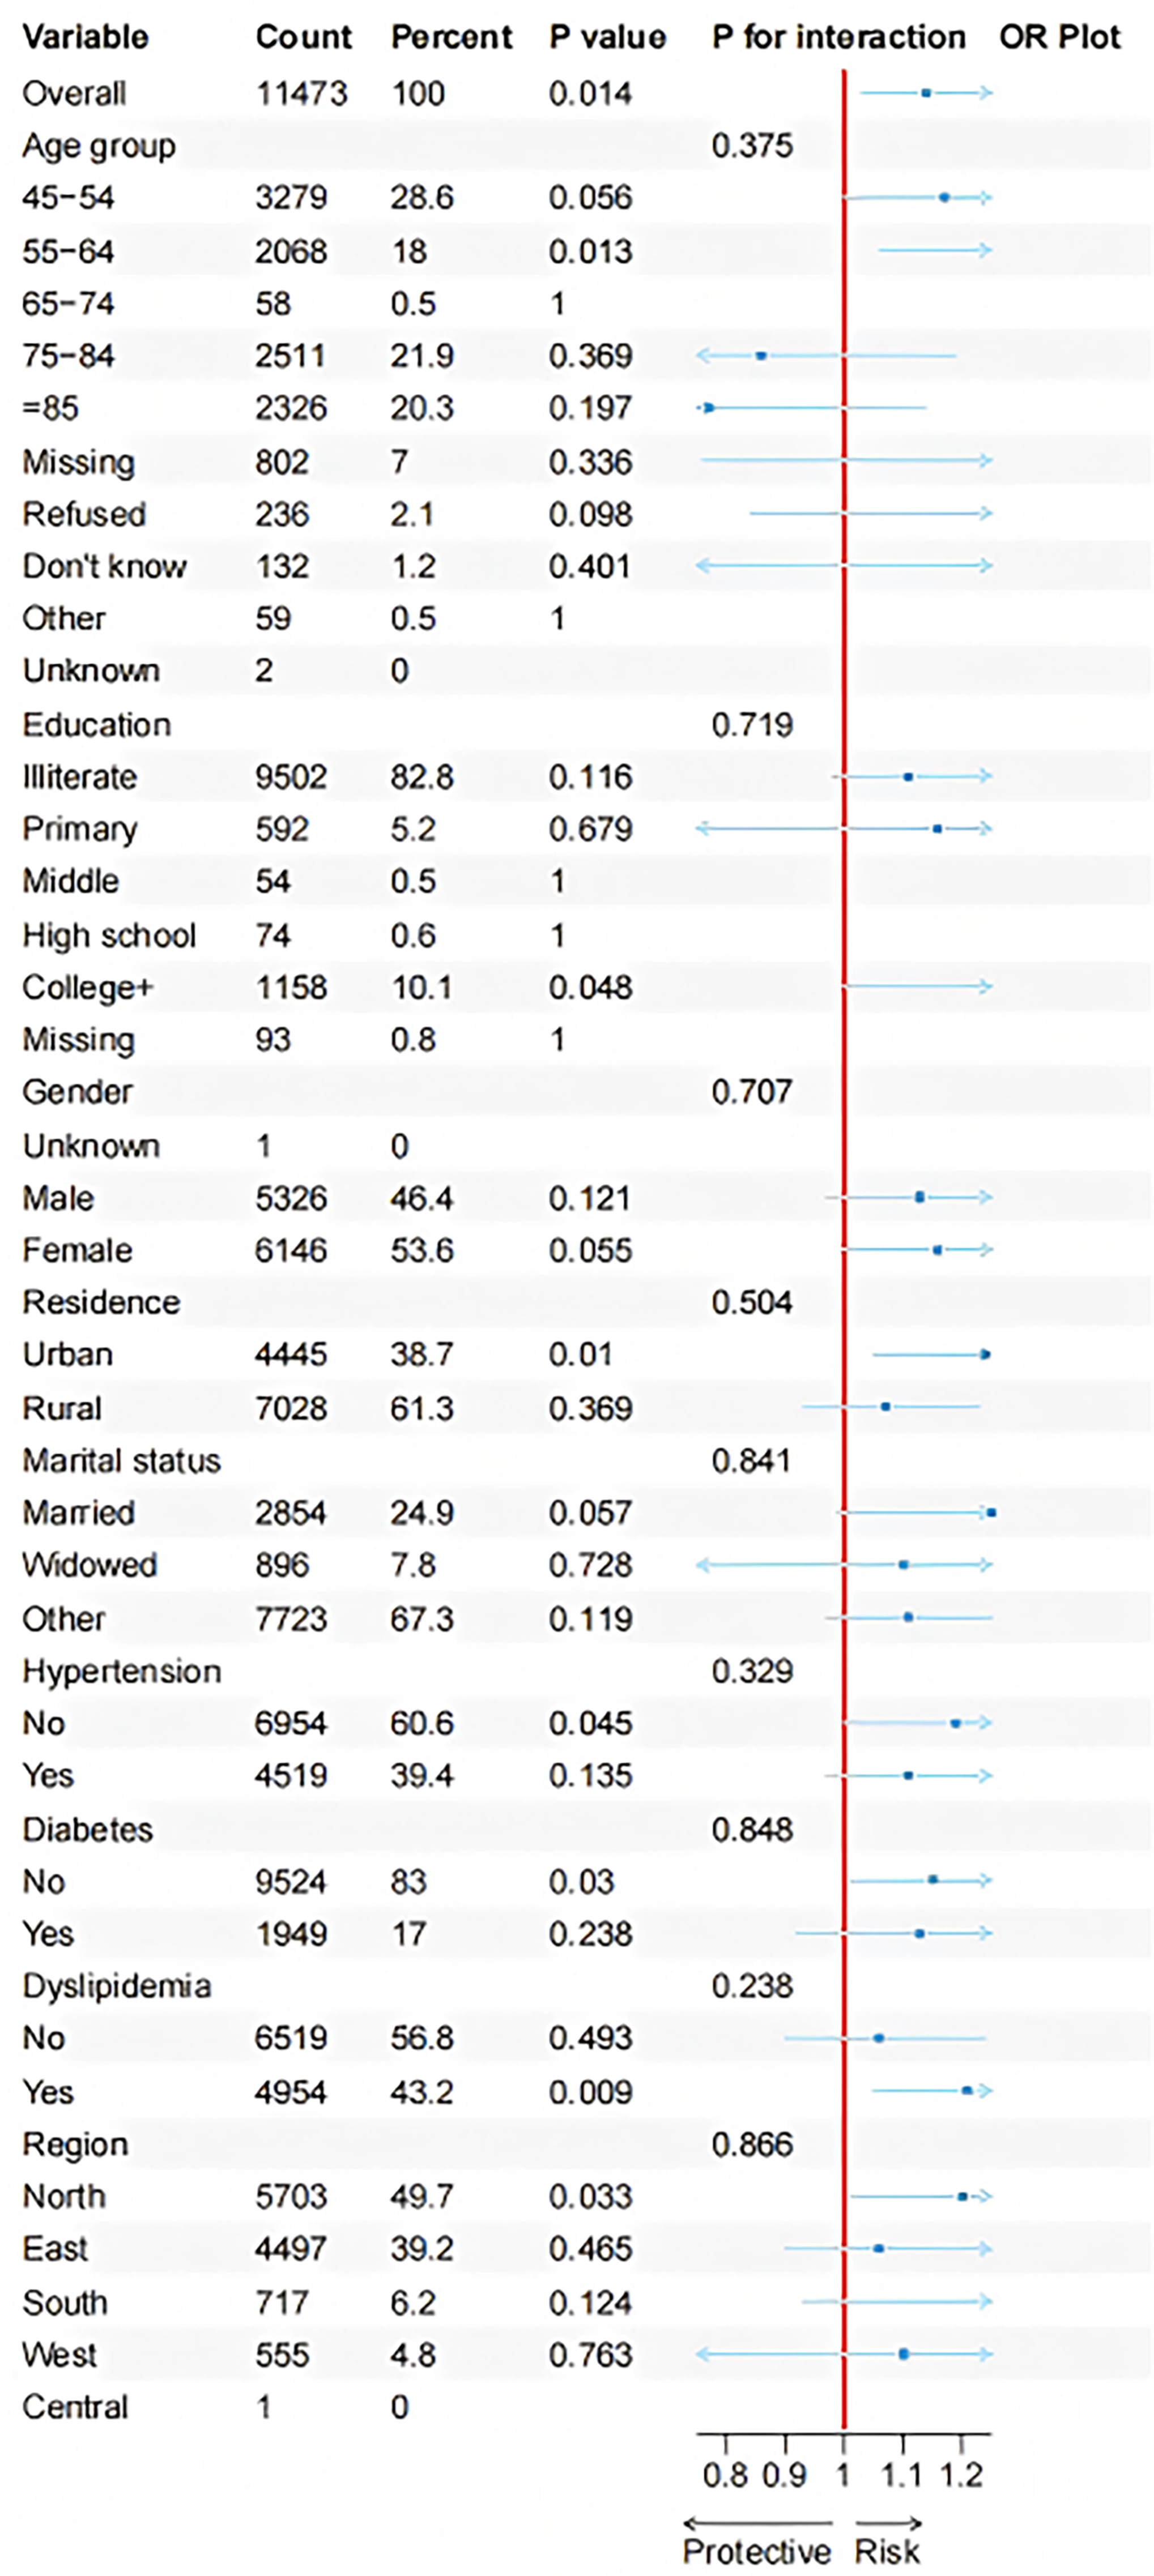
Subgroup analysis results corrected for all confounding factors in the CHARLS dataset.
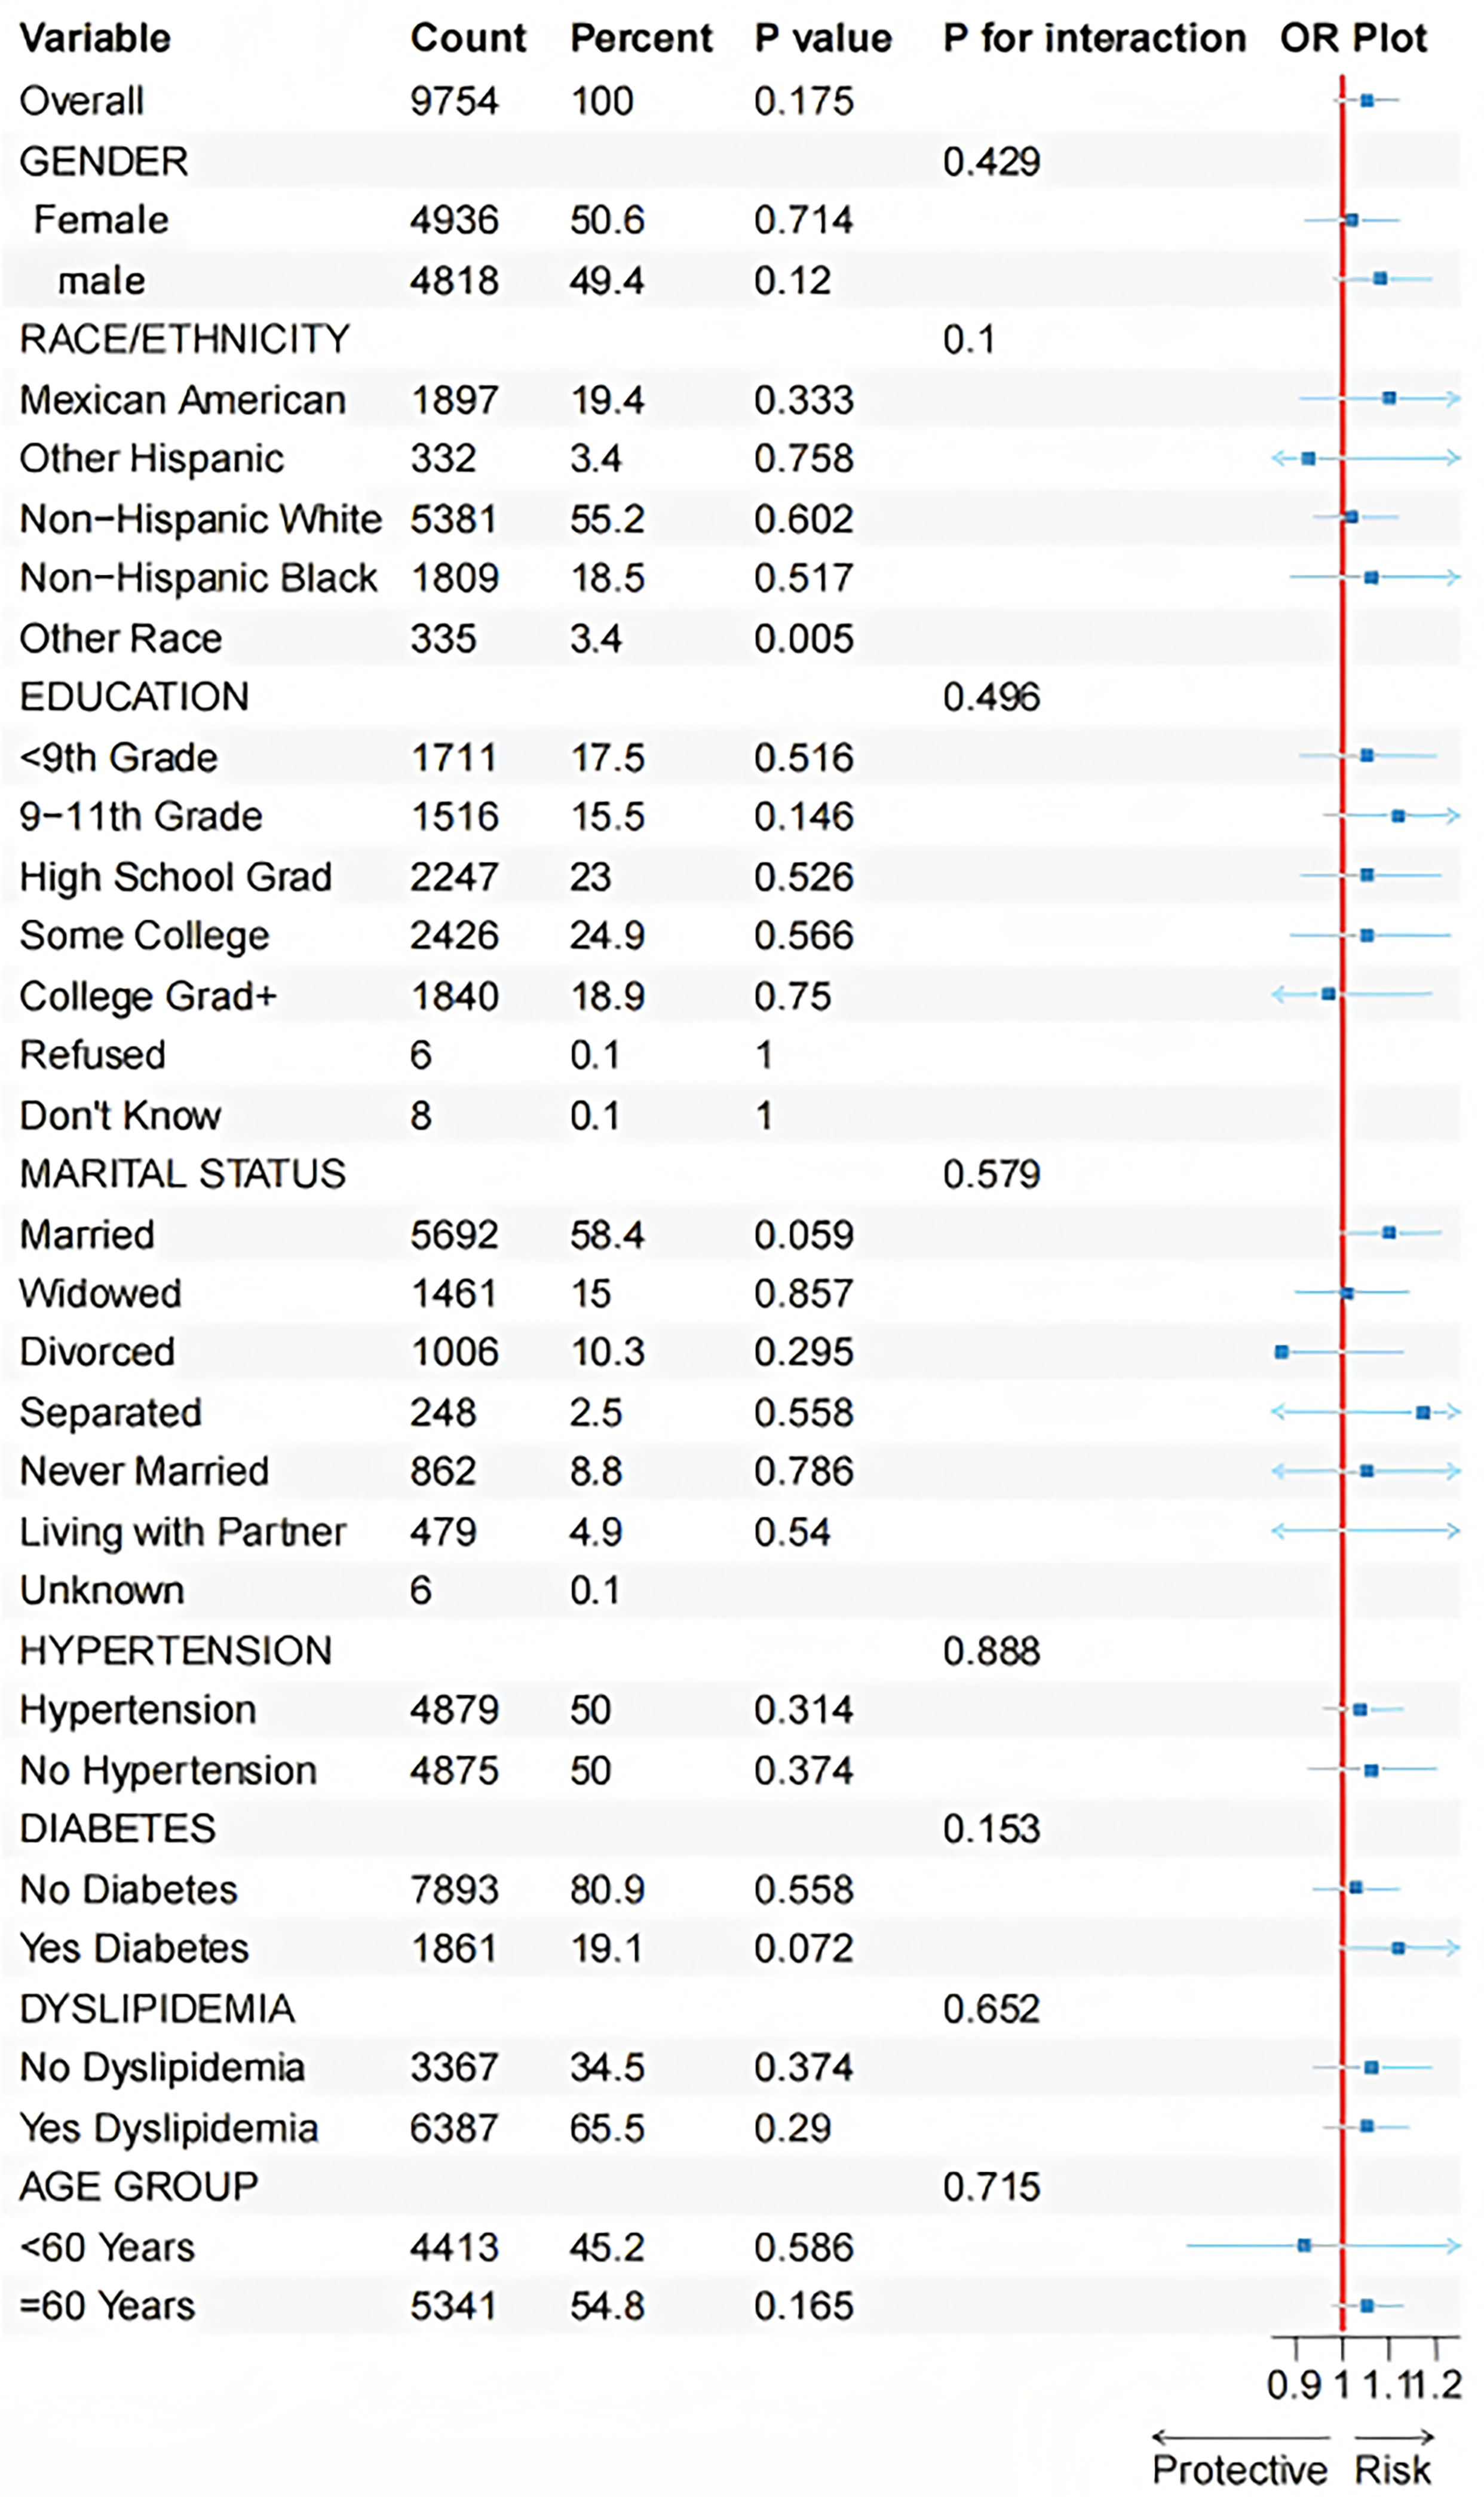
Subgroup analysis results corrected for all confounding factors in the NHANES dataset.
The consistent lack of significant effect modification in two large, independent studies suggests that the observed null association between serum uric acid and self-reported cataract surgery is not substantially influenced by the examined demographic, lifestyle, or cardiometabolic factors. These consistent findings across subgroups suggest that there was no significant association between serum uric acid levels and self-reported cataract surgery across the examined strata.
Discussion
Based on large-scale data from the CHARLS and NHANES cohorts, this cross-sectional study yielded consistent findings across both populations, showing no significant association between serum uric acid levels and cataract prevalence. The initial, unadjusted positive associations observed in both cohorts were entirely attenuated and were rendered statistically nonsignificant following comprehensive adjustment for key demographic, socioeconomic, and cardiometabolic confounders. This null finding was consistently demonstrated across multiple analytical approaches, including multivariable logistic regression treating serum uric acid level as both a continuous and categorical variable, RCS analysis for assessing dose–response relationships, and extensive subgroup analyses. The remarkable concordance of these results across two ethnically and culturally distinct populations significantly strengthens the conclusion that the apparent link between serum uric acid level and cataract risk is attributable to confounding rather than a direct causal pathway.
Our findings appear to contradict some previous studies, particularly those focusing on aqueous humor uric acid or specific cataract subtypes, that have reported a positive association.15,20,21 This discrepancy warrants careful interpretation. A primary explanation lies in the potent confounding effect of age and cardiometabolic diseases. Uric acid levels are strongly correlated with advancing age 22 and renal function, all of which are established, powerful risk factors for cataractogenesis.23–25 Our data clearly show that participants with cataracts were significantly older and had a higher burden of hypertension and diabetes. Smaller previous studies, potentially limited in statistical power for extensive multivariable adjustment, may have identified an association that primarily reflected the influence of these underlying shared risk factors. The large sample sizes of the CHARLS and NHANES cohorts afforded us the ability to rigorously control for these confounders, revealing that serum uric acid level itself was not independently associated with self-reported cataract surgery. Furthermore, the biological context of serum uric acid's dual role must be considered. At physiological concentrations, it is a major antioxidant in the blood, theoretically capable of protecting the lens from oxidative damage. In pathological states such as hyperuricemia, it can exhibit pro-oxidant or crystal-forming properties. Our null results suggest that at the population level, the potential dual physiological role of serum uric acid, as both an antioxidant and pro-oxidant, has a negligible impact on cataract development. Therefore, no clear net effect on the risk of cataracts was observed. Alternatively, it is plausible that systemic serum uric acid is a poor surrogate for the intraocular redox environment. The association found between aqueous humor uric acid and cataracts in some studies indicates localized ocular processes that are not accurately reflected by systemic circulation levels, a hypothesis our study did not address.
This study has several strengths. The use of two independent, well-characterized cohorts from different continents enhances the generalizability and reliability of our findings. The application of RCS models definitively ruled out a nonlinear relationship, and the comprehensive subgroup analyses demonstrated the consistency of the null association across a wide spectrum of demographic and clinical characteristics. The solitary significant finding in the “other race” subgroup in the NHANES is highly likely to be a spurious finding attributable to the small sample size in that stratum, as indicated by the nonsignificant interaction test.
Nevertheless, certain study limitations must be acknowledged. First, the absence of complex adjustment of investigation weights may limit the national representativeness of our estimation results. The cross-sectional design precludes any inference of causality. We cannot definitively rule out the possibility of reverse causation, whereby subclinical cataracts or associated conditions influence uric acid metabolism, although this seems less biologically plausible. Second, the definition of cataract was based on self-reported history of cataract surgery. 26 Although this is a validated epidemiological tool, it inevitably introduces misclassification bias by excluding individuals with cataracts not yet advanced enough for surgery. If nondifferential with respect to serum uric acid level, this would bias results towards the null, reinforcing our null finding. However, differential misclassification is plausible as hyperuricemia often coexists with conditions associated with more frequent healthcare encounters, potentially increasing cataract detection and surgery rates. In this case, the bias direction becomes unpredictable—it could either attenuate or exaggerate the true association. Nevertheless, even under differential misclassification, a precise null estimate is unlikely to arise solely due to bias. Third, we lacked data on specific cataract subtypes (cortical cataract, nuclear cataract, and PSC). It is possible that serum uric acid could be associated with a particular subtype, a nuance our study was not designed to detect. Finally, residual confounding from unmeasured factors, including dietary patterns and medication use, cannot be completely excluded. Dietary patterns present a complex scenario, purine-rich foods may elevate uric acid while possessing antioxidant properties, whereas healthy diets are associated with both lower serum uric acid levels and lower cataract risk. Thus, the net direction of dietary confounding remains uncertain although it may attenuate the observed association. Use of medications, such as diuretics, introduces unpredictable bias due to their inconsistent effects on serum uric acid levels and cataract risk. For any unmeasured confounder to fully explain a null finding, it would need strong, opposing relationships with both exposure and outcome—a scenario unlikely for most factors discussed. Nonetheless, residual confounding warrants cautious interpretation. From a clinical and public health perspective, our findings carry clear implications. They suggest that the measurement of serum uric acid levels, a commonly available biomarker, has no utility in the assessment or stratification of cataract risk in the general population. Clinical efforts should continue to focus on promoting the modifiable, well-established risk factors for cataract prevention, such as smoking, diabetes and hypertension, and exposure to ultraviolet light exposure. Future research should prioritize prospective cohort studies to establish temporal relationships and, where feasible, integrate biochemical analyses of aqueous humor with detailed lens opacity grading to elucidate the localized oxidative stress pathways relevant to cataractogenesis.
Summary
This rigorous analysis of two large, independent cohorts demonstrated that serum uric acid levels were not independently associated with self-reported cataract surgery status. The apparent association was largely explained by confounding from age, cardiometabolic comorbidities, and socioeconomic factors. These results indicate that systemic uric acid levels are not independently associated with self-reported cataract surgery, and clinical attention should remain directed toward established determinants of cataract risk.
Footnotes
Acknowledgments
The authors would like to express their gratitude to all those who participated in the China Health and Retirement Longitudinal Study (CHARLS) and National Health and Nutrition Examination Survey (NHANES) for their important contributions to the collection, management, and dissemination of the data. When writing this document, we utilized artificial intelligence. During the writing process, we only used DeepSeek for polishing the language, checking grammar, and improving readability.
Ethics approval and consent to participate
This cross-sectional analysis utilized de-identified, publicly available data from the National Health and Nutrition Examination Survey (NHANES) and China Health and Retirement Longitudinal Study (CHARLS). The NHANES study protocol was approved by the National Center for Health Statistics Research Ethics Review Board, and the CHARLS was approved by the Biomedical Ethics Review Committee of Peking University. All participants in both original surveys provided written informed consent. Therefore, the current secondary analysis was exempt from additional ethical approval and was conducted in accordance with the ethical standards of the Declaration of Helsinki (1975, as revised in 2024).
Author contributions
Yi Xianglong conceived and designed the study. Hu Lumei and Wang Guoqing contributed equally to this work and share first authorship. Hu Lumei and Wang Guoqing jointly performed data acquisition, statistical analysis, and interpretation of the results. Hu Lumei drafted the initial manuscript, and Wang Guoqing contributed to figure preparation and data visualization. Yi Xianglong provided critical revision of the manuscript for important intellectual content and supervised the entire study. All authors read and approved the final version of the manuscript.
Funding
This work was supported by (a) the Natural Science Foundation of Xinjiang Uygur Autonomous Region (Key Project No. 2022D01D68) and (b) the Tianshan Talent Training Program of Xinjiang Uygur Autonomous Region (Medical and Health High-level Talents, Leading Talent, No. TSYC202301A007).
Declaration of conflicting interests
The authors declared no potential conflicts of interest with respect to the research, authorship, and/or publication of this article.
Data availability
The datasets analyzed in this study are publicly available. The National Health and Nutrition Examination Survey (NHANES) data can be accessed from the Centers for Disease Control and Prevention (CDC) website: https://www.cdc.gov/nchs/nhanes. The data from the China Health and Retirement Longitudinal Study (CHARLS) are available from the CHARLS official website: ![]() .
.