
Abstract
Objective
The study aimed to evaluate the short-term changes in central retinal thickness after uncomplicated cataract surgery in diabetic patients and assess the influence of diabetic retinopathy severity on postoperative retinal response.
Methods
In total, 102 eyes of 102 type 2 diabetic patients undergoing cataract surgery were divided into two groups: Group I (n = 51) comprised eyes without diabetic retinopathy and Group II (n = 51) included eyes with diabetic retinopathy. Central retinal thickness was assessed at baseline and postoperative weeks 1, 6, and 12 using spectral-domain optical coherence tomography. Changes in central retinal thickness of ≥10, ≥29, and ≥50 µm were analyzed.
Results
Central retinal thickness significantly increased at 6 weeks postoperatively (Group I: median 263 µm; Group II: median 270 µm; p = 0.001). No significant differences in best-corrected visual acuity loss were observed between the two groups (p = 0.265). In Group II, the increase in central retinal thickness was highest in patients with severe diabetic retinopathy.
Conclusion
The severity of diabetic retinopathy is correlated with the magnitude of retinal thickening, peaking at 6 weeks postoperatively. Despite an increase in the central retinal thickness, visual acuity remained stable during the study period. Duration of diabetes and elevated glycosylated hemoglobin levels were identified as systemic risk factors. These findings underscore the importance of optical coherence tomography–based monitoring and diabetic retinopathy staging in perioperative diabetic care.
Introduction
Diabetes mellitus (DM) is a chronic metabolic disease characterized by sustained hyperglycemia, which leads to macrovascular and microvascular complications. 1 The global prevalence of diabetes is high and continues to rise. In 2019, the International Diabetes Federation estimated that 240 million people were living with diabetes (9.6% prevalence), and this number is projected to increase to 356 million (11.1% prevalence) by 2045. The prevalence of DM rises significantly with age, exceeding 20% among older adults. Chronic hyperglycemia affects multiple organ systems, including the cardiovascular, renal, neural, and ocular systems. 2 Diabetes impacts all ocular tissues, including the crystalline lens. 3 Therefore, a large proportion of diabetic patients experience accelerated cataract development, necessitating cataract surgery at an earlier age compared with nondiabetic individuals. 2
Cataract, defined as clouding of the crystalline lens, can be classified into different types, including nuclear, cortical, and posterior subcapsular cataracts. Pathogenesis of cataract in diabetes involves several mechanisms, including (a) hyperglycemia leading to the formation of advanced glycation end products (AGEs); (b) increased oxidative stress; and (c) activation of the polyol pathway, all of which compromise the blood–aqueous barrier and blood–retina barrier (BRB). 4
Phacoemulsification is one of the most frequently performed surgical procedures in modern ophthalmology and is considered a safe and effective technique that achieves significant improvement in visual function. However, in diabetic patients, cataract surgery may trigger the development or worsening of diabetic retinopathy (DR) and macular edema. This occurs due to inflammatory insults in the aqueous and vitreous, which further disrupt the already compromised BRB.5,6 Recent evidence also indicates an increased risk of postoperative endophthalmitis and posterior capsule rupture in diabetic patients compared with nondiabetic individuals, although intracameral antibiotic prophylaxis significantly reduces the risk of postoperative infection. 7
Preexisting retinopathy increases the risk of postoperative macular edema, as demonstrated in large retrospective studies. 8 In addition to retinopathy, several other factors influence the risk of postoperative DR progression and macular edema in diabetic patients. These include longer diabetes duration, poor glycemic control, elevated baseline central retinal thickness (CRT), intraoperative complications, and comorbidities such as kidney dysfunction and hypertension. 4
Spectral-domain (SD) optical coherence tomography (OCT) is a noninvasive diagnostic imaging technique that uses visible and infrared lights to generate detailed cross-sectional images of ocular tissues. OCT is widely used to evaluate and monitor various retinal pathologies, offering high-resolution imaging and precise quantification of retinal thickness and edema.9,10 This study aimed to evaluate changes in CRT following cataract surgery in diabetic patients across different stages of DR. We disclose here that a preprint version of the manuscript is available on Research Square. 11
Methods
This prospective, comparative observational study was conducted at the Eye Clinic, University Clinical Center of the Republic of Srpska (Bosnia and Herzegovina) from January to October 2023. Ethical approval was obtained from the institutional ethical committee, (No 01-19-238-2/22, date 13 July 2022). All procedures adhered to the principles outlined in the 1964 Declaration of Helsinki. Written informed consent was obtained from every participant before inclusion.
The reporting of this study conforms to the Strengthening the Reporting of Observational Studies in Epidemiology (STROBE) guidelines for observational studies. 12
Study groups
Patients aged ≥55 years with type 2 diabetes and cataract were enrolled and classified into two groups: (a) Group I (51 patients) with diabetes but no DR and (b) Group II (51 patients) with diabetes and varying stages of DR. Cataract severity was graded according to the Lens Opacities Classification System III (LOCS III). The classification of DR severity was based on the Early Treatment Diabetic Retinopathy Study (ETDRS) clinical severity scale, and eyes were categorized as having no DR, mild non-proliferative diabetic retinopathy (NPDR), moderate NPDR, and severe NPDR.
Eye selection
If both eyes of a patient met the inclusion criteria, the eye with the worse baseline best-corrected visual acuity (BCVA) was selected for analysis to standardize the data set and avoid inter-eye correlation. Consequently, only one eye of each patient was included in the study (total: 102 eyes from 102 patients).
Inclusion criteria
Eligible participants were individuals with type 2 diabetes who were scheduled for elective cataract surgery and had a BCVA of ≤0.5 on the Snellen chart (decimal equivalent) due to cataract and a cataract grade of at least N3 or P3 according to the LOCS III.
Exclusion criteria
The following exclusion criteria were adopted for this study: (a) severe cataract with dense nuclei that precluded preoperative OCT imaging; (b) intraoperative complications such as posterior capsule rupture; (c) proliferative DR (with or without prior panretinal photocoagulation); (d) preexisting central retinal thickening CRT >300 µm, OCT findings of intraretinal cystoid changes, subretinal fluid, or disruption of normal foveal contour that suggest of center-involving diabetic macular edema (DME); (e) presence of epiretinal membrane or vitreomacular traction; (f) coexisting ocular diseases, including glaucoma or uveitis; and (g) any intraocular surgery performed within the past 6 months.
Assessment and surgical procedure
Preoperatively, each patient underwent a comprehensive baseline eye examination, which included BCVA assessment (Snellen chart), intraocular pressure measurement (Goldmann tonometry), slit-lamp biomicroscopy, and dilated fundus inspection. Posterior segment assessment comprised dilated fundus examination and color fundus photography using the Zeiss Clarus 7000 imaging system. DR grading was performed by a single retinal specialist based on the combined clinical and photographic findings. Macular imaging was performed using OCT with the Zeiss Cirrus HD-OCT 6000 system. A 6 × 6-mm macular cube scan protocol (512 × 128) centered on the fovea was acquired. CRT was defined as the mean retinal thickness within the central 1-mm ETDRS subfield obtained from the ETDRS thickness map generated by the macular cube scan. Scans were reviewed for image quality, centration, and segmentation accuracy. Eyes with obvious segmentation artifacts, motion artifacts, poor fixation, persistent poor-quality scans or uncorrectable segmentation errors were excluded from the study.
All surgeries were performed by a single experienced surgeon under topical anesthesia. The standard procedure involved a 2.75-mm clear corneal incision, continuous curvilinear capsulorhexis, and phacoemulsification using the Bausch & Lomb Stellaris system (2016 model). A foldable, 1-piece hydrophilic acrylic intraocular lens (AKREOS ADAPT AO) was implanted in all cases. At the conclusion of the surgery, an intracameral antibiotic was administered. Postoperatively, all patients received 0.1% topical dexamethasone eye drops administered 4 times daily during the first postoperative week with slow tapering over 4 weeks according to the institutional postoperative protocol. Topical nonsteroidal anti-inflammatory drugs (NSAIDs), periocular steroids, or intravitreal anti-inflammatory therapy were not used during the observation period
Follow-up assessments were conducted at 1, 6, and 12 weeks postoperatively. At each visit, BCVA was assessed using a Snellen visual acuity chart and recorded as decimal equivalents for statistical analysis. Slit-lamp biomicroscopy examination, fundus examination, and OCT imaging were also performed. Baseline demographic and systemic parameters (age, sex, diabetes duration, treatment type, and glycosylated hemoglobin (HbA1c) levels) were recorded. Mean phacoemulsification time was documented perioperatively.
Standardization of retinal thickening assessment
Changes in CRT <10 µm were considered as an artifact or part of the normal fluctuation. The ≥29-µm threshold was selected based on previously published studies, demonstrating that intervisit variability in CRT values in diabetic eyes was generally below this level. 13 A clinically significant worsening was considered as an increase in CRT ≥50 µm on OCT compared with baseline values in both groups. Patients with postoperative CRT worsening of ≥50 µm were withdrawn from the study for another treatment available at the study center.
Statistical analyses
Data were collected, stored, and managed in a spreadsheet using Microsoft Excel 2010® software. Data were analyzed and figures prepared using the Statistical Package for Social Sciences (SPSS®) software (version 23.0, IBM Corp, Armonk, NY, USA). Descriptive analysis was performed where categorical variables were reported as frequencies and percentages, chi-squared tests were performed to visualize differences between Groups I and II. For continuous variables, tests for normality were performed using the Shapiro–Wilk test and Q–Q plots; data were not normally distributed and were reported as medians and interquartile ranges (IQRs). Kruskal–Wallis tests were used to compare variables between the three DR severity subgroups (mild, moderate, and severe NPDR), while Mann–Whitney U tests were performed for pairwise comparisons between independent groups. Friedman tests were performed for repeated within-group comparisons across baseline, postoperative week 1, postoperative week 6, and postoperative week 12, followed by post hoc Wilcoxon signed-rank tests for pairwise comparisons where appropriate, with Bonferroni correction applied for multiple comparisons. Changes from baseline (ΔCRT) were additionally calculated and analyzed. Effect sizes (r) were reported for Mann–Whitney and Wilcoxon analyses and were interpreted as small (0.10–0.29), moderate (0.30–0.49), or large (≥0.50). Additionally, Spearman's correlation analysis was used to assess associations between CRT at 6 weeks and duration of diabetes as well as HbA1c levels (%). Spearman's correlation coefficients were interpreted as weak (0.00–0.39), moderate (0.40–0.59), or strong (0.60–1.00). A p-value <0.05 was considered statistically significant.
Results
In total, 102 eyes from 102 patients were included in the study, with 51 eyes each in Group I (diabetic patients without DR) and Group II (diabetic patients with DR). The demographic characteristics of patients in both groups were similar (Table 1). Mean patient age was 65 (interquartile range (IQR: 63–69)) years in both groups. The median duration of disease was 11 years in both groups (IQR: 11–12 years). Most patients, including 92.2% patients in Group I and 84.3% patients in Group II, were taking oral antidiabetic drugs (OADs). More patients in Group II were on insulin therapy (15.7% vs. 7.8%); however, the difference was not statistically significant (p = 0.357, small effect size). The median HbA1c levels were similar between the two groups: 6.9% (IQR: 6.5%–7.0%) in Group I and 6.9% (IQR: 6.5%–7.2%) in Group II. The prevalence of hypertension was also comparable between the groups (35.3% vs. 37.3%; p = 0.837). No statistically significant differences were observed in the baseline BCVA, baseline CRT, or mean phacoemulsification time.
Demographic and baseline characteristics.
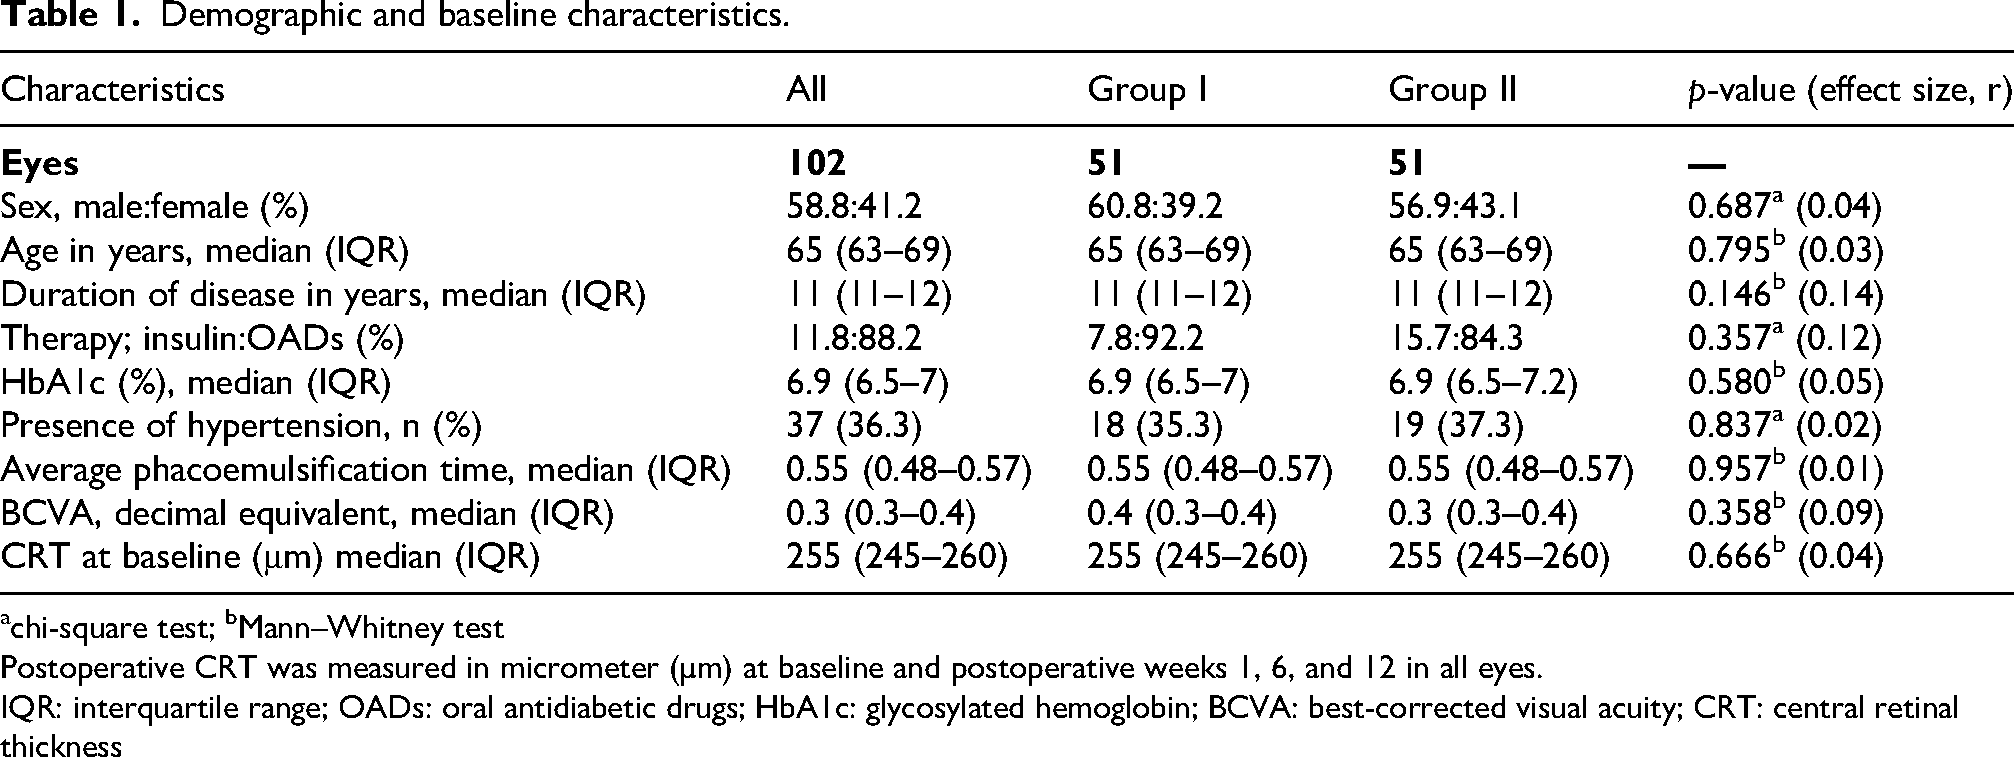
chi-square test; bMann–Whitney test
Postoperative CRT was measured in micrometer (µm) at baseline and postoperative weeks 1, 6, and 12 in all eyes.
IQR: interquartile range; OADs: oral antidiabetic drugs; HbA1c: glycosylated hemoglobin; BCVA: best-corrected visual acuity; CRT: central retinal thickness
Intra-group analysis
CRT values changed significantly over time in both groups (Table 2) (Friedman test, p < 0.001). CRT remained unchanged during postoperative week 1. Compared with the baseline value, the highest CRT values were recorded at postoperative week 6 in both groups, with a median value of 263 (IQR: 255–269) μm in Group 1 and 270 (IQR: 260–280) μm in Group II. CRT slowly decreased by postoperative week 12.
CRT values and changes from baseline at postoperative weeks 1, 6, and 12.
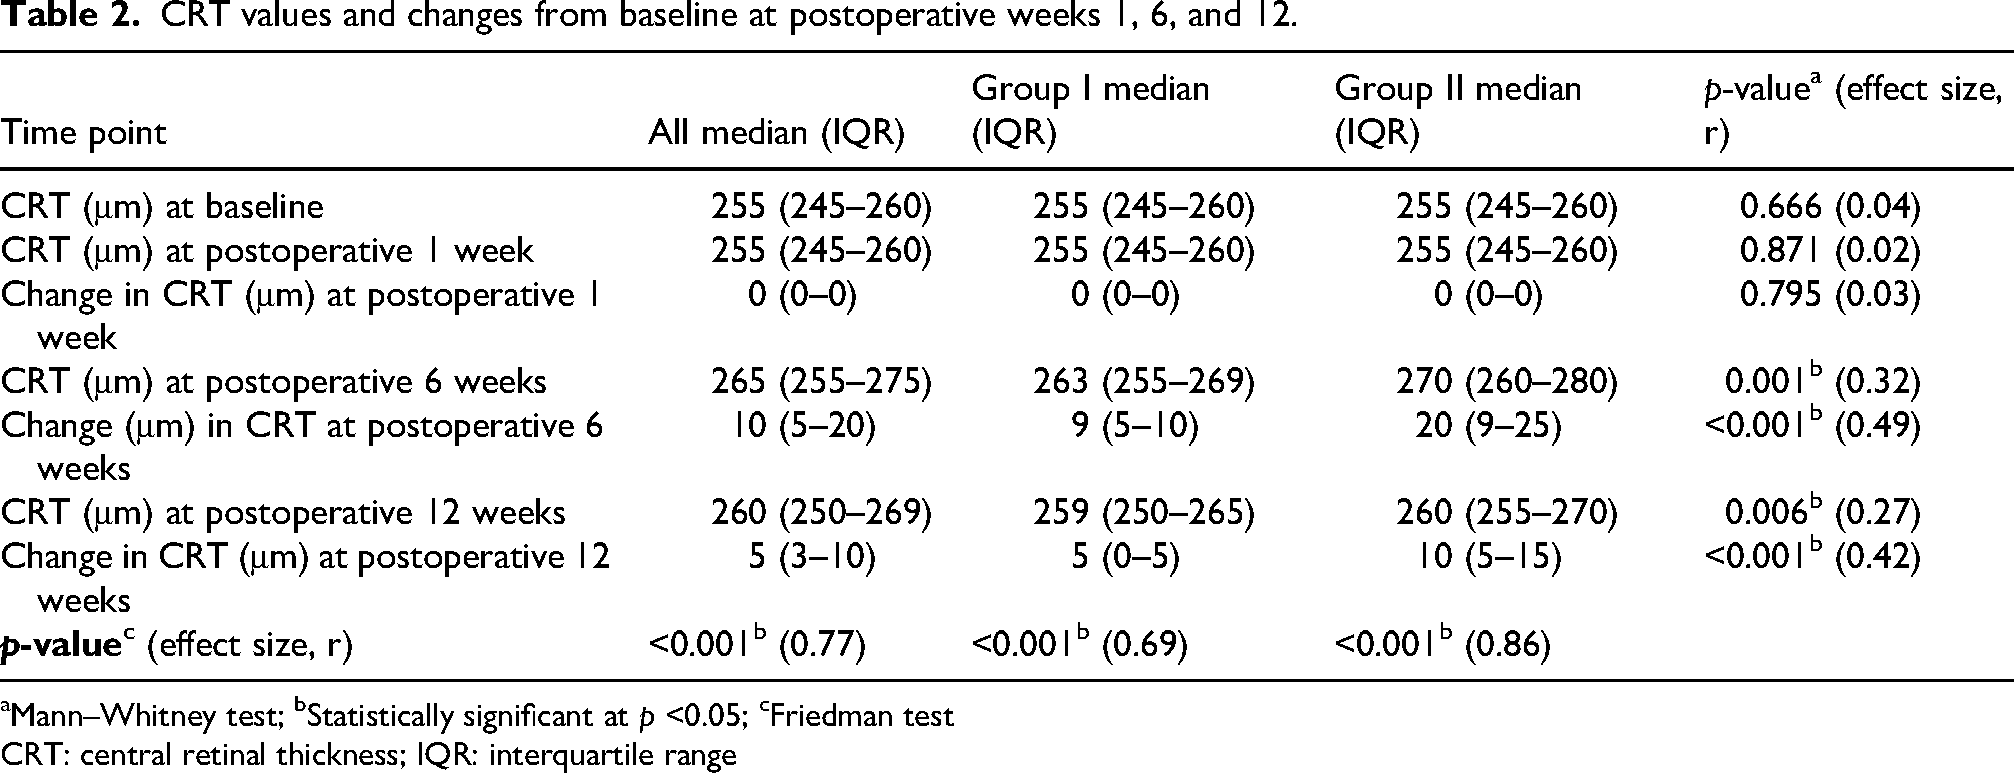
Mann–Whitney test; bStatistically significant at p <0.05; cFriedman test
CRT: central retinal thickness; IQR: interquartile range
Inter-group analysis
CRT changes between the groups (Table 2) were statistically significant at postoperative week 6 (p = 0.001, moderate effect size) and remained significant till postoperative week 12 (p = 0.006, small-to-moderate effect size).
During the 6 weeks after the cataract surgery (Table 3), CRT worsened by ≥10 µm in 14 patients (27.5%) in Group I and in 38 patients (74.5%) in Group II. These changes were statistically significance (p < 0.001) in both groups.
Summary of results in groups I and II at postoperative 6 weeks.

chi-square test; bMann–Whitney test; cStatistically significant at p <0.05
BCVA: best-corrected visual acuity; IQR: interquartile range
CRT worsened by ≥29 µm in 11 patients (21.6%) in Group II (p = 0.001). Four patients (7.8%) in Group II had clinically significant increases in the CRT (by 50 μm) and were withdrawn from the study for advanced treatment. Median BCVA outcomes were comparable between both groups, 0.6 (IQR: 0.6–0.7), with no statistical significance, p = 0.265.
Associations between the duration of diabetes, HbA1c values, and CRT changes at postoperative week 6 were tested (Figure 1). Patients with a longer duration of diabetes (r = 0.201, p = 0.042) and higher HbA1c levels (r = 0.318, p = 0.001) tend to have greater CRT values with statistically significant differences.
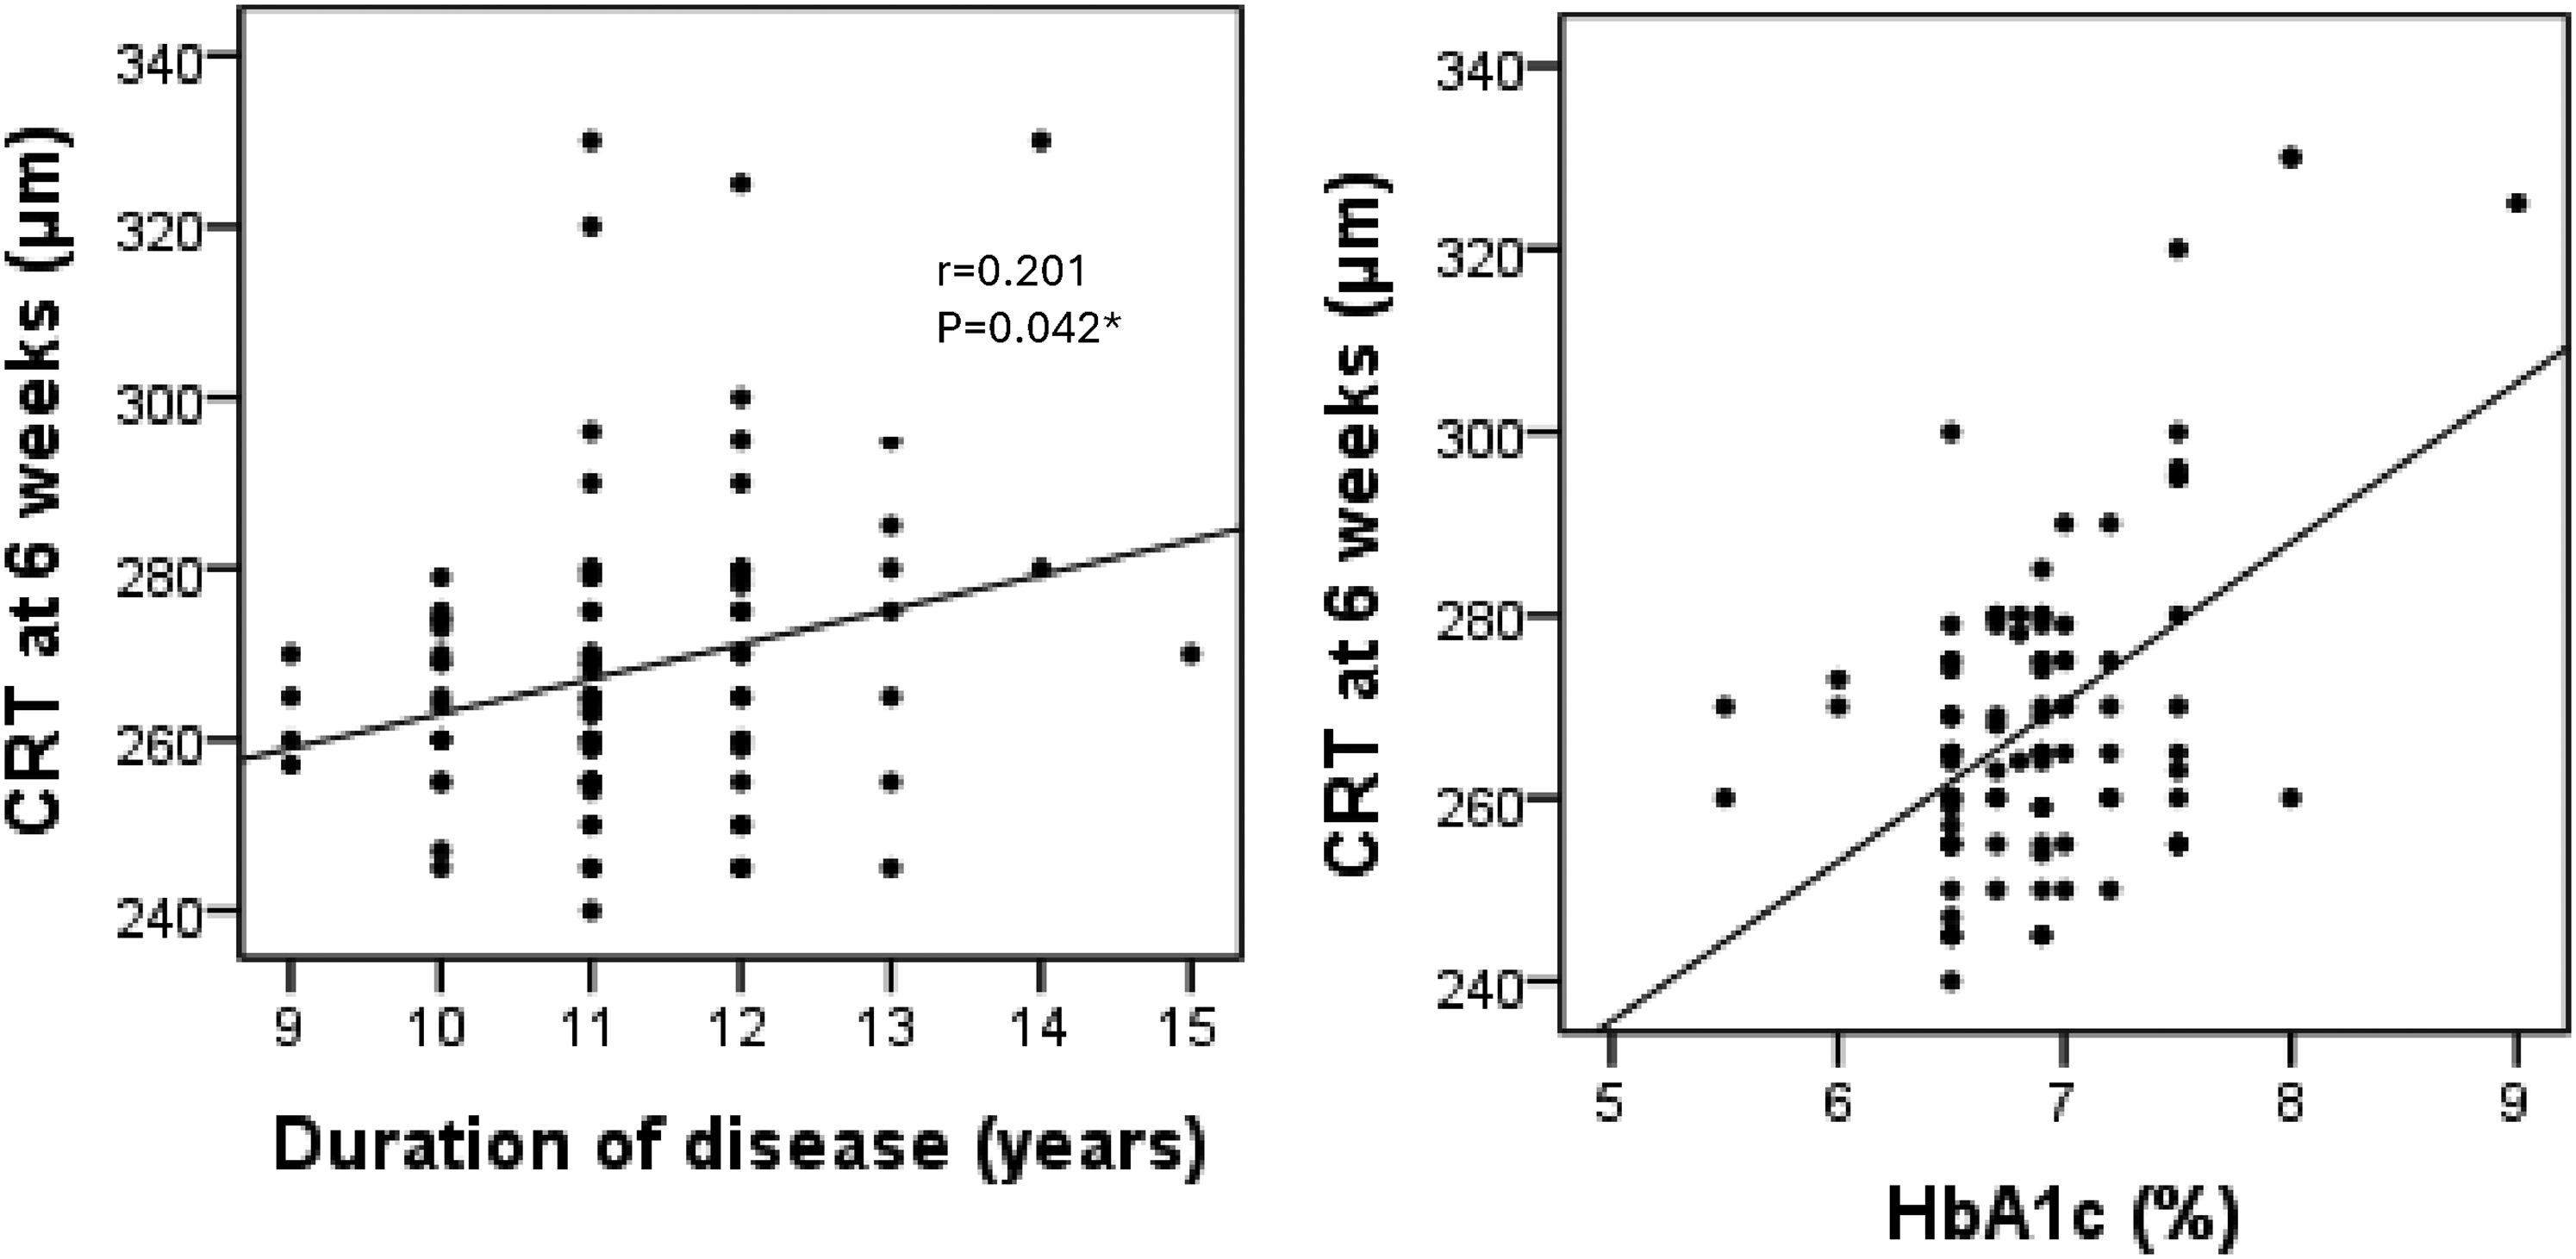
Correlations of CRT at postoperative 6 weeks and duration of diabetes and HbA1c.
Patients in Group II (with NPDR) were further divided into three subgroups based on DR severity (mild
Baseline characteristics stratified by severity of diabetic retinopathy.

Kruskal–Wallis test; bstatistically significant at p <0.05
CRT: central retinal thickness; BCVA: best-corrected visual acuity; HbA1c: glycosylated hemoglobin; OAD: oral antidiabetic drug; IQR: interquartile range
CRT changes stratified by severity of diabetic retinopathy.

CRT: central retinal thickness; IQR: interquartile range
CRT increased progressively with DR severity, peaking at postoperative week 6. Patients with severe NPDR demonstrated the highest CRT at both postoperative weeks 6 and 12, with statistically significant differences between the mild, moderate, and severe groups (p < 0.001 at postoperative 6 weeks; p = 0.010 at postoperative 12 weeks). In contrast to patients with severe NPDR, those with mild NPDR exhibited minimal increase in the CRT.
Discussion
Diabetes significantly increases the risk and progression of cataracts, making cataracts a major cause of visual impairment in diabetic patients. Although cataract surgery is effective, diabetic patients have higher complication rates than nondiabetic individuals. 14 Cataract surgery increases the risk of retinopathy progression and postoperative macular edema in diabetic patients. 8
This study assessed the short-term changes in CRT following uneventful cataract surgery in diabetic patients, with a specific focus on how varying stages of NPDR influence retinal response. Diabetic patients without previous DR (Group I) show postoperative CRT changes with statistically significant differences from baseline (p < 0.001). The CRT increased by ≥10 µm in 14 patients (27.5%) by postoperative week 6. Several studies have shown that even diabetic patients without retinopathy have a higher risk of developing postoperative macular edema.15,16 The British Retrospective Database (78,000 + eyes) was a large-scale retrospective cohort study that analyzed data from over 78,000 cataract surgeries in the United Kingdom to investigate the risk factors for developing postoperative macular edema. The key findings were that diabetic patients without any clinical signs of DR still had a 1.8 times higher risk of developing macular edema after cataract surgery compared with nondiabetic patients. 8
Consistent with these findings, in our study, patients with preexisting DR had a higher risk of postoperative increase in the CRT (Group II). Compared with that in diabetic patients without retinopathy (Group I), this difference was statistically significant at postoperative weeks 6 (p < 0.001) and 12 (p < 0.006) in patients with preexisting DR. CRT increased by ≥29 µm in 11 patients (21.6%), and 4 patients (7.8%) demonstrated an increase of ≥50 µm in CRT in Group II at postoperative 6 weeks. According to the study protocol, these 4 patients were withdrawn for another treatment available at the study center. All data obtained up to the time of withdrawal, including baseline, postoperative week 1, and postoperative week 6 measurements, were retained and included in the analysis. A similar increase in the CRT has been reported in diabetic eyes in earlier investigations.17–19
Moreover, Chan et al. 4 and Chu et al. 8 reported a higher risk of macular edema in diabetic eyes, particularly in the presence of retinopathy. Even though no patients in our cohort received prophylactic NSAID therapy, 20 the incidence of macular edema in Group I remained low, consistent with the established role of DR as a critical risk factor for macular edema.
Patients stratified according to DR severity demonstrated systemic differences at baseline (Table 4). Although the baseline CRT and BCVA acuity were comparable across mild, moderate, and severe NPDR groups, systemic metabolic parameters showed a clear severity-dependent trend. Specifically, longer duration of diabetes was significantly associated with more advanced DR stage, with patients in the severe NPDR group having the longest disease duration.
Patients with severe NPDR demonstrated the highest CRT values (Table 5), which peaked (median value: 285 µm) by postoperative week 6 and remained elevated till postoperative week 12. However, patients with mild or moderate NPDR showed smaller increases in the CRT, with partial resolution at postoperative 12 weeks. These results are consistent with previous literature, indicating that DR severity correlates with the degree of central retinal thickening.21,22
The highest postoperative retinal thickening observed in eyes with more advanced NPDR may be explained by the underlying metabolic and inflammatory vulnerability of diabetic retinal tissue. Chronic hyperglycemia promotes oxidative stress, AGE formation, inflammatory cytokine upregulation, and increased production of reactive dicarbonyl compounds such as methylglyoxal (MGO). 23 DR represents a complex metabolic–inflammatory retinal disease in which oxidative injury, lipid dysregulation, and inflammatory signaling pathways contribute to progressive retinal vascular dysfunction and disease progression. 24 Through activation of the AGE–RAGE signaling pathway, these mechanisms contribute to endothelial dysfunction, mitochondrial injury, inflammation, and progressive disruption of the BRB. Consequently, even uncomplicated phacoemulsification may result in inflammatory response and retinal thickening in eyes with more advanced diabetic microvascular disease. 23 These findings further support the importance of OCT monitoring and perioperative risk stratification according to DR severity, particularly in patients with advanced NPDR who may require closer postoperative follow-up monitoring. Early identification of postoperative retinal thickening may support earlier management of clinically significant DME, including the initiation of anti-vascular endothelial growth factor (VEGF) therapy. 25
In our study, CRT increased, peaking at 6 weeks after cataract surgery. Previous reports have also shown that the incidence of macular edema peaks approximately 4–6 weeks after uneventful cataract. 26 Despite increased CRT, no statistically significant differences were observed in the postoperative BCVA between patients with and without DR (p = 0.265).27,28
Furthermore, longer duration of diabetes and higher HbA1c were associated with higher CRT values at postoperative week 6. Our study confirmed the hypothesis that certain risk factors can influence CRT changes after uncomplicated cataract surgery in diabetes patients.
Yung et al. demonstrated that longer duration of diabetes and HbA1c levels are risks for macular edema in diabetic patients after cataract surgery; they have reported an increase of ≥40% in foveal thickness and a reduction of ≥20% in macular sensitivity. 29 Furthermore, Kanzlers et al. showed that preoperative HbA1c levels are an independent risk factor for CRT increase 1 month after cataract surgery. 30 In contrast, Denier et al. reported that glycemic control (as reflected by HbA1c levels) or duration of diabetes do not influence the postoperative increase in CRT; this result can be attributed to the low number of patients included in their study. 13
Study limitations
Although the sample size was adequate to detect significant differences between the groups, it remains relatively small and was conducted at a single center. The follow-up period was limited to 12 weeks, and the study focused only on short-term CRT changes. Although this timeframe captures the typical peak period for postoperative macular thickening, it may not reflect long-term outcomes. Although systemic factors such as HbA1c level and diabetes duration were analyzed; other important variables, such as lipid profile, renal function, hypertension, 31 and inflammatory biomarkers, were not included. Additionally, no prophylactic NSAIDs were administered as part of the study protocol. Although this study helped isolate the natural postoperative response, it does not reflect routine clinical practice where NSAIDs in combination with steroids are often used to reduce the risk of macular edema.
An increase in CRT often reflects accumulation of fluid in the retina, which may lead to macular edema, the most common cause of poor visual recovery after successful cataract surgery. According to Baker et al., a real-world follow-up of diabetic eyes (without macular edema) undergoing cataract surgery reported a 4% incidence of central-involved edema, with elevated CRT measured using OCT, identifying cases even before symptoms appear. 15
Although we reported the mean phacoemulsification time as a measure of surgical duration, we did not account for the total phacoemulsification energy delivered during the surgery. Since cataract density varies among patients, particularly according to the LOCS III classification, the use of phacoemulsification energy may provide a more accurate assessment of the surgical impact on postoperative retinal changes. Future studies should consider including phacoemulsification energy as a parameter to better account for cataract density variations.
Another limitation of our study is that although most participants were on OADs, detailed data regarding the specific subclasses used, including peroxisome proliferator-activated receptor gamma (PPAR-γ) agonists such as thiazolidinedione were not collected. These agents are reported to contribute to or worsen macular edema in diabetic patients, which could potentially influence postoperative CRT changes. 32
Conclusion
Cataract surgery in diabetic patients is associated with measurable changes in CRT, mostly in those with NPDR. Our study revealed that CRT changes peak at approximately 6 weeks postoperatively, with the greatest increase observed in patients with severe NPDR. Consistent with previous reports, we consider this period as representing the highest risk for postoperative macular edema. Importantly, no significant short-term decrease in BCVA was observed. High-resolution SD–OCT proved valuable for detecting subclinical CRT changes. Moreover, systemic factors, including longer duration of diabetes and higher HbA1c levels, were associated with greater CRT increases, illustrating the influence of both ocular and systemic risk factors in postoperative retinal changes.
Footnotes
Acknowledgements
We express our sincere gratitude to Dr Tahir Ahmed, Associate Professor at the National University of Sciences and Technology (NUST), Pakistan, and Dr Sadia Anjum, Associate Professor at the University of Hail, Saudi Arabia, for their valuable assistance in preparing this research article. We also acknowledge the use of artificial intelligence tools for refining the language of the manuscript. AI tools were used for language improvement.
Ethical approval
Ethical approval for this study was granted by the Institutional Ethics Committee of University Clinical Center of Republic of Srpska (No 01-19-238-2/22, date: 13 July 2022), and the study was conducted in accordance with the Declaration of Helsinki, 1964.
Consent
Informed consent was obtained from all participants in accordance with the guidelines of the Declaration of Helsinki.
Authors’ contributions
Sasa Smolianovic Skocic, Sanela-Sanja Burgic, Rakan M Algorinees, and Shog K Alahmed contributed to the conception, design, data collection, analysis, and drafting of the manuscript. All authors critically reviewed the content, approved the final version for submission, and agree to be accountable for all aspects of the work.
Funding
This study did not receive any specific grants from funding agencies in the public, commercial, or non-profit sectors.
Declaration of conflicting interests
The authors declare no potential conflicts of interest with respect to the research, authorship, and/or publication of this article.
Data availability statement
All relevant data are included in the manuscript.