
Abstract
Supervised deep learning (DL) receives great interest for automated analysis of microscopic images with an increasing body of literature supporting its potential. The development and testing of those DL models rely heavily on the availability of high-quality, large-scale data sets. However, creating such data sets is a complex and resource-intensive process, often hindered by challenges such as time constraints, domain variability, and risks of bias in image collection and label creation. This review provides a comprehensive guide to the critical steps in data set creation, including (1) image acquisition, (2) selection of annotation software, and (3) annotation creation. For image acquisition, besides ensuring a sufficiently large number, it is important to address sources of image variability (domain shifts), such as those related to slide preparation and digitization, that could lead to algorithmic errors if not adequately represented in the training data. For annotations, key quality criteria are the 3 “C”s: correctness, consistency, and completeness. For mitigation of annotation bias of a single annotator, this review explores advanced annotation methods (eg, computer-assisted annotations). To support data set creators, a standard operating procedure is provided as supplemental material, summarizing all important considerations for data set creation. Furthermore, this article underscores the importance of open data sets in driving innovation and enhancing reproducibility of DL research. By addressing the challenges and offering practical recommendations, this review aims to advance the creation and availability of high-quality, large-scale data sets, ultimately contributing to the development of generalizable and robust DL models for pathology applications.
Keywords
Deep learning (DL)-based automated image analysis (DL-AIA) is emerging as an important tool that promises to extract relevant information from microscopic images in an accurate, reproducible, and efficient manner. In fact, there is a substantial body of literature demonstrating the high effectiveness of DL-AIA for solving various pathological tasks.22,25,51,60,109,132,142 In these studies, supervised DL is a particularly popular approach, where a model is trained to recognize patterns based on input data (ie, microscopic images) and map these to predefined output labels corresponding to the pattern of interest. Depending on the model architecture and type of output data, algorithmic predictions can range from image classification (ie, classifying the entire image into categories, such as the tumor diagnosis) 51 to object detection (ie, predicting the location of objects of interest, such as mitotic figures, within an image) 22 to segmentation (ie, classifying every pixel in the image to determine whether it belongs to an object of interest, such as the area of nuclei or tumor tissue)60,140 and thereby allowing for a wide range of histologic use cases.
The availability of high-quality large-scale data sets, which comprise images along with their metadata and a collection of labels for each image or object of interest, are the precondition for development of supervised DL models and for testing their performance.21,23,144 However, creating such data sets is challenging considering the time investment needed for creation and the risk for biases associated with image collection and label creation.64,101,106,133 Insufficiently constructed data sets are recognized as a major source of errors in algorithms.48,144 For example, a survey of toxicologic pathologists revealed that two of the three most common reasons why proof-of-principle studies of DL-AIA tools failed are due to (1) small data set size and (2) insufficient data set quality. 106
This review discusses all relevant steps of data set creation for supervised DL and provides recommendations to ensure high data set quality and quantity. A derived standard operating procedure (SOP) for data set creators, covering all relevant steps, is provided as Supplemental Material. Another goal of this article is to summarize open data sets with veterinary samples that have been made publicly available to researchers and may foster future DL-AIA development.
For this article, we have defined different types of data sets and their subsets, as listed in Figure 1. 26 The primary data set (comprised the training, validation, and test subsets) is essential for model development and testing; thus, it is needed for all AI projects. Images of the primary data set are typically collected within one process and are split into the different subsets (see below) after label creation, or, for example, when active learning is used (see below), before label creation. The training data set provides the input data and output labels needed to update the DL model weights during training iterations. 144 At regular intervals during the training, the validation data set is used to evaluate the model’s progress on “unseen” images (ie, images held out from the process of updating weights), guiding decisions to avoid underfitting (ie, the model has not yet sufficiently learned the relevant features and training should be continued), or overfitting (ie, the model has begun to memorized the training examples and further training deteriorates performance). Model validation using the validation data set should not be confused with clinical validation of a diagnostic test; therefore, some authors have used alternative terms for this data set, such as “tuning set.”46,142 The term tuning set is, however, uncommon in the field of machine learning and can likewise be misleading since the model’s parameters are also tuned during training. Once the final model is selected (based on performance criteria on the validation set), its generalization performance is evaluated through statistical metrics and visual assessment on the hold-out test data set (ie, images not used for development), which is intended to be an independent representative of real-world data for the algorithm’s application. 21 Generalization performance measures whether the model is appropriate for predicting the patterns of interest on unseen data or whether it has learned features overly specific for the development data set. 21 The primary test set has typically the same image characteristics as the training data set. Since some studies use alternative terminology (such as interchanging the definition of validation and test data set),42,79,117 care must be taken when reading articles regarding the used terminology and purpose of the subsets.
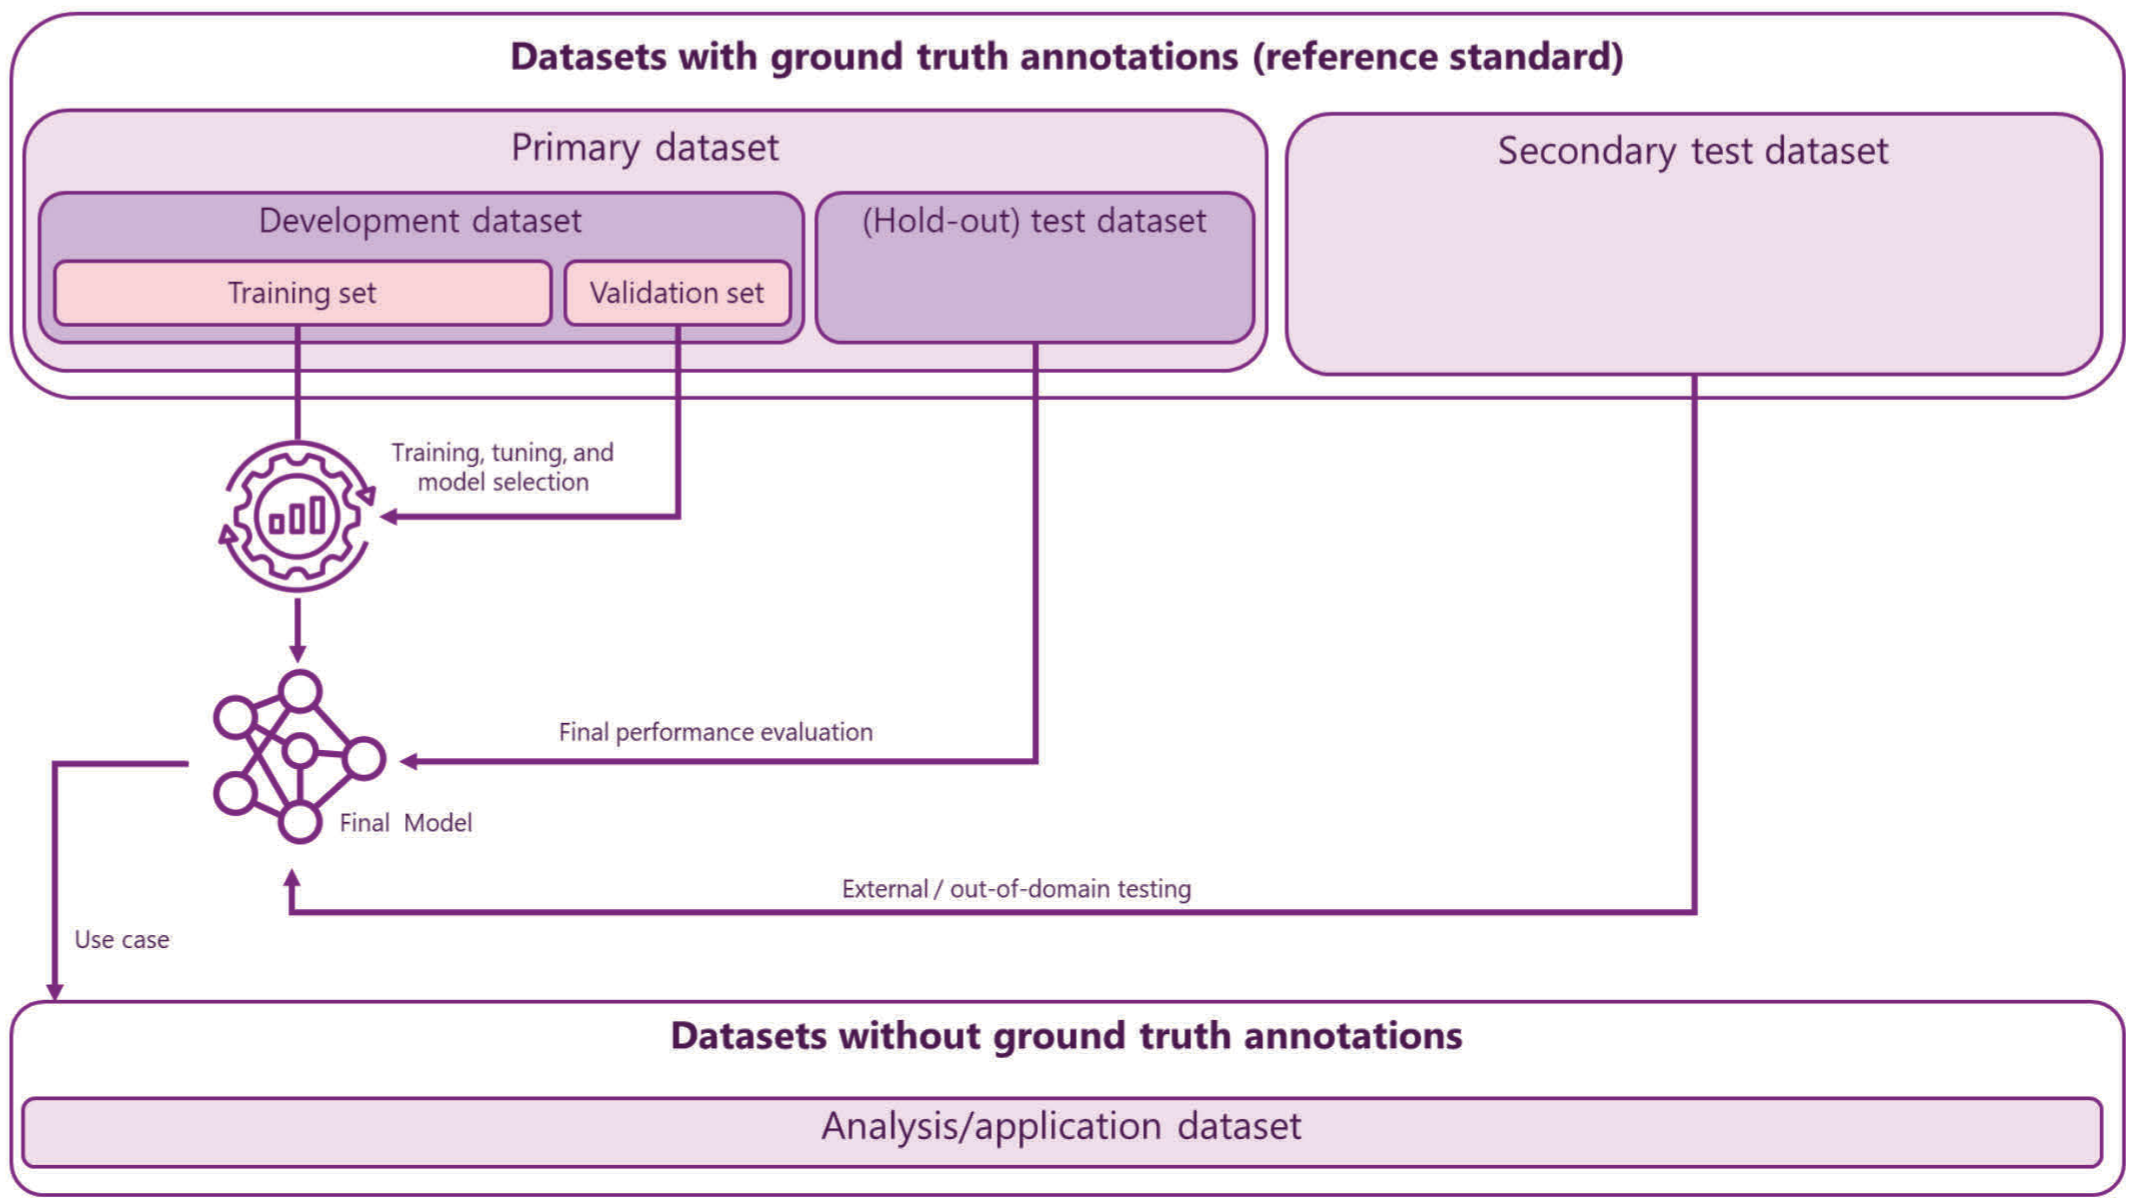
Comparison of different types of data sets and their subtypes along with their role in development, performance evaluation, and application of deep learning models. The primary data set is the essential data set for model development and testing. It is typically developed in one process and split before model development; thus, the hold-out test set usually has the same image characteristics as the development set (in-domain-testing). A secondary test data set is developed independently from the development data set and thus has a lower risk for spurious correlations, improving the reliability of performance evaluation. Depending on the source of images and the included domains (in comparison with the primary data set), the secondary data set may be used for external or out-of-domain testing. While this review article does not specifically address the analysis (or application) data set, it defines the use case (target domain) and therefore needs to be considered when deciding the image variability needed in the primary and secondary data sets.
Images of the secondary test data sets are produced separately from the primary data set, either by the same laboratory at a different time point 22 or by a different laboratory. 11 Thereby, secondary test data sets reduce the risk for spurious correlations of the images between development and testing (such as highly consistent color from the same staining batch), which verifies the algorithmic performance with increased reliability or evaluates the transferability to other laboratories (robustness; see below). Annotations are needed for this data set to allow for the calculation of statistical performance metrics. 64
The analysis data set is composed of the images to which the final model will be applied to generate meaningful biomedical predictions in research or diagnostics. This data set does not include ground truth annotations, but when used for research it includes tertiary metadata, eg, patient outcome or data for clinicopathological correlations. While the analysis data set is not necessarily created through the process discussed below and will not be discussed in this review, it defines the use case and thus determines the target domains and real-world variability required within the other data sets, in particular the test data sets. 64 The analysis data set may include the same images of the primary and secondary data sets; however, it cannot include images/cases from the development data set.
Some authors distinguish between internal data sets (ie, primary data set derived from within a single organization) and external data sets (ie, data set derived from another organization), which are typically used in the context of secondary test data sets and performance evaluation.21,105 The benefit of external data sets for performance evaluation is that there is less likely a spurious correlation with the training data (as compared with internal data sets), considering the independent source of cases (possibly different patient demographics and different frequency of entity subtypes based on the laboratory specialization) and independent image creation. Thereby, external data sets, in theory, allow a more reliable performance evaluation. However, this terminology of external testing might convey a wrong impression for three reasons. First, it may be beneficial, depending on the intended use case of DL-AIA, to include data from multiple laboratories in the primary data set64,144; thus, “internal” data may not necessarily represent a narrowly defined domain. Second, the likelihood of data independence is not the only difference between internal vs external data sets; different laboratories may also have a distinct image “signature” related to their individual workflow (see below). Thus, a drop in performance between internal and external test data sets cannot alone be attributed to data independence. Third, external data sets are often annotated by a different group of experts, which may introduce label shifts compared with internal data, again negatively impacting the ability to compare the measured performances. Instead, this review article discusses a similar concept for different image sources by using the term “domain,” focusing on the image “signature.” A domain is defined as the context of image creation that goes beyond the organization (eg, specific image characteristics related to a specific laboratory, such as staining composition) 45 and includes aspects such as animal species, disease entities, sample preparation, and digitization devices/settings (see the next section and Fig. 2 for more details). Primary test sets are “in-domain,” ie, have the same image characteristics as the development data set. Secondary test data sets are often “out-of-domain” (ie, have distinct image characteristics), which is useful to evaluate the robustness of DL models under specific domain shifts.
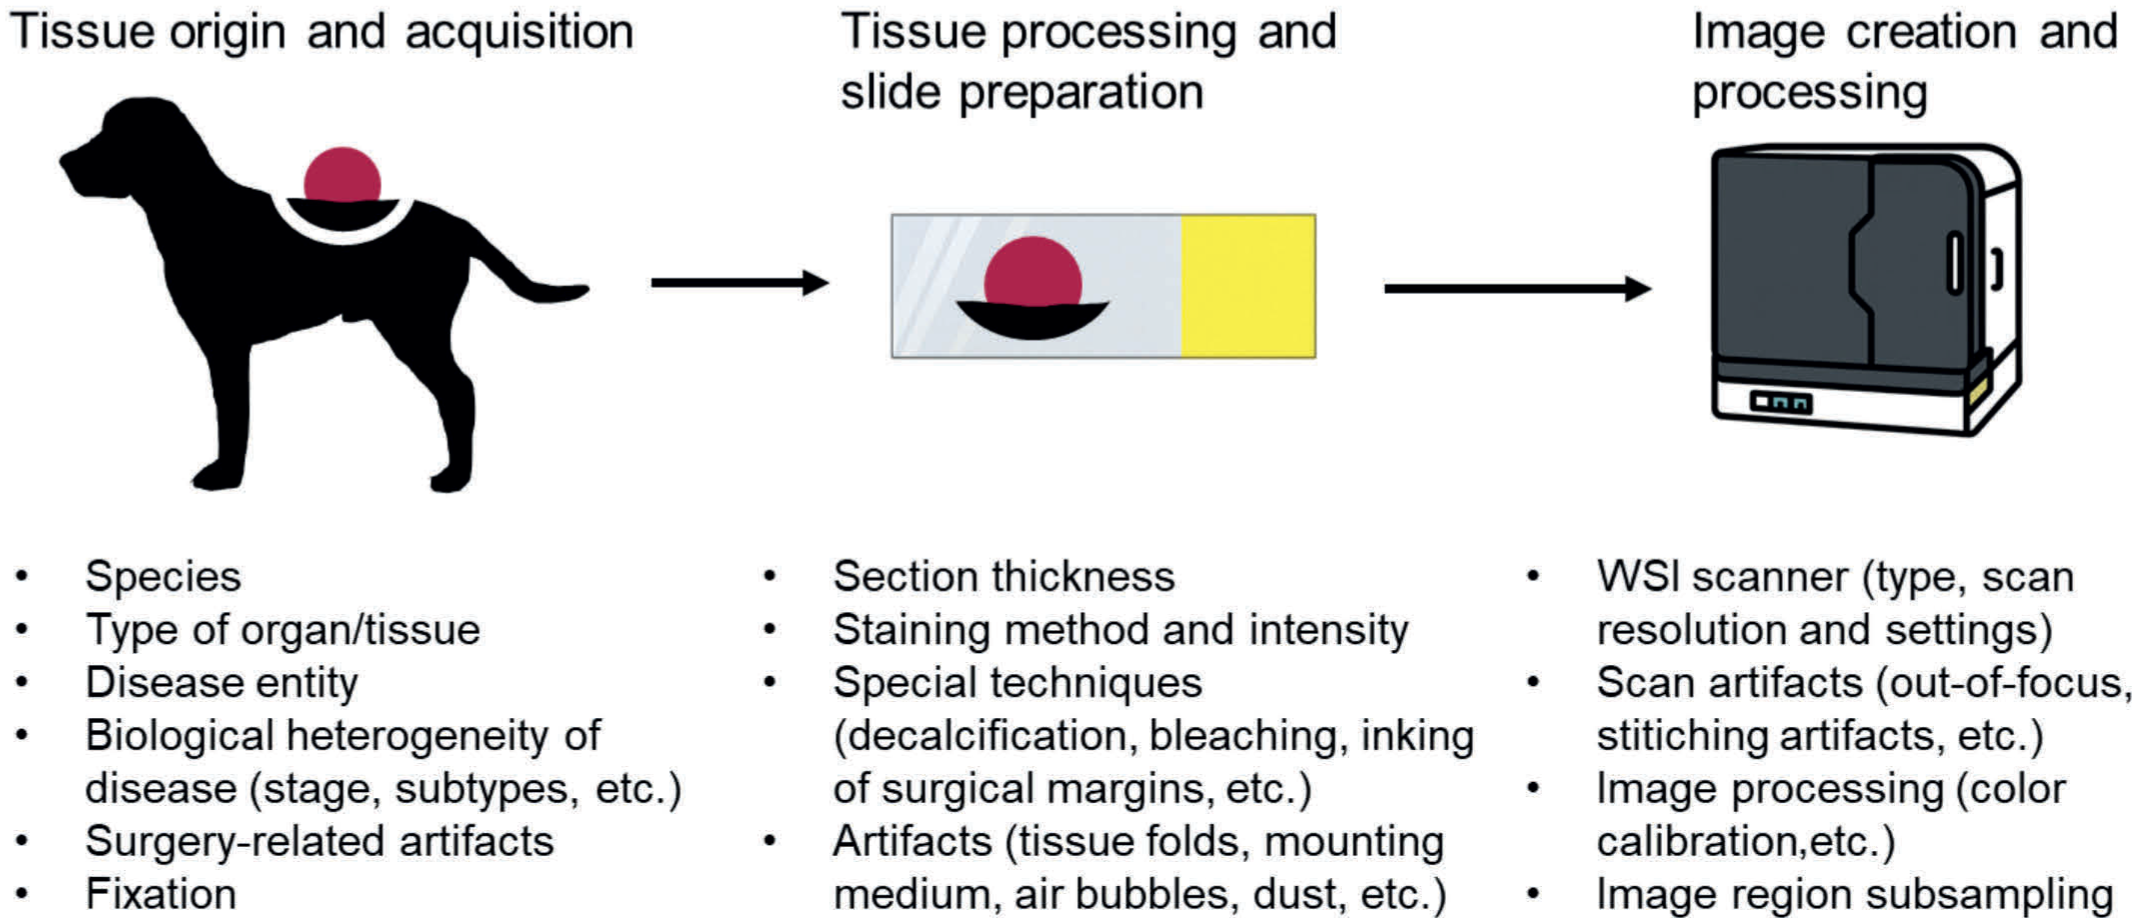
Steps of the laboratory workflow that may characterize a specific image “signature” (domain). These aspects are potential sources of image variability that might impact the algorithmic performance, if not included in the training data, due to a domain shift. Data set developers should consider these sources of image variability when selecting cases for the data set based on their variability expected in the application data set. WSI, whole-slide image.
Before discussing the three main elements of data set creation—(1) images, (2) annotation software, and (3) annotations—it is important to note that there is no one-size-fits-all approach to data set creation. Data set creators must make individual considerations and cost-benefit trade-offs based on (1) the pathology task (eg, expected degree of error in human annotations), (2) the selected pattern recognition task (eg, required level of annotations) and algorithmic approach, (3) the intended use case (eg, DL-AIA intended for entire whole-slide images [WSIs] or only “perfect” regions of interest), and (4) the available resources (ie, laboratory resources and time availability of expert annotators). This article summarizes the various data set–creation methods applied in existing literature, reflecting the various project-specific requirements, and also makes recommendations for minimal standards. We hope that the subsequent section will provide readers with the knowledge to take these considerations into account when making decisions regarding data set creation.
Images
WSI scanners are increasingly integrated into routine workflows of veterinary pathology laboratories; therefore, WSIs are readily available for DL-AIA. As WSIs are the most common image type used for data set creation in current veterinary pathology literature, this article will focus on WSIs. Other digitization devices (such as cameras mounted on light microscopes or mobile phones attached to the ocular) and nonlight microscopy imaging modalities (such as gross images or electron microscopy images) are not specifically addressed in this review due to the paucity of research in this area; however, many of the considerations addressed below are applicable to these modalities as well.
Key considerations for image sets are the following:
Sufficiently large number of images and total tissue area annotated encompassing an adequate number of patterns of interest and background patterns, possibly stratified by subgroups.
Sufficiently large image variability, which is representative for the intended use case (target domain: species, organs, biopsy types, disease entities, and subgroups, image signatures of laboratories). The decision on the area per annotated region of interest (entire WSI of fewer cases vs smaller regions of more cases) and the number of regions per image should be based on the intercase and intraimage variability).
Inclusion of all relevant metadata for each case (eg, patient/case information and image creation characteristics), ideally following a systematic ontology and standardized terminology.
The selection of appropriate cases is critical, and clear inclusion and exclusion criteria should be defined that align with the intended use case of the DL-AIA. For example, inclusion of glass slides and/or WSIs from multiple laboratories may be considered to increase variability (see below).12,13 Software for automated quality control processes, such as HistoQC, may help to identify unsuitable images with pronounced artifacts or other outlier features.36,68 While these quality control tools are undoubtedly valuable for application data sets, caution should be exercised when removing cases with realistic artifacts and image variability from the primary data set. Image exclusion may be done when the image quality interferes with annotating the images with sufficient accuracy, and when images of poor tissue quality will also be excluded from the analysis data set. 101 In fact, it may be advantageous to intentionally oversample certain artifacts to improve the models’ ability to distinguish them from the pattern of interest (see below).
Determining the total number of cases to include is almost impossible in advance, as there are no established methods to predict how many images are required to achieve the target algorithmic performance. The necessary data set size depends, in the first instance, on the complexity and morphological variability of the pattern of interest (eg, a larger training data set may be required for detection of mitotic figures than for renal glomeruli), as well as other structures present in the images (eg, apoptotic cells as imposters for mitotic figures). Up to a certain point (when performance plateaus), models follow data scaling laws (ie, the more training data, the higher the performance); however, this is specific for the task, prohibiting general data size recommendations. There are generally 2 strategies—(1) maximal approach: include as many cases as can feasibly be annotated within the available time and resources, aiming for the highest possible algorithmic performance 23 and (2) iterative approach: begin with a small training data set, then incrementally add more images as needed to reach the desired performance, typically focusing on those image features that are problematic for preliminary DL models. While concentrating on particularly difficult regions may reduce the amount of training data required (and thus the annotation budget; see below), this approach requires repeated model training and sufficient computational resources. For this second approach, it is essential to establish a sufficiently large test data set starting at the first iteration, otherwise reliable performance evaluation and an informed decision on the improvement over data set iterations are not possible. Another factor that may influence the data set size is the model architecture used. As compared with general purpose pretrained networks (eg, pretrained on ImageNet) that require end-to-end training, histopathology foundation models (ie, large-scale models pretrained using self-supervised learning on vast amounts, diverse, histopathology-specific data sets) promise to achieve high performance levels while requiring significantly less training data.5,35 Related to their semantically rich feature vectors, foundation models can be adapted to numerous downstream image analysis tasks with minimal additional training using linear probing or low-rank adaptation. While foundation models have been shown to achieve outstanding performance and improve transferability to out-of-domain data sets, even with limited training data for the downstream task, they still follow general data scaling laws (ie, more data improves performance) and show domain-specific dependencies5,18,120,125,141; thus, the relevance of an appropriate training data set (even if smaller than for other model types) should not be neglected. Most studies using foundation models focused on image classification; therefore, the performance and data scaling of foundation models for other pattern recognition tasks (eg, object detection and segmentation) are less well known. Apart from training data set quantity, foundation models require data sets with the same quality criteria of annotations, as discussed in the section below, and a large-scale test set for the same rigorous performance evaluation, as discussed in other articles.21,64
Although it may be convenient to include multiple samples from the same patient, such images are unlikely to introduce the same degree of variability as images from different patients; thereby providing less benefit for model development and testing. It also needs to be considered that images from the same patient, even if they originate from different tissue blocks or cytologic smears, can only be part of one data subset (training, validation, or test data set), due to the high similarity. Data leakage, ie, distribution of data from the same patient across data subsets, would lead to overly optimistic performance evaluations 32 and must be avoided.
Image Variability and Domain Shift
Beyond the sheer number of cases, it is important that the images encompass the variability expected for the intended application (target domain), both for the pattern of interest (foreground) and for other background patterns present in the images. 144 It is well-known that DL models can learn biological and technical features specific to the image batch(es) of the training data (hidden variables).11 –13,53,64,65,76,85,144 Models often fail to predict the pattern of interest if the image features differ too greatly from those presented during training (covariate domain shift). This image variability is related to the multi-step process of image creation, encompassing tissue acquisition, tissue processing, slide preparation, image creation, and image postprocessing, which often leads to a batch and laboratory specific image signature (Fig. 2).13,53,65,76,119,144 While there are several approaches to dealing with image variability, this section focuses on “natural augmentation” of the data set, thereby curating a diverse data set to support models intended for a broad target domain (as opposed to a narrow scope: eg, a single laboratory, a single tumor type, etc). Other approaches, not discussed here further, include (1) narrowing the target domain by image normalization to known physical features (eg, color characteristics) of a reference or color calibration across scanners, (2) diversifying the training images during model training (image augmentation/transformation using color and contrast adjustments, image distortion, rotation, or synthetic augmentation), (3) and specifically tailored training strategies. 67 Whereas these tricks have been shown to improve model performance,7,12,69 neither of them can fully circumvent all sources of domain shift and some may introduce new bias. Thus, it remains compulsory to include natural images of all relevant domains in the test sets.
Images from different species, including humans, often do not appear to cause major domain shifts, since tissues and cell morphologies are often similar.8,59,92,93 However, caution is warranted for disease entities with species-specific features, for instance, the differing distribution of mammary carcinoma / breast cancer subtypes between dogs (with numerous mixed tumors) and humans, or the differences between red blood cell morphology between mammals and nonmammalian vertebrae with nucleated cells.
The included images should reflect the natural biological variability of tissue morphology.64,85 This includes the need to represent all relevant disease entities, with potential oversampling of rare subtypes to counteract class imbalance. 144 DL models usually do not generalize well across disease types (such as different tumor types) if they (or similar domains) were not included in training.12,13,72 For example, a model trained to classify colon images as benign or malignant tumors showed a nearly 50% drop in performance when applied to the same task for breast and prostate tissue. 72 A mitotic figure object detection algorithm trained exclusively with soft tissue sarcoma images dropped in performance from an F1-score of 0.70 to 0.49 when applied to lymphoma cases (images from same laboratory and scanner), whereas the in-domain performance for lymphoma was F1 = 0.79. 13 In contrast, a DL model that was trained with multiple tumor types was able to detect mitotic figures with high performance in previously unseen tumor types, showing the higher robustness of models when trained with a diverse data set. 13 For example, models trained with multiple tumor types, but without soft tissue sarcomas, achieved an F1 = 0.65 in soft tissue sarcoma images, whereas other models that were trained with soft tissue sarcomas and other tumor types had an F1 between 0.67 and 0.69, ie, only 2 to 4 percentage points higher. 13
Even within the same tissue section/images, variability exists (intraimage variability). Consequently, it is an important consideration whether entire WSIs, individual tissue fragments, or smaller regions within an image should be annotated, balancing time available for annotation and the expected degree of variability between image regions. For example, a tumor section may contain hundreds of thousands of nuclei, and it is neither feasible nor sensible to annotate all of them. However, the selected image regions should—depending on the intended application of the algorithm—not only include ideal (from the diagnostic standpoint) tumor regions but also more challenging regions, like necrotic or inflamed tissue, adjacent normal tissue, and image artifacts, to ensure adequate model generalizability. For mitotic figures, it has been shown that a model trained only on ideal (pathologist-selected) regions of interest with a size of 10 high-power field (2.0–2.37 mm2) can effectively detect mitotic figures in similar regions, but may perform poorly in other image areas (eg, fatty tissue, thermal artifacts from cautery, or inking).10,13 Thus, such an algorithm is not particularly suited to analyze entire WSIs and identify the tumor regions with the highest mitotic density. The size of regions of interest may be justified through the pathology task (eg, 10 high-power fields/2.0 mm2 for mitotic figures object detection), 13 density of objects of interest, and by the time invest for annotations of each region (eg, only half a high-power field for tumor nuclei segmentation).60,66 Given a fixed annotation time budget and, at the same time, the intention to maximize tissue variability, it is often advantageous to select relatively smaller regions of interest, but to sample several regions per image (from different tissue locations) and more cases in the data set.
Considering that there are everyday differences in slide preparation, particular attention should be given to producing samples across multiple batches (ie, at different time points) to ensure realistic variability in tissue processing steps, such as section thickness and staining composition, unless the model is intended solely for use in a highly controlled laboratory environment. It should be ensured that cases from all relevant image subgroups are distributed across the batches. As an alternative to the creation of new slides, images from a WSI archive may be used, which naturally includes the real-world variability across the retrospective sample inclusion period. 74
Different WSI scanners (see Patel et al 108 for a summary of the different scanners) have been identified as a significant source of domain shift in studies that digitized the same test slides with multiple scanners.11,109,139 For example, a study on tumor segmentation models reported a decrease in the mean intersection over union (mIoU) of 0.38 percentage points when comparing test set performance of the in-domain scanner (mIoU = 0.82) with that of out-of-domain scanner (mIoU = 0.44). 139 Another study, evaluating a model that segmented lymph node tissue from the surrounding fatty tissue, demonstrated a significant drop in performance when trained on one scanner and tested on another, with performance decreasing by a factor of 4 (in-domain Matthews correlation coefficient [MCC] = 0.81; out-of-domain MCC = 0.18). 75 While WSIs from different scanners exhibit obvious differences in color distribution (Supplemental Figure S1), 139 image postprocessing methods intended to counteract this source of variability, such as extensive color augmentation (increasing variability in the training set) or image normalization (reducing color variability), do not fully restore performance.11,56 This indicates that WSIs from different scanners differ not only in color representation (and image resolution) but also in other features, possibly related to hardware (such as optics) or scanning methods (eg, depth of field, tile stitching, and noninclusion of nontissue areas that contain artifacts such as dust).108,139 There are clear recommendations to use multiple scanners for data set creation, if the derived model is intended for a widespread application across multiple laboratories/studies.11,144
The degree of algorithmic bias (performance drop related to a domain shift) of the other potential sources of domain shift listed in Fig. 2 has not, to our knowledge, been systematically evaluated. Whereas it is well-recognized that different laboratories produce different staining results, 45 it is, to our knowledge, not well understood if default color augmentation or normalization methods during training can fully overcome this laboratory variability. In human medicine, several studies on AI models for classifying hematoxylin and eosin (HE) images based on mutational patterns have demonstrated significant performance differences among images from different demographic/ethnic groups, related to underrepresentation of patients from certain demographic groups in training data sets (demographic bias). 127 Whether comparable differences exist among animal breeds remains unknown. Until further research reveals the impact of these unexplored variables, it may be advisable (depending on the intended application of the DL-AIA algorithm) to include these in data sets and particularly in test subsets.
Figure 3 illustrates examples of false algorithmic predictions produced by a mitotic figure detection model when applied to arbitrary tumor regions of WSIs. The detector follows a standard anchor-free object detection paradigm based on the FCOS (fully convolutional one-stage object detection) architecture 126 and was trained on the MIDOG++ data set, 13 which is, to our knowledge, the largest and most diverse open resource for mitotic figure detection, spanning multiple tumor types, species, scanner vendors, and laboratory origins. Despite this diversity, the data set consists of ideal, pathologist-selected regions of interest (2.0 mm2) that are rich in viable tumor cells and contain only few artifacts. When deployed to less curated regions, the model becomes more sensitive to technical and biological artifacts that were previously unseen in training. Dust particles on the slide (Fig. 3a, b), out-of-focus areas (Fig. 3c, d), sebaceous glands and other nonneoplastic structures (Fig. 3e, f), cautery artifacts (Fig. 3i, j), and surgical ink deposits (Fig. 3k, l) can all exhibit dark, hyperchromatic profiles that closely resemble the shape of mitotic figures. Similarly, cells in underrepresented tissue types, such as chondrocytes in cartilage (Fig. 3g, h), superficial keratinocytes (Fig. 3m, n), and necrotic debris (Fig. 3o, p), mimic texture and intensity patterns learned by the detector, especially when the surrounding cellular morphology is degraded or missing. The principal causes of these false algorithmic predictions are (1) a domain shift between the “ideal” training regions and the more heterogeneous data of other region in the WSIs, (2) the presence of nontumor or low-quality tissue that was underrepresented in the training data, and (3) genuine morphological ambiguity between mitotic figures and certain artifacts or cell death phenomena. This underscores the need for training data sets and model designs that explicitly account for such technical and biological variability when the model is intended for whole-slide inference.
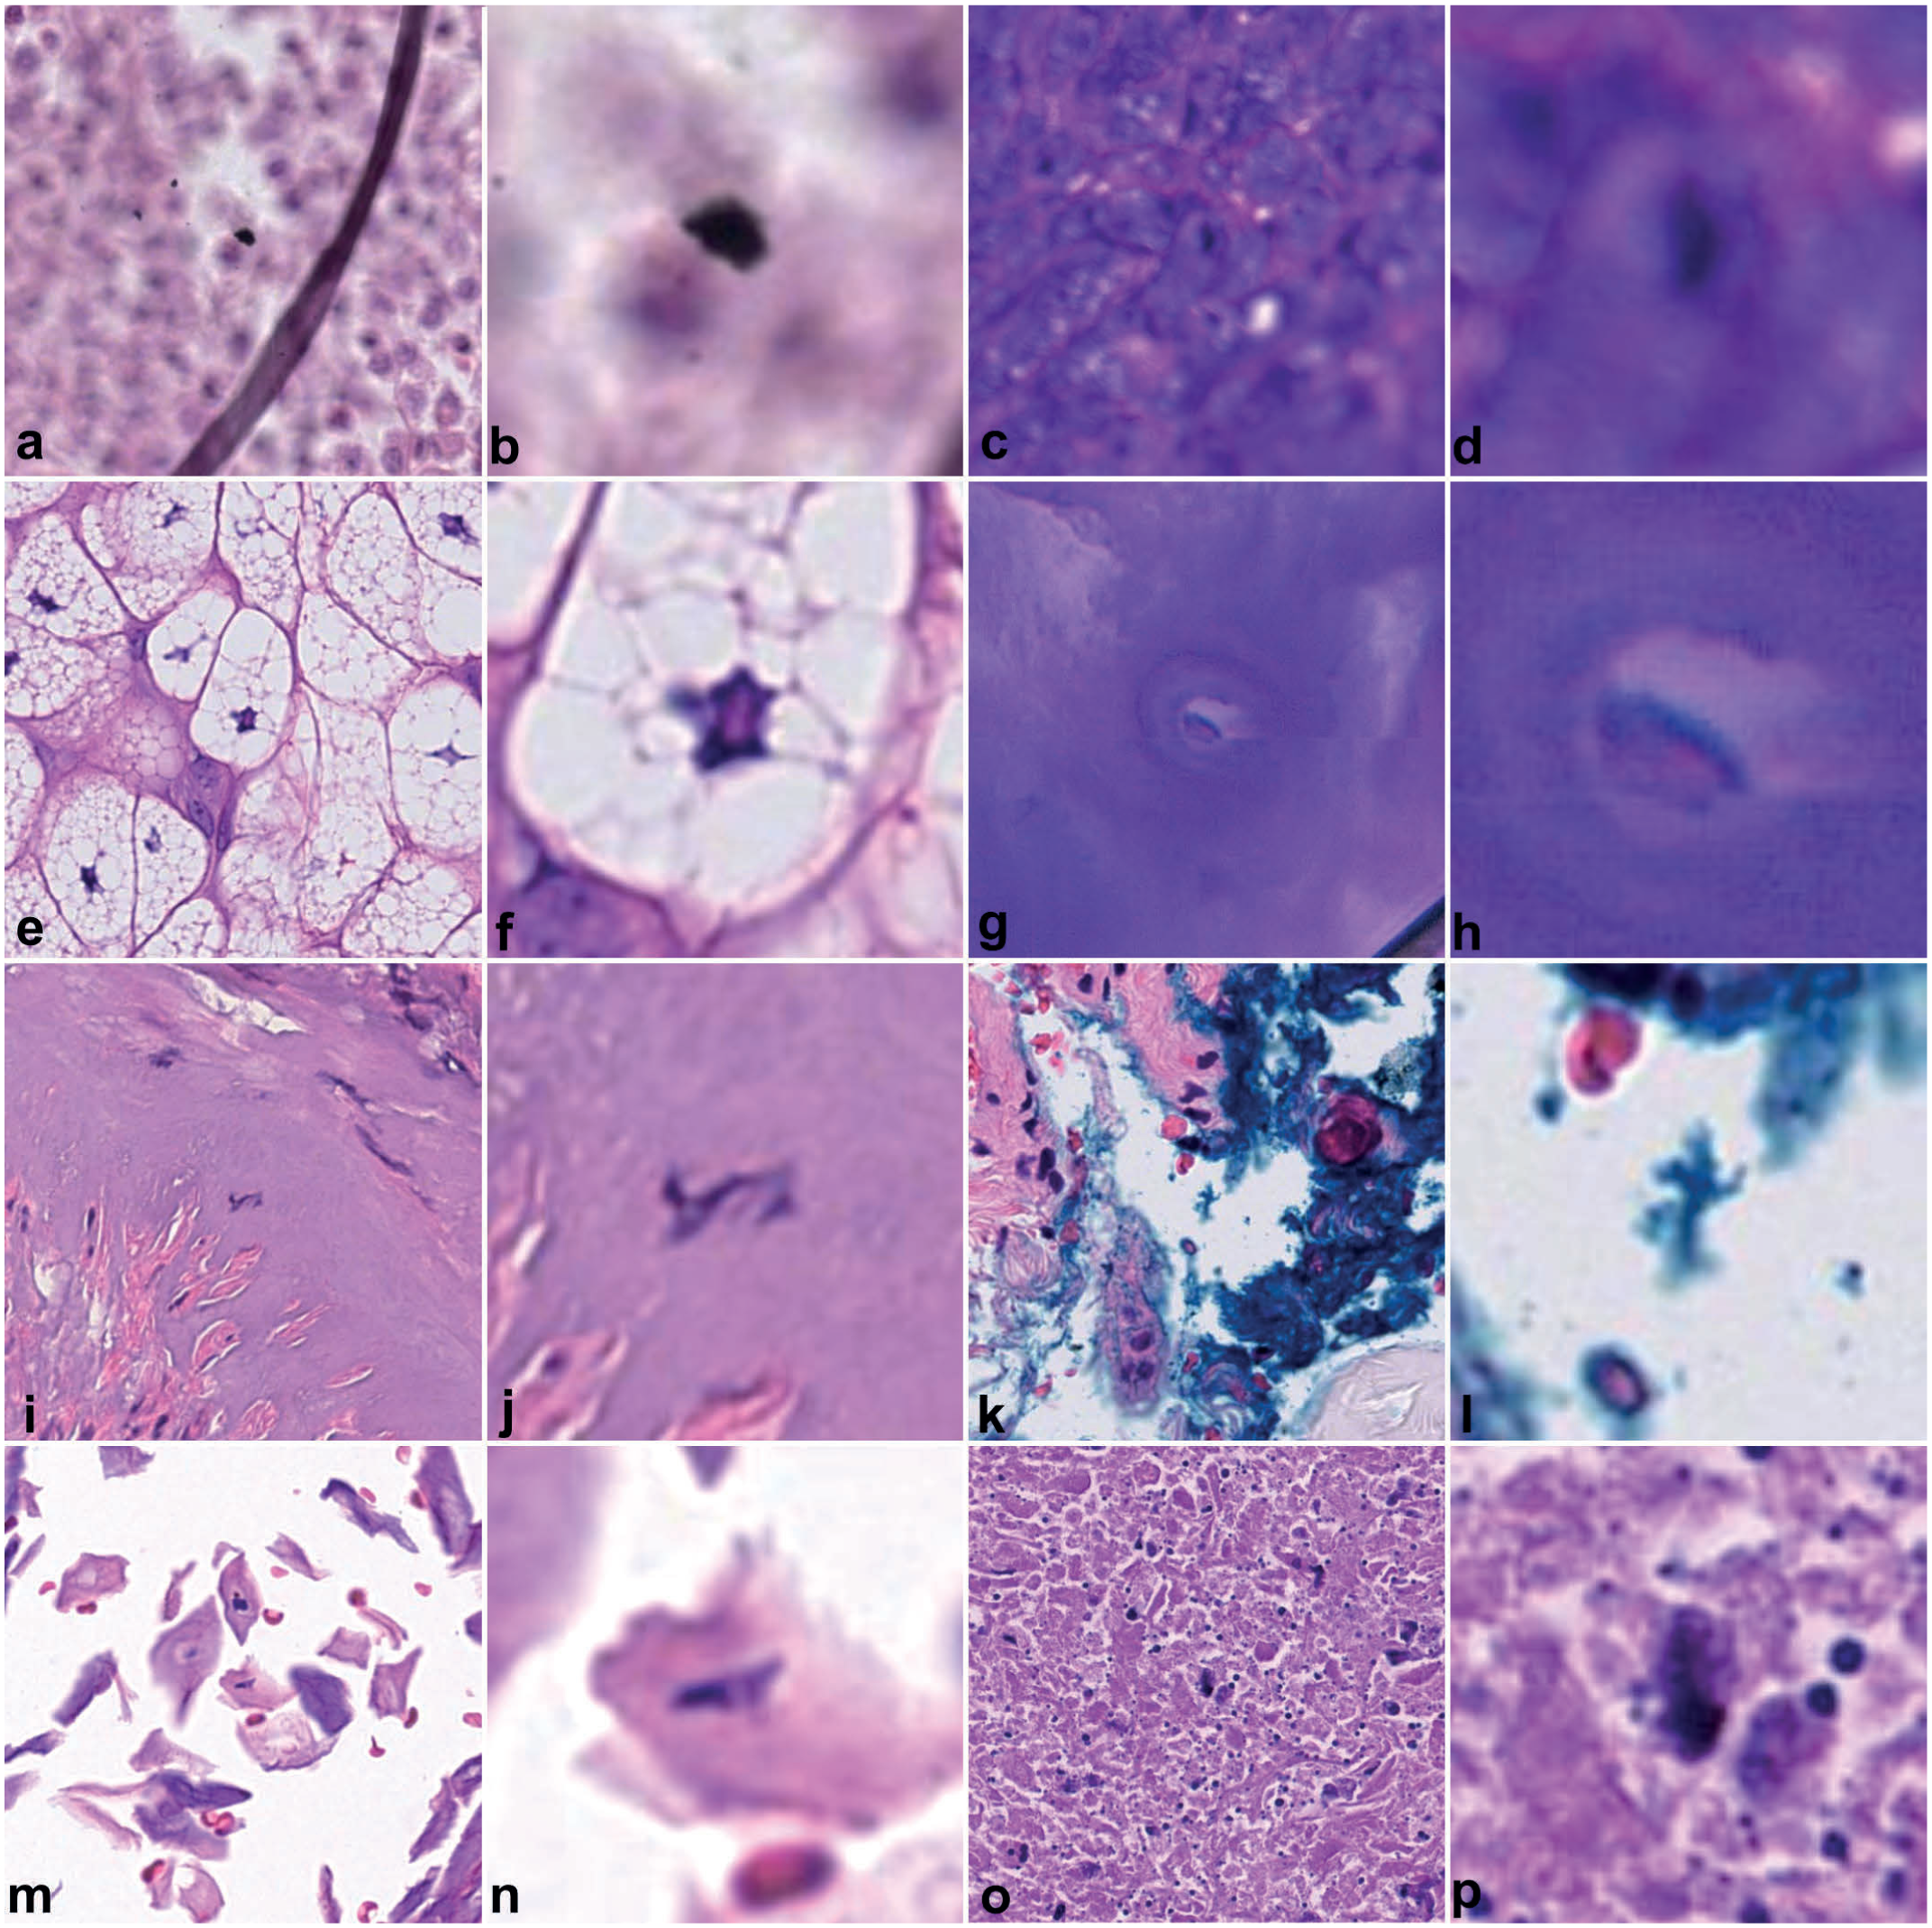
Examples of biological and technical variability of images between training and test data sets that have caused false algorithmic predictions for detection of mitotic figures. The object detection model (based on the FCOS architecture 126 ) was trained with the open-access MIDOG++ data set, 13 which only consists of hand-picked, “ideal” tumor region; thus, not completely covering the variability experienced in an entire whole-slide image. A panel shows either the broader tissue context of the hematoxylin and eosin-stained image or the model’s false prediction highlighted in the corresponding zoomed-in panel next to it. (a, b) Dust. (c, d) Out-of-focus. (e, f) Sebaceous glands. (g, h) Chondrocyte in cartilage. (h, i) Cautery artifacts. (k, l) Ink. (m, n) Keratinized epithelial cells. (o, p) Necrosis.
The final question is how to measure image variability. This knowledge can help data set creators prioritize which images to focus on, under the assumption that more diverse images provide the most meaningful information for training. For example, annotators may have access to 1000 WSIs but only enough time to label 100; the goal could be to select those images that will lead to the most diverse subset. The practicable approach is to analyze the image metadata (eg, disease subgroups, types of WSI scanners, etc) and randomly sample within each category. A more sophisticated approach is to use quality control metrics 49 or learned embeddings of a feature extractor 130 and subsequently encode images into a continuous space where semantically similar samples are nearby. Visualization of this space (eg, t-distributed stochastic neighbor embedding) and unsupervised clustering (eg, k-means) can reveal meaningful subgroups related to image variability.49,130 In the example above, investigators could form 10 clusters based on the embeddings and select 10 cases from each cluster for annotations. Similar approaches can be used to support splitting of the primary data set and quantify the domain shift between the primary and secondary data sets.
Time Efficient Data Set Creation
For most data sets, the most time-consuming step is the creation of annotations, particularly when object- or pixel-level labels are required, whereas the creation and curation of microscopic images is often comparably quick. However, there is an inherent association between the number of images (depending on the size and area annotated per image) and the time invested in annotations. Therefore, there are also specific image creation methods that can reduce the burden for creating annotations.
Transferring annotations to further multi-scanner registered images
For data sets that include scans of the same slide from multiple WSI scanners, image registration and subsequent transfer of annotations is a viable option.50,94,139 The concept of multiscanner-registered data sets is that each glass slide is digitized with multiple whole-slide scanners, but annotations are created only on a single reference-scanner image. These annotations are then spatially transferred to the corresponding images from other scanners, which enables realistic scanner-based “natural augmentation” of training data and enables cross-scanner performance evaluation. A prerequisite for this method is accurate registration between the reference-scanner images and the images from the additional scanners, ensuring that annotations map to the corresponding pixels. Because the same glass slide is scanned by all devices, the relevant differences are scanner-related and may include (besides the intended factors of domain shift such as color distribution and depth of field) positional offsets, different resolutions and a 90° rotation. Unlike consecutive tissue sections, variations in the tissue (such as elastic deformation or tissue loss) or glass slide (air bubbles, etc) should be the same between images (if scanned within a short period of time and properly cleaned before scanning), which simplifies the registration process. 47 Various open-source software for image registration are available,47,94 but rigorous visual quality control is essential, and manual fine-adjustment may be needed for some images. 11 A challenge of this method is that cellular structures may be in different focal planes across scanners, leading to a loss of diagnostic detail in the out-of-focus image and requiring alignment of annotations, eg, by a careful filtering scheme. 50
Minimizing the annotation effort by prioritizing most informative images (active learning)
Imagine having access to a large pool of unlabeled images but only a limited budget for expert annotation. Active learning can help determine which images should be prioritized. The main concept is to iteratively augment an initial data set by selecting images or image regions that are expected to contribute most to model training (Supplemental Figure S2). 135 For WSIs, region-based active learning is typically used, in which only small informative regions within a WSI are proposed.83,98,110,111 A comprehensive summary of active learning methods for medical imaging is provided by Wang et al 135 ; here, we offer a brief overview. After training an initial DL model (using a small seed data set), the unlabeled image pool is evaluated to estimate the informativeness each image or image region would provide if annotated and added to the data set. Informativeness can be defined through model uncertainty or diversity in image representativeness.110,135 Based on this informativeness metric, images or image regions are selected using a defined sampling strategy. The simplest strategy is to choose images in decreasing order of informativeness according to the available annotation budget, although more sophisticated strategies are recommended. 135 Of note, region size and the number of proposed regions per WSI/optimization circle may impact performance curves and effectiveness of an active learning pipeline. 111 Once selected, the images are annotated (using one of the numerous methods described below) and added to the data set. This loop (ie, selecting unlabeled images, annotating them, and updating the model) is repeated until the annotation budget is exhausted or the target performance level is reached. Prior studies have shown that active learning improves algorithmic performance for microscopic images compared with passive learning under equivalent annotation budgets.83,110,111 While active learning can be highly valuable for reducing the time required to create a training data set, it should not be used for test set construction to avoid biased image selection. Instead, an independent, application target-aligned test set should be constructed (eg, based on case metadata and quality control metrics) before running any active learning loop.
Some publications, in particular when commercial AI software was used, have used an image region selection process extremely similar to active learning.20,63,96,117 These studies have likewise used an iterative process of data set creation, but combined it directly with model development. Instead of using a separate model for predicting the informativeness function, the intermediate models were used to predict the pattern of interest and visual quality control by a pathologist has guided the decision to include specific image region (ie, these regions with a particular high degree of error). These studies also typically combine the active learning-like approach with computer-assisted annotations by verifying or revising model predictions in the new images (see below).
Increasing image variability through synthetic data
Synthetic images (also known as fake, simulated, or artificial images) are generated by computers in a way that they resemble real images. 107 Synthetic data is not produced from actual patient tissue samples; however, real data or mathematical models are used to guide the generation of synthetic images. Unlike conventional data augmentation techniques (eg, geometric or color transformations), which modify existing images during model training, synthetic images represent entirely new samples and can therefore provide higher-level diversity. Numerous methods exist for generating synthetic images, as summarized by Pantanowitz et al, 107 with the most common approaches for microscopic images relying on generative adversarial networks (GANs) or diffusion models. An alternative to learning-based generative models was described by Mill et al, 100 who developed a rendering-based approach that allows direct control over numerous image attributes (eg, color distribution, cell morphology, connective tissue content, and artifact frequency). This fully parametric approach enables controlled, interpretable generation of images with any desired degree of variability (Supplemental Figure S3). Depending on the method used, the ground truth labels can be generated alongside with synthetic images, 107 in which case synthetic data can be generated in conjunction with model development (ie, after data set creation). This also means that pathologists (annotators) are not necessarily involved in synthetic data creation, even though it may be beneficial to have a pathologist visually confirm the realistic appearance of the artificial images.
The primary benefit of synthetic data is the augmentation of training data without requiring slide production and annotation. Once computational pipelines for image synthesis are established, large numbers of images can be produced at scale. Synthetic data can increase variability in the pattern(s) of interest 17 and/or transfer a new reference style to the existing images (eg, simulating the appearance of a different scanner). 104 Useful applications include scenarios with limited access to real images (such as rare diseases or data-protection restrictions), substantial class imbalance, or limited annotation resources.17,44,143 For example, Banerjee et al 17 used conditional GANs to generate synthetic images for classifying normal versus atypical mitotic figures, motivated by the rarity of atypical morphologies among all mitotic figures (class imbalance). Another example is a public synthetic data set of nuclei in human breast cancer comprising 20,000 image patches and 1,448,522 nuclei annotations—quantities that would be unrealistic for expert annotation. 44 These studies show that synthetic data can be beneficial on model performance when only moderately-sized human-annotated data sets are available.17,44,100,143 However, several limitations of synthetic images derived from generative models must be considered.107,144 First, the variability of synthetic data depends on the diversity of the real data used to train or parameterize the generator; therefore, synthetic data is less valuable when based on a narrow or limited reference data set. Generative models are known to suffer from mode collapse, ie, only cover a part of the data distribution used for training.33,77 Thus, synthetic data does not eliminate the need for at least a moderately-sized traditionally annotated data set. Second, despite becoming increasingly realistic, synthetic images may contain subtle artifacts (such as checkerboard patterns, blurring, or excessive smoothing), that may be difficult for humans to detect but can bias DL models.64,144 For this reason, test data sets must consist entirely of real images, 64 whereas synthetic data may only supplement training sets. Furthermore, synthetic data sets should always be clearly labeled to avoid misuse.
Annotation Software
There is a variety of user-friendly annotation software, including both proprietary/commercial software (mostly combined with DL development frameworks; not listed in this article) and free open-source software (Table 1).9,16,19,57,81,82,86,89,99,134 Data set creators need to choose software that supports viewing the image, allows for the efficient creation of annotations in the intended manner (see the next section), and generates data sets with a meaningful, reusable structure for AI development. 133 For proprietary software with integrated model development tools, it is important to ensure that it is possible (as it is for all open-source software) to extract the data set in a meaningful format to allow for long-term storage and reuse in other projects. Most software are designed for a broad scope of annotation applications using microscopic (or even a wider range of biomedical) images,9,19,57,81,86,89 while others have been developed for specific annotation tasks.16,82 For example, SWAN enables swipe-based patch classification using a mobile device, allowing pathologists to annotate in offsite locations. 16 The annotation tool TissueWand is specialized for tissue wand polygon annotations using a mouse or pressure-sensitive stylus, ie, a linear annotation is dragged in the center of the object and the annotations automatically spreads to the object borders. 82 PatchSorter focuses on two-dimensional annotation maps that clusters similar images patches in close proximity (generated with DL), which speeds up patch classification. 134
Comparison of relevant features of a selection of open-source annotation software.
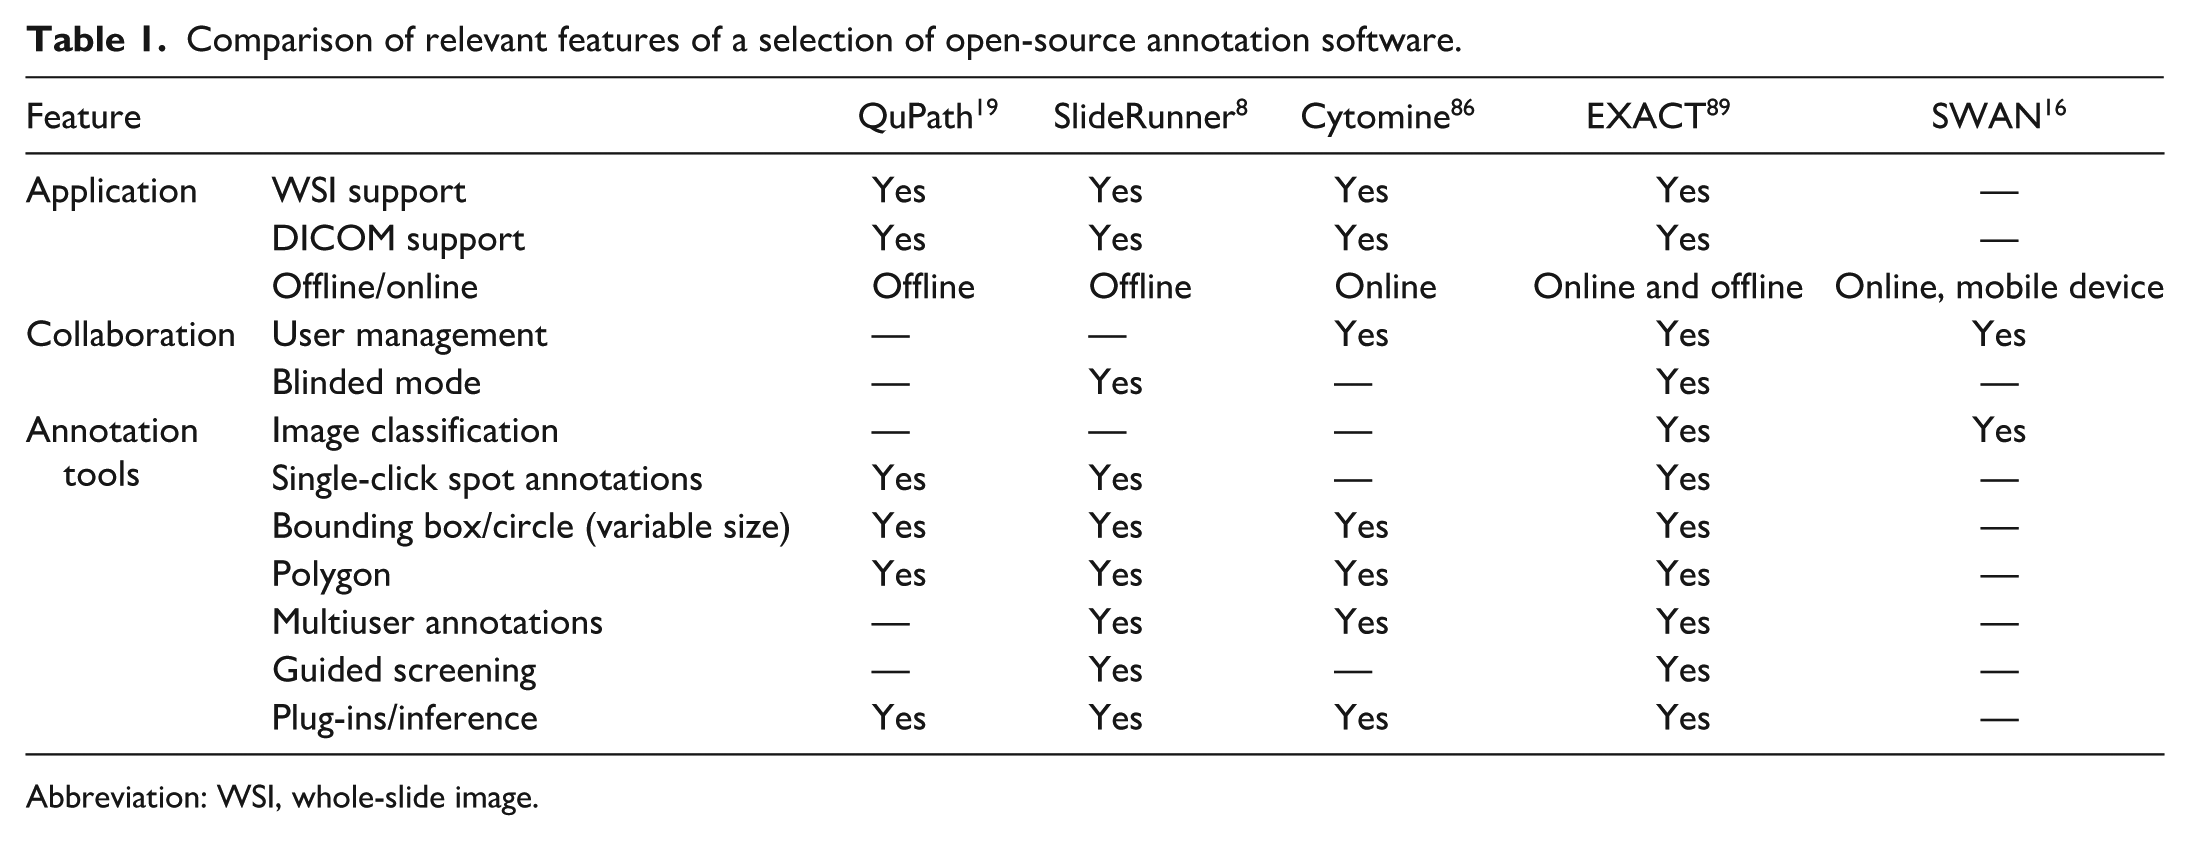
Abbreviation: WSI, whole-slide image.
Whereas most annotation software can open a variety of image types (including gross photographs and cellphone pictures through the microscope ocular), WSIs and z-stack WSIs are those with the highest requirements for viewing software. WSIs are not only extremely large files, but they also contain a pyramidal structure and most WSI vendors use their own proprietary file format. Most open-source annotation software use open-source libraries, eg, OpenSlide (https://openslide.org/), SlideIO (https://github.com/Booritas/slideio), or Bio-Formats (https://www.openmicroscopy.org/bio-formats/), which allow opening most WSI formats.9,19,89,108 However, some vendors use proprietary formats that cannot be opened directly by vendor-independent software (eg, Philips iSyntax) and therefore require conversion before use.38,108 Based on one study, the file type is not expected to markedly impact algorithmic performance. 72 However, there are ongoing efforts to harmonize WSI formats, such as the adoption of the DICOM (digital imaging and communications in medicine) format, which will facilitate standardization and interoperability across different software platforms and data exchange.38,57 While DICOM is not yet widely utilized by data set creators, 102 an advantage is that application-specific metadata is embedded within the WSI.
One of the main differences between annotation software lies in whether they are offline (mostly desktop-based)9,19 or online (mostly web-based).16,57,81,86,89,99,134 Offline software is easier to set up for a standalone installation but offers limited collaboration capabilities (eg, simultaneous annotations by multiple pathologists). Online platforms, on the contrary, share images by accessing a server, allowing collaboration with partners outside the organization while maintaining data privacy and protection through user management (eg, secure user authentication, individual user rights and access), metadata encryption, and prohibition of image download. The collaborative nature of online platforms also benefits from version control to ensure traceability of changes. When multiple annotators are involved in data set creation, it is critical that each annotation is linked to an annotator ID to support auditability, quality control, and interannotator agreement analyses.
Depending on the pattern recognition task for the DL model, annotations need to be created at different levels. The software may allow different annotation shapes at the image level for image classification, at the object level (spot annotation, rectangle or circle at a fixed or variable size) for object detection, and at the pixel level (polygons or tissue wand polygons) for segmentation. Time-efficient and accurate labeling should be facilitated through standard features (eg, single-click annotation and keyboard shortcuts) and more advanced features, such as guided screening, blinded mode, and plug-ins.9,89 The guided screening mode is particularly useful for large images (with many fields of view) to ensure complete annotations without skipping image regions.9,89 In this mode, the large image is divided at a self-defined zoom level into patches of the size of the viewing field (with some percentage overlap), and the annotator is navigated through these patches sequentially. In the blinded mode, other annotators do not see the label class of annotations, which may be used for unbiased multi-expert majority voting. Plug-ins are essential for visualization or image analysis and are often used for computer-assisted labeling or registration of two images (eg, immunohistochemistry [IHC]-assisted labeling, see below).89,99,134 Many of the more recent annotation software focus on algorithmic support during annotations and thereby provide innovative tools to increase label efficiency (see annotations section).89,99,134
Annotations
When annotating, a label is assigned to the image or objects of interest within an image, and these labels are considered the ground truth (also referred to as reference standard), which serves as the desired output value during training and as the reference in the validation and test data sets for evaluating whether algorithmic predictions are correct or wrong. The ground truth represents the concept of truth generated by the most suitable method (gold standard method), balancing time investment with the following key quality criteria, the 3 “C”s:
Highest possible
Highest possible
Highest possible
The ground truth method can be defined as interpretation by humans (manual annotations), humans supported by algorithmic suggestions (computer-assisted annotations), fully computerized annotations (see subsections below), or a superior method. For most pathology tasks, the gold standard had been considered to be trained pathologists. However, human annotators are known to have well-recognized visual and cognitive biases, which can result in an imperfect ground truth.1,43,113,114 For particularly challenging pathology tasks, human error of a simple single-annotator data set can be significant enough to create a catch-22 situation: while a DL model may be developed with the objective to improve the diagnostic ability (ie, to be superior than a pathologist), it is trained with a noisy ground truth, leading to instability in model convergence, and tested against noisy ground truth, leading to an unreliable performance evaluation.21,71 Harada et al 61 examined the impact of labels errors (noise) on a tumor segmentation model. They artificially altered ground truth annotations by dilation and shrinking (contour incorrectness), omission (incompleteness) and addition, or a random combination thereof (inconsistency) and clearly showed a negative impact on model training. Furthermore, they showed that when these artificially induced label noises were also present in the test set, the true performance was significantly overestimated or underestimated (depending on the type of noise) as compared with the actual ground truth. It is important to note that a true (error-free) ground truth does not exist for most pathology tasks; however, we recommend placing strong emphasis on high quality of labels (in particular for the test data sets), which can be achieved by a well-planned annotation workflow and numerous advanced annotation methods, as discussed in this section (Table 2).
Comparison of annotation methods that can be used to generate labels for microscopic data sets.
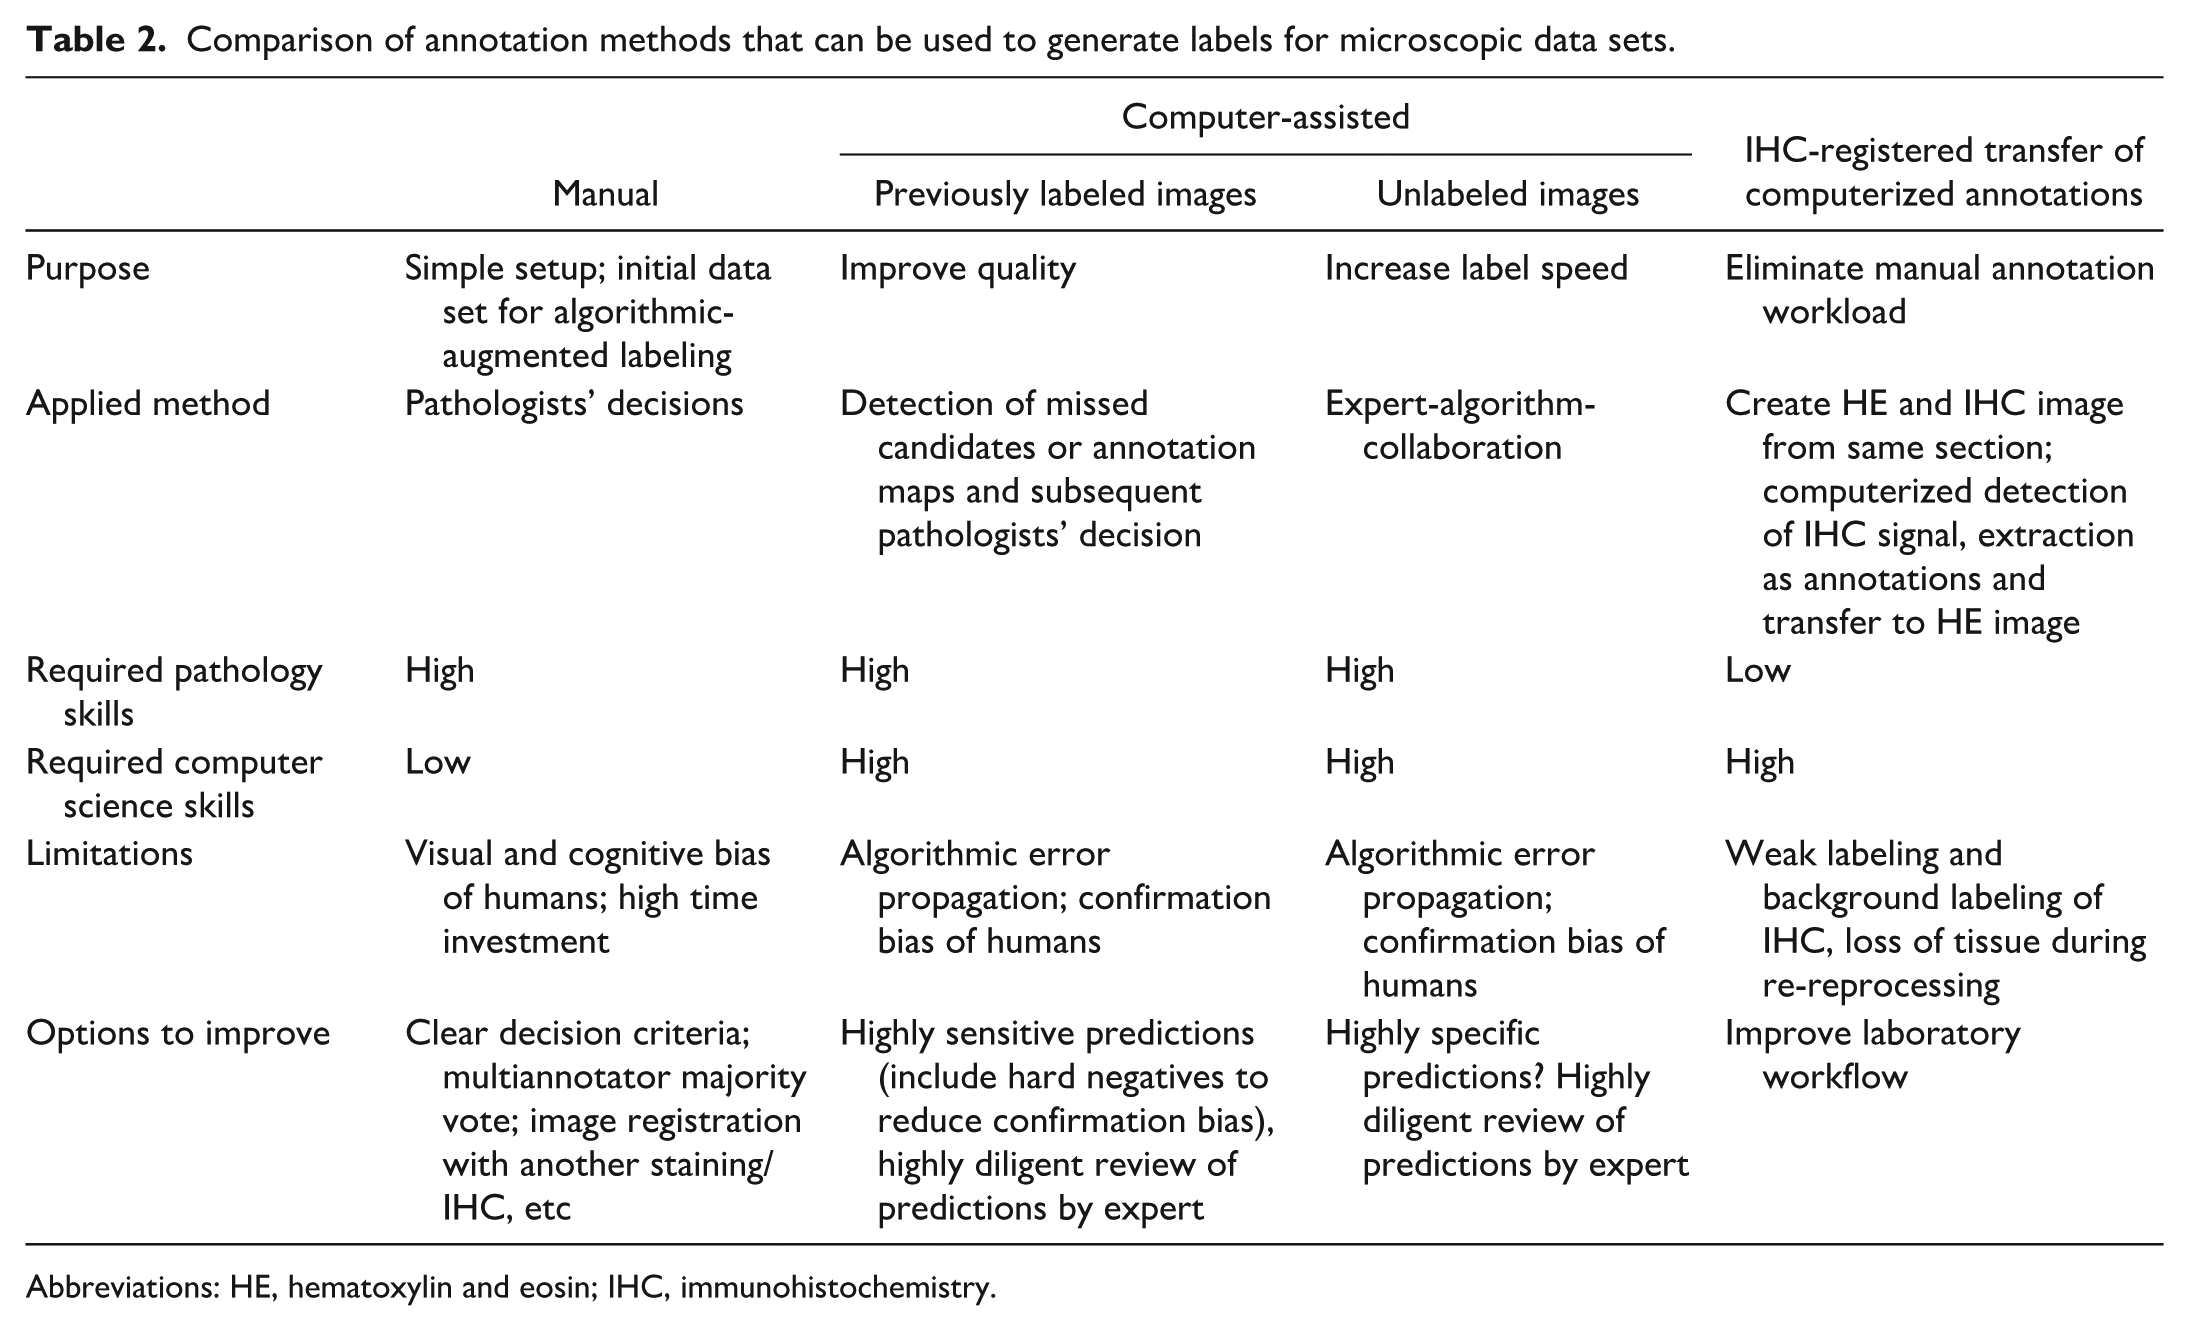
Abbreviations: HE, hematoxylin and eosin; IHC, immunohistochemistry.
The 3 “C”s (correctness, consistency, and completeness) are meant to stimulate thoughts on possible sources of label errors and means of reducing these errors (as discussed in the annotation methods below), even though they are partially overlapping concepts (Supplemental Figures S4–S6). Correctness indicates if the annotated pattern truly represents the pattern of interest, and thus, if the derived algorithm will have a biologically meaningful application. For example, if a data set for mitotic figures includes a lot of false annotations of necrotic and apoptotic cells (look-alikes), the developed model, regardless of state-of-the-art DL methods and a seemingly high performance on the likewise biased test set, will overcount nonmitotic objects and might subsequently not be able to discriminate patients with short and long survival times. For segmentation tasks, accurate object contours (as opposed to oversegmentation or undersegmentation) need to be considered. For example, it might be difficult to accurately delineate an equine sarcoid from surrounding dermis or to delineate nuclei in neoplastic mast cells when they are partially obscured by metachromatic granules. 60 Inconsistencies are random error in the data set that introduce “confusion” during training and uncertainty in performance evaluation. For example, annotators are inconsistent if telophase mitotic figures with beginning separation into the two daughter cells are sometimes annotated as one object and other times as two objects (the latter also being a biologically incorrect label approach). Completeness indicates if all the objects of interest were annotated or if there were unintentional omissions. For example, if a test set with 100 mitotic figures only includes annotations for 80 of these, a perfect algorithm would have a measured performance of F1 = 0.89% (due to incorrectly classifying 20 predictions as “false positives”) instead of the actual F1 = 1.0 (with all predictions being correctly classified as true positives).
Depending on the intended pattern recognition task for the DL model, different annotation shapes need to be applied (including global image/case-level labels for object detection tasks; object-level annotations like spot annotations or bounding boxes for object detection tasks; and pixel-level annotations like polygons/masks for segmentation tasks), with higher level of label details granularity (polygons > bounding box > spot annotations > image labels) typically requiring more time investment (Fig. 4). 133 Many pathology tasks can be solved with different pattern recognition tasks, based on the intended output and application of the model. For example, models for predicting lymph node metastasis have either used patch classification or pixel segmentation as a pattern recognition task, each requiring different annotations types as a reference standard. 29 While having higher label granularity is typically beneficial for model development,121,122 the most suitable annotation shapes should be determined based on their time investment, balancing the richness of information most beneficial for the pattern recognition task with the number of annotations that can be created within the same time frame. 121 When time efficiency is a critical concern, some projects may opt for sparse annotations, which involve intentionally annotating only a limited percentage of the pattern within the selected image. 144 This lack of completeness introduces limitations for DL model development and is therefore typically combined with fully annotated images. 144 It is important to note that sparse annotations are not suitable for validation and test data sets because any unlabeled object will lead to an incorrect interpretation of the model performance (see the mitotic figure example above). Unfortunately, there are currently no general guidelines for the ideal composition of a data set regarding the trade-off between data quantity (data scaling laws) and granularity (detailed annotations for few images vs “weak” annotations for many images) or completeness (complete annotations for few images vs sparse annotations for many images).
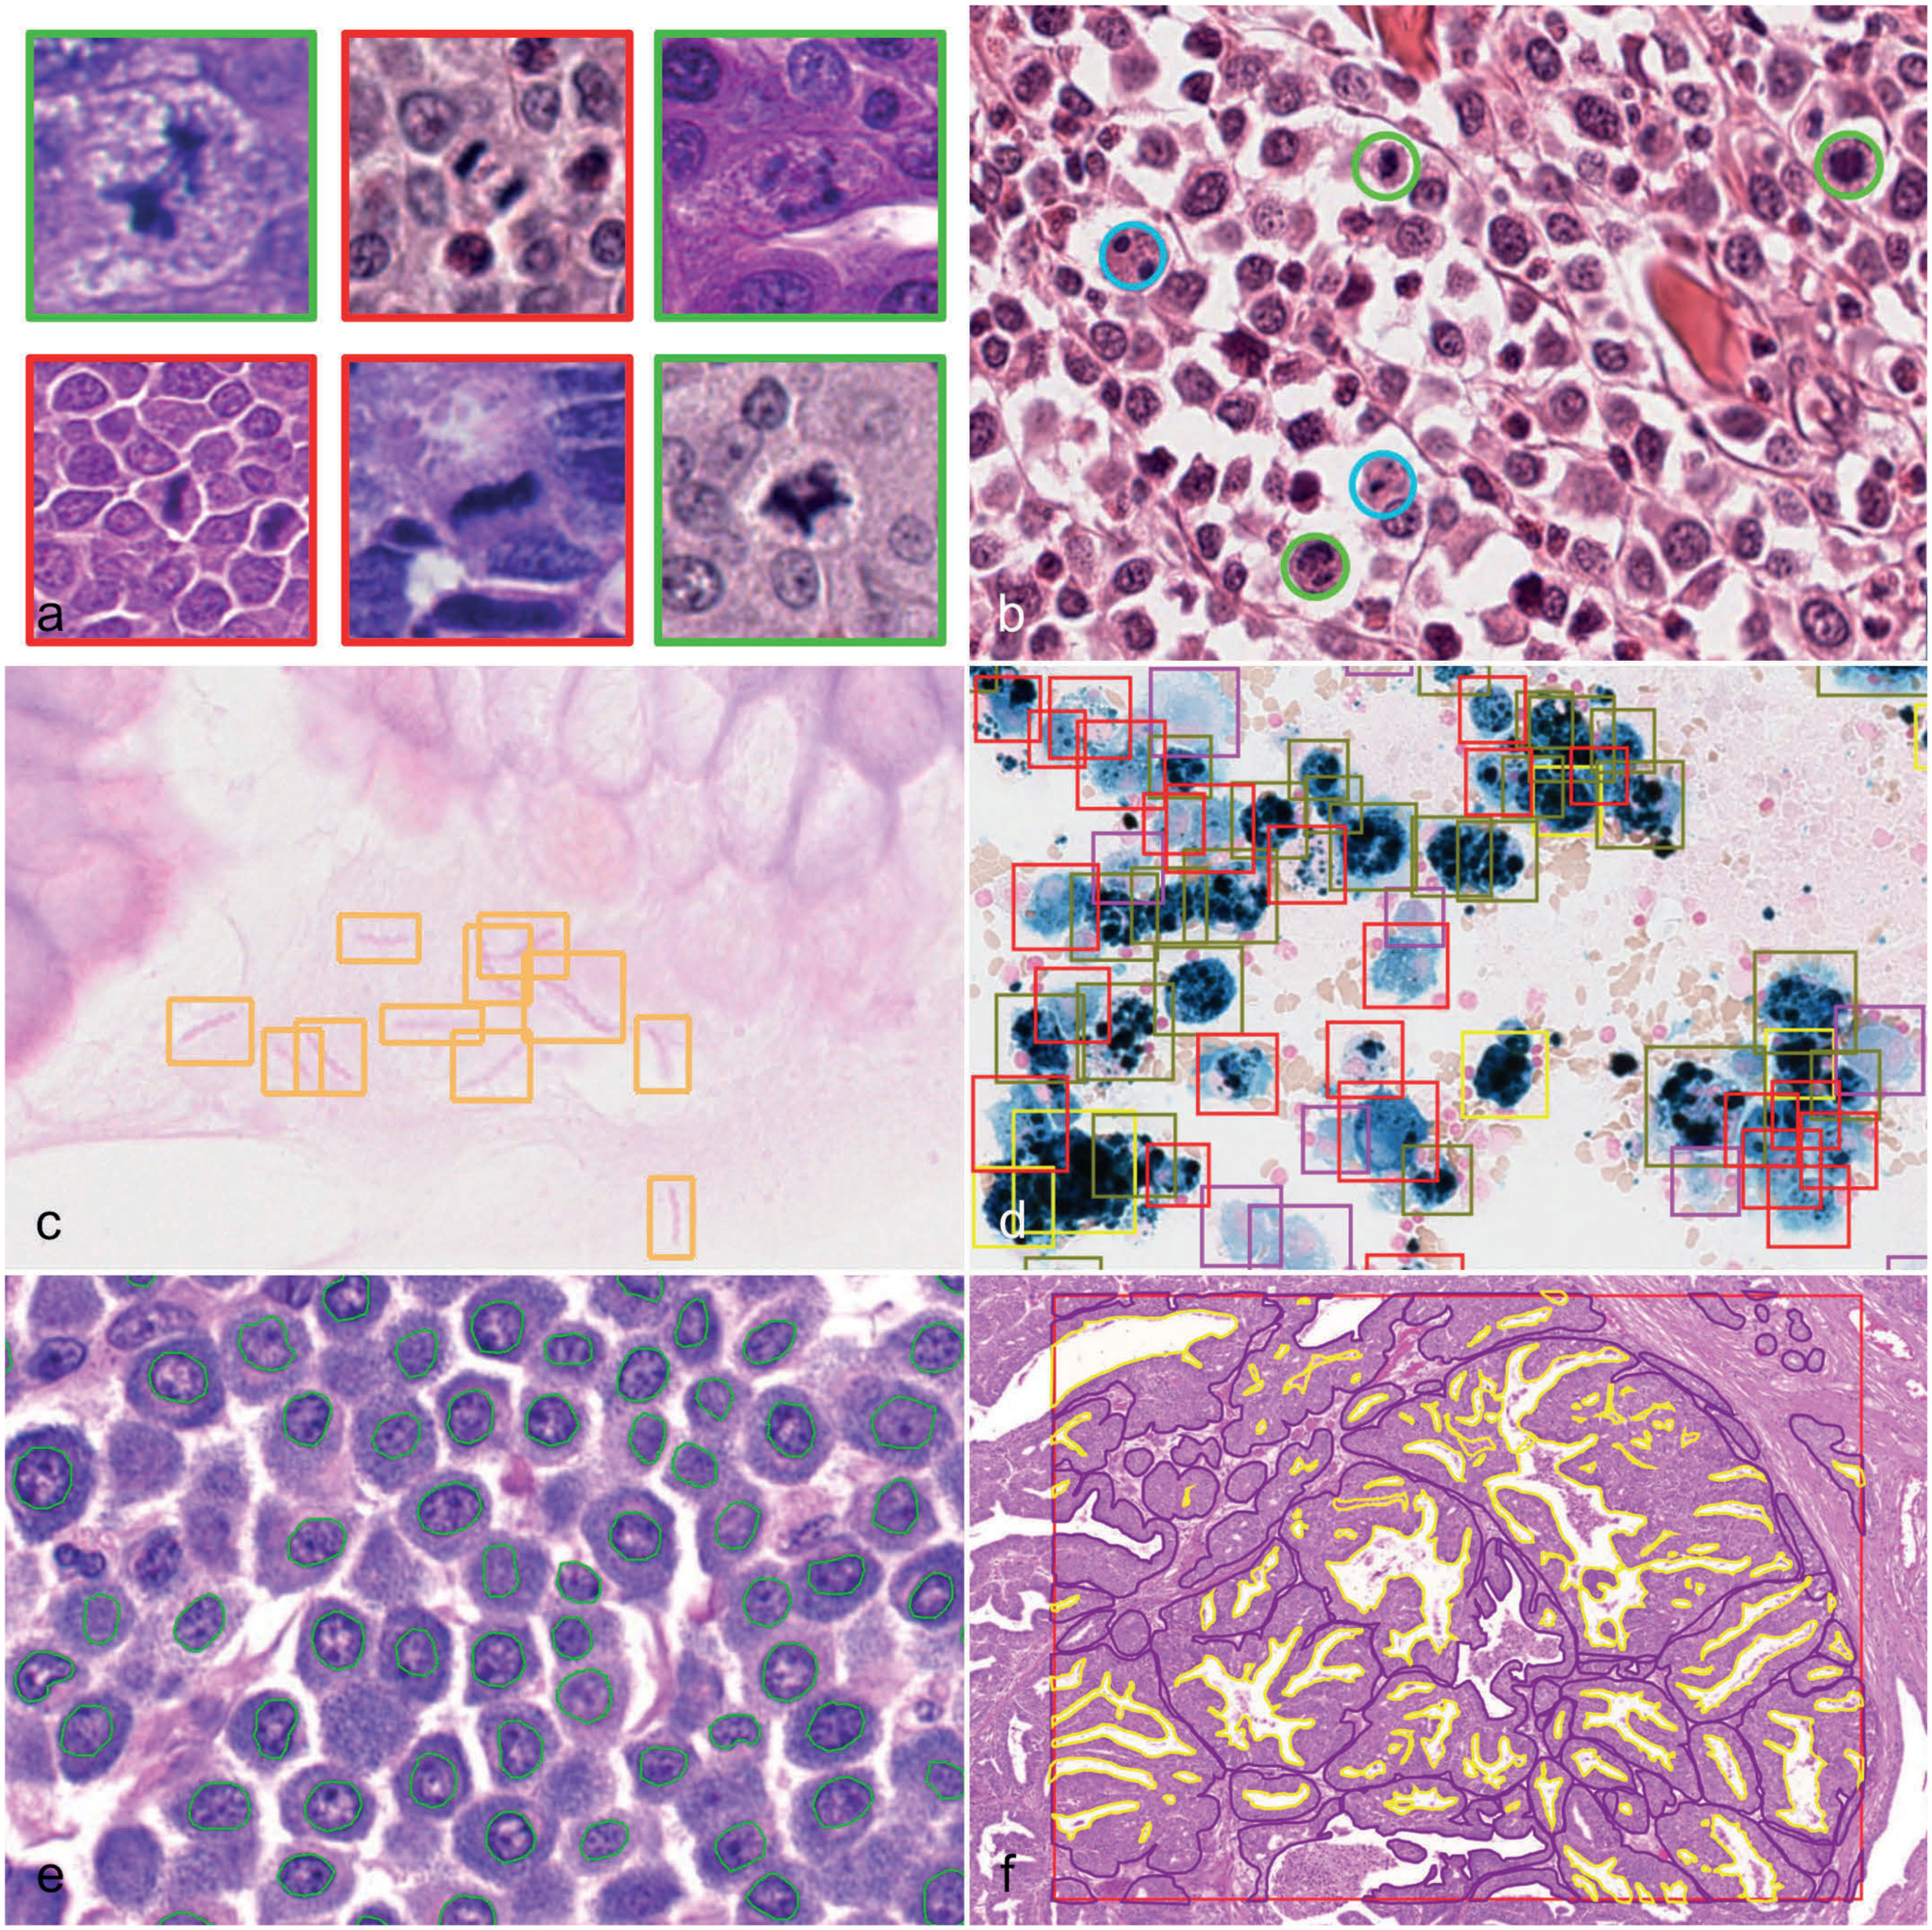
Comparison of different annotation shapes with increasing granularity. (a) Classification labels of image patches with labels for normal (red) and atypical mitotic figures (green). Hematoxylin and eosin (HE) images of different canine and human tumors from an open data set. 18 The difference in color between the patches is related to slides being stained at different laboratories and scanned with different whole-slide image (WSI) scanners. (b) Canine cutaneous mast cell tumor from an open data set. 23 Single-click spot annotation in the center of mitotic figures (green) and hard negatives (blue). For better detectability, the annotation is displayed as a fixed size circle. HE. (c) Bounding box annotations of variable sizes labeling Helicobacter sp. in a canine gastric biopsy. HE. (d) Bronchoalveolar lavage of a horse with exercise-induced pulmonary hemorrhage from an open data set. 92 Bounding box annotations of variable sizes labeling 5 different classes of hemosiderophages. Perl’s Prussian blue. (e) Canine cutaneous mast cell tumor from an open data set. 60 Polygon annotation delineating the contours of neoplastic nuclei. HE. (f) Canine mammary tumor. Region of interest annotation (red box) and polygon annotations delineating the contours of neoplastic epithelium (purple is inclusion area and yellow is exclusion area). HE.
For image classification, the labels can be done either on the tile-level (small subregions in the WSI) or on the global case/WSI level. An example of a global label is the diagnosis by pathologist, 52 and for these types of labels, weakly supervised learning (such as multiple instance learning) is typically used.52,109 Some of these global labels can be regarded as superior gold standard methods, when they evaluate the pattern of interest independent from human interpretation, often even without a clear understanding of the corresponding morphological features in the WSI, such as patient outcomes (defined by survival time) or mutational patterns (determined by molecular methods).40,41,78,109 These superior ground truth methods are not further discussed in this review, due to their paucity in veterinary data sets.78,109 For global labels, a sophisticated annotation software is not necessarily needed, and labels may be simply collected in a spreadsheet. For certain image-level labels, such as case diagnoses, annotations can sometimes be retrieved from existing medical records,52,87 reducing the need for additional annotators but possibly still requiring careful quality control. Ideally, a systematic ontology and standardized terminology (eg, INHAND in toxicologic pathology) is used.
For image classification, there must always be at least two label classes. For object detection and segmentation, annotations may have only a singular label class (eg, tumor tissue) 6 or multiple classes (eg, number of argyrophilic nuclear organizer regions per tumor nucleus with 10 label classes), 54 whereas all nonannotated objects or pixels belong to the background class. For some pathology tasks, it may be useful to additionally annotate particularly challenging (for the DL model) background patterns as “hard negatives.”23,85 The primary benefit of hard negatives is that they can be shown to the DL model during training at an overproportionate ratio to reinforce the model’s ability to distinguish patterns with overlapping morphology. These hard negatives include (1) objects with an overlapping morphology to the pattern of interest (eg, apoptotic cells for a mitotic figure data set), for which pathologists may also struggle to classify them correctly and (2) patterns that may be difficult for the DL model to learn due to their rarity in some data sets, but are obvious for pathologists (eg, green ink with a shape of chromosomes in metaphase could be confused with a mitotic figure, Fig. 3k, l). A secondary benefit of hard negatives is that they can be used (in addition to the candidate objects) when forming a majority vote by multiple annotators to avoid confirmation bias (see below).
Manual Annotations
The default annotation method for microscopic data sets are manual annotations by a single trained pathologist. 102 While the advantage of this approach is the perceived simplicity, humans are prone to numerous cognitive and visual biases that can impact the quality of annotations.1,43 While a single annotator may be appropriate for simple pathology tasks (eg, delineating neoplastic nuclei), the degree of annotation bias increases with more complex tasks (such as annotating mitotic figures). Several studies have shown that a single-rater data set can contain a significant degree of error, and that reduction of label errors through more sophisticated annotation methods can markedly improve performance of the derived DL model.58,138 One particularly important type of error in microscopic images is low interrater consistency between annotators.24,54,55,138,142 For example, the number of mitotic figure annotations by 12 pathologists in 50 regions of canine cutaneous mast cell tumors ranged from 1324 to 4412, differing by a factor of up to 3.3. 138 When comparing these annotations with the majority vote of the 12 pathologists, the performance of each annotator ranged between an F1-score of 0.68 to 0.86 (where a score of 1.0 indicates perfect agreement to the consensus). Another study revealed the performance of 6 annotators on the test subset of a data set for multinucleated tumor cells, with the annotators F1-scores ranging from 0.316 to 0.622 when compared with a computer-assisted ground truth created by a separate pathologist. 24 This high degree of interrater disagreement for certain tasks should be carefully considered when creating data sets with a single annotator, especially if the derived DL model is intended to be applied by different pathologists. DL models are likely to assimilate to the annotators’ decision thresholds, and there might be an inevitable difference between the DL models predictions (even if the model was perfect compared with the single-rater ground truth) and the interpretation of other pathologists.
Methods to improve label quality of manual annotations include:
Annotator experience: A high level of experience fosters accuracy and consistency in decision-making (see below).
Detailed annotation instructions: Providing clear labeling instructions and label class definitions, along with example images, can improve label quality.101,133 It should be emphasized that omitting difficult patterns due to decision-making challenges is not a viable option for data set creation, in particular for test sets.
Pilot studies: Conducting a pilot study, where the same slides are annotated by multiple annotators and/or re-annotated by the same annotator after a washout period, can help to assess interrater and intrarater agreement. These metrics serve as indicators of label quality. Based on the results, annotation methods and instructions can be optimized. Providing feedback to annotators on their performance may raise awareness of the importance of diligence and adherence to instructions.
Training phase: A training phase prior to annotation is recommended to familiarize annotators with the annotation software and annotation task.
Majority vote: Using a majority vote from multiple annotators can harmonize individual sensitivity and specificity trade-offs, resulting in labels that reflect the average pathologist’s interpretation (see below).22,25,60
Reevaluation: Reevaluating annotations by the same annotator(s) can reduce label inconsistencies and correct accidental errors. Inexperienced annotators may exhibit a learning curve during data set creation, leading to inconsistencies between earlier and later annotations. Accidental errors may also arise due to time pressure and fatigue.
Cross-checking: Cross-checking annotations with an experienced pathologist can help identify misinterpretation of the labeling instructions and errors in subsequent annotations can be avoided.60,102
Special stains or IHC: Registration with specific histochemical stains (eg, periodic acid-Schiff reaction for parasites) or IHC (eg, phosphohistone H3 [pHH3] for mitotic figures) 55 can support annotators to better classify difficult patterns (see below).
Computer-assisted annotations to identify missed candidates or correct label inconsistency (see the next section).
The required level of expertise of annotators depends on the specific annotation task. For example, annotations of neoplastic nuclei may be performed by veterinary students, 60 while labeling mitotic figures requires a higher degree of expertise.27,138 Highly experienced annotators are generally expected to produce fewer label errors; however, this may not hold true for tasks requiring minimal medical background, such as interpreting the intensity of special stains. 90 While some experienced senior pathologists may have limited time availability due to other commitments, less experienced annotators, such as veterinary or PhD students, may be able to dedicate more time and effort to the project, which may positively impact label quality. For less experienced annotators, prior training and regular cross-checking by experienced pathologists can improve label quality.
To avoid placing extensive workload onto one annotator, some groups split the images among multiple annotators. 4 However, different annotators may have different decision thresholds resulting in a label shift between annotators and label inconsistency over all images. In such cases, minimizing interrater variability is critical, for example through clear annotation instructions. It is advisable to have all annotators label the same images of a small subset to allow quantification of interrater variability between the annotators, which can then be accounted for in subsequent DL development steps.
Various methods for majority voting or consensus by multiple annotators are available, depending on the level of the annotations. In all cases, the annotators should be blinded to the other’s annotations to avoid a confirmation bias. For majority voting of image- and object-level annotations, two annotators may independently label/screen the images, and all discrepant labels or objects with only one annotation are reviewed by a third tie-breaker annotator. An alternative approach for object-level annotations is that one annotator screens the images, and the correct label class is verified through a second annotator. Discrepancies are resolved by a third tie-breaker annotator. The second approach is more time-efficient, while the first promises greater label exhaustiveness. 27 Studies on object-level annotations have shown that majority voting improves label quality, resulting in more accurate labels that reflect the average pathologist’s interpretation by balancing outlier opinions.58,138 An important consideration is the number of annotators (typically an uneven number, ie, 3, 5, 7, etc) required for each label, balancing the overall label effort with label quality. For object-level annotations tasks involving a single label class (eg, mitotic figures in tumors), a hard negative group should be included alongside the pattern of interest annotations in a blinded manner to avoid confirmation bias. 27 For segmentation tasks, a pixel-level majority vote may be difficult to obtain, and alternative methods include label fusion or a probabilistic consensus on the label class per pixel. 70
For tasks requiring annotation of difficult patterns in HE images, additional information provided by special histochemical stains or IHC can support the annotator’s decision-making process (special stain/IHC-guided annotations).12,55,93,97 For this method following laboratory steps are needed: (1) apply first stain (typically HE), (2) scan the slide, (3) destain, (4) apply the second stain or IHC, (5) scan, and (6) image registration (Supplemental Figure S7). Annotations are made in the HE image, while the annotator’s decision is guided by the information of the special stain. While this approach may improve label quality and efficiency (increased label completeness and accuracy, possibly removing the need for a majority vote and other sophisticated annotation methods), it may also have limitations. These include costs associated with additional staining/IHC, potential imperfections in the second staining/IHC (eg, tissue loss during reprocessing, staining/IHC residue, etc), and an increased sensitivity of the special stain/IHC compared with the identifiability of the HE morphology, which may lead to label shifts. 55
To facilitate the annotation work, annotators should be provided with appropriate annotation software (see above) and computer hardware, such as a computer mouse or stylus and a suitable monitor.101,102 While the impact of hardware on annotation accuracy has not been thoroughly evaluated, it certainly affects label efficiency and work ergonomics. 34 For example, depending on individual preferences, using a stylus may speed up polygon annotations.
Computer-Assisted Annotations
Computer-assisted annotation methods (also known as human-algorithm collaboration) are commonly used for data set creation in both human and veterinary research.102,106 The key feature of this approach is the collaboration between a computer algorithm (not limited to DL models) and an annotator, where the algorithm generates predictions on data set images that are subsequently reviewed and refined by the annotator. While computer-assisted annotation methods can significantly improve efficiency or label quality, data set creators must be aware of potential biases, including algorithmic errors and biases introduced by human-algorithm interaction. Care must be taken to avoid introducing bias into the test data set. The prerequisite for these tools is the availability of a sufficiently high-performing algorithm, which can be either task-generic (eg, segment anything models, SAMs)34,84 or task-specific (eg, detection of mitotic figures in mammary carcinoma). 8 Task-specific algorithms often require an initial manually annotated data set for its development.
Based on our literature review, computer-assisted annotation tools can be grouped into 3 categories, each with distinct applications and benefits:
Algorithmic inference on unlabeled images with subsequent annotator review. These tools aim to increase labeling speed.
Real-time algorithmic modification during creation of manual annotations. These tools aim to enhance annotation granularity (eg, from spot annotation to segmentation mask) while maintaining high efficiency.
Algorithmic inference on previously labeled images and subsequent annotator review. These tools aim to increase label quality (completeness or consistency).
Algorithmic inference on unlabeled images uses algorithms to predict new labels, reducing the amount of manual interaction required from annotators. 92 The algorithm generates suggestions, which the annotator reviews and, if necessary, corrects by removing or adding annotations or modifying the size/shape of the annotations. Studies have demonstrated that this method can significantly reduce the time investment for labeling and, when high performance algorithms are used, may even improve annotation quality.90,91 However, the most relevant source of error in this approach is confirmation bias, where annotators may accept incorrect algorithmic predictions while dismissing contradictory information. 114 Previous studies have shown that annotators may fail to identify errors such as missing predictions, false-positive predictions, nonmaximum suppression artifacts, and incorrect label classes.58,90,91 Therefore, high diligence during expert review is essential to mitigate these risks. Algorithms with a balanced or specific detection threshold may be particularly effective in addressing the objective of increasing label efficiency.
Real-time algorithm-annotator interactions are often designed to create highly granular polygon annotations with minimal effort.3,34,82,121 Annotators provide low-granularity input, such as a mouse click, a line inside the object, or a bounding box around the object, and the algorithm (eg, SAM) automatically refines the annotation to outline the object at the pixel level. These tools are known for their high efficiency and typically have a high accuracy in generating polygon annotations.34,82 However, human review and corrections are necessary to ensure high label quality. The effectiveness of these tools is expected to increase with the use of foundation models. 84
After the initial manual data set is completed, further computer-assisted methods can be applied to improve annotation quality. These methods typically involve training DL models on the initial data set to either: (1) detect missed candidates8,23,27 or to (2) correct label classes.8,89,92 An example for the first application are small and rare objects (such as mitotic figures) that are often overlooked due to the complexity of microscopic images combined with time pressure or annotator fatigue. To improve label completeness, DL models with high sensitivity can be used to detect missed candidates. These models are designed to include nearly all missed candidates, at the cost of generating additional false positives, which need to be distinguished through expert annotations.8,23,27 The high number of false positives has a positive effect, as it reduces confirmation bias during subsequent annotator review.
Wrong labels classes can be detected using annotation maps, which visualize patches of annotated objects based on a predicted relationship.8,89,92 These maps group patches with high similarity in close proximity and display the previously assigned label class. Annotators can explore these maps to identify and correct errors in label classes. For example, patches of the same label class located at opposite ends of the map are likely to represent obvious label errors that can be easily corrected. Conversely, regions where two label classes blend into each other often represent borderline morphologies that are inherently difficult to annotate. Correcting these borderline labels may introduce bias, so care must be taken during review. An example of annotation maps was demonstrated in a data set of hemosiderophages in equine bronchoalveolar lavage fluid. 92 In this study, hemosiderophages stained with iron stains were classified into five categories based on the degree of intracytoplasmic hemosiderin (blue pigment). These categories represent a continuous spectrum with poorly defined thresholds, which can be challenging to apply consistently. Annotation maps, which ordered patches based on a regression score, were used to improve the consistency of the applied thresholds over the numerous months for data set creation.
Computerized Annotations
There are few annotation methods used to increase the number of labels that do not rely on annotator interaction at any point, making them fully computerized. These time-efficient labeling methods include pseudolabels, IHC/special stain-registered transfer of computerized annotations (see below), and synthetic images with labels (see the previous section on images).
Pseudolabels are annotations derived through algorithmic inference on unlabeled images without verification by an annotator. For this approach, an initial, manually labeled data set must be available to train sufficiently accurate algorithms. However, this creates a self-reinforcing problem: an initial small data set may lead to a biased algorithm and subsequently generate extensively flawed pseudolabels (resulting in error propagation), thus only slight advantages for model training can be expected. 2 On the contrary, already highly accurate DL models (based on large initial data set) may benefit little from training with pseudolabels, unless sampling from image domains not sufficiently represented in the existing data set; however, this would be correlated with an increased risk for label errors. To overcome this self-reinforcing problem, some studies generate pseudolabels only for high confidence predictions while requesting expert review for low-confidence predictions (computer-assisted labeling) and thereby aiming at reducing annotation effort and ensuring label quality.80,83 Whenever feasible, expert review of algorithmic annotations should be pursued. Importantly, pseudolabels should never be used for testing data sets.
IHC/special stain-registered transfer of computerized annotations is achieved by creating HE images (or any other target staining method) and special histochemical stains or IHC for the same tissue sections. The IHC/special stain is used to generate the ground truth, which is subsequently transferred to the HE image (Supplemental Figure S8). Annotations can be automatically generated often with high label quality from IHC/special stains by creating a binary mask through simple algorithms, including color deconvolution followed by filters and thresholding.6,14,30,73 The transfer of annotations enables DL models to be trained to identify patterns of interest in the corresponding, morphologically more complex HE images. Manual annotations are often not required for this approach, 6 although some authors have used manual 30 or algorithmic (using DL models) 124 refinement of the automated labels. The advantage of this approach is that a large data set, including complete annotations of entire WSIs, can be generated with no or minimal annotation labor. Given the presumably low degree of error associated with some examples of this approach, it is potentially suitable for the test data set, provided quality control of the automatic annotations is conducted. Nevertheless, the use of a second test data set with human-curated annotations may be advisable to confirm the high accuracy of the automated labeling method. Challenges of this approach include access to an IHC marker/special staining that is specific for the object of interest and the laboratory process of destaining and restaining/immunolabeling without any alterations to the tissue (eg, detachment and loss). As discussed above for IHC-guided annotations, it may be advisable to produce the target staining method (HE; used for DL model development) first and the ground truth source (IHC/special stain) second. Performing the destaining and restraining methods of the same tissue section is preferred over consecutive sections, in which the size and shape of the object may differ, and small objects may disappear and appear. Consecutive sections will also have some degree of tissue distortion and artifacts (like tissue folds) in other locations, making the registration process more complex.
This IHC/special stain-based annotation approach has been utilized in the literature for the creation of WSI segmentation masks of neoplastic mammary epithelium in dogs (using cytokeratin IHC as the marker), 6 colonic epithelium in humans (using EPCAM IHC), 73 and collagen stroma in canine tumors (using a histochemical stain for collagen, ie, hematoxylin-eosin-saffron stain). 14 Some authors have used modified methods. Mehrabian et al 95 segmented epithelial lung tumors (using cytokeratin immunofluorescence) exclusively for pretraining a model, which was subsequently fine-tuned with human annotations, reducing the annotation time investment by 70%. Bulten et al 30 generated segmentation masks of neoplastic prostate epithelium from IHC images and subsequently trained a DL model for the IHC images. The DL models then generated segmentation masks (pseudolabels) for additional IHC images, which were only then transferred to registered HE images.
The Evolution of Data set Creation for Mitotic Figures
This section aims to demonstrate the challenges of data set creation using the example of data sets for mitotic figures from both human and veterinary samples. We compare relevant annotation methods and explore how these methods impact the derived DL object detection models. Mitotic figures represent a particularly challenging pattern for both pathologists and computer vision systems, necessitating especially high standards for ensuring data set quality. 22 We believe that mitotic figure data sets are a good example since this is one of the few pathology tasks for which several data sets (open data and private) exist, with the first published in 2012. 116 From the 8 open-access data sets listed in Table 3 and Supplemental Table S1, it is evident that the applied methods for data set creation have become increasingly complex over time to address challenges with annotation bias, making a comparison interesting .8,13,23,27,115,116,128,129 Based on the number of annotators and the use of computer assistance, we have classified these annotation methods into three versions. Another version of data set creation, currently being investigated and discussed below (however, no open data set is available yet), is the use of IHC-assisted methods (version 4).
Comparison of creation methods for mitotic figures data sets using human and animal tumor images, ordered by annotation method version and year of publication.
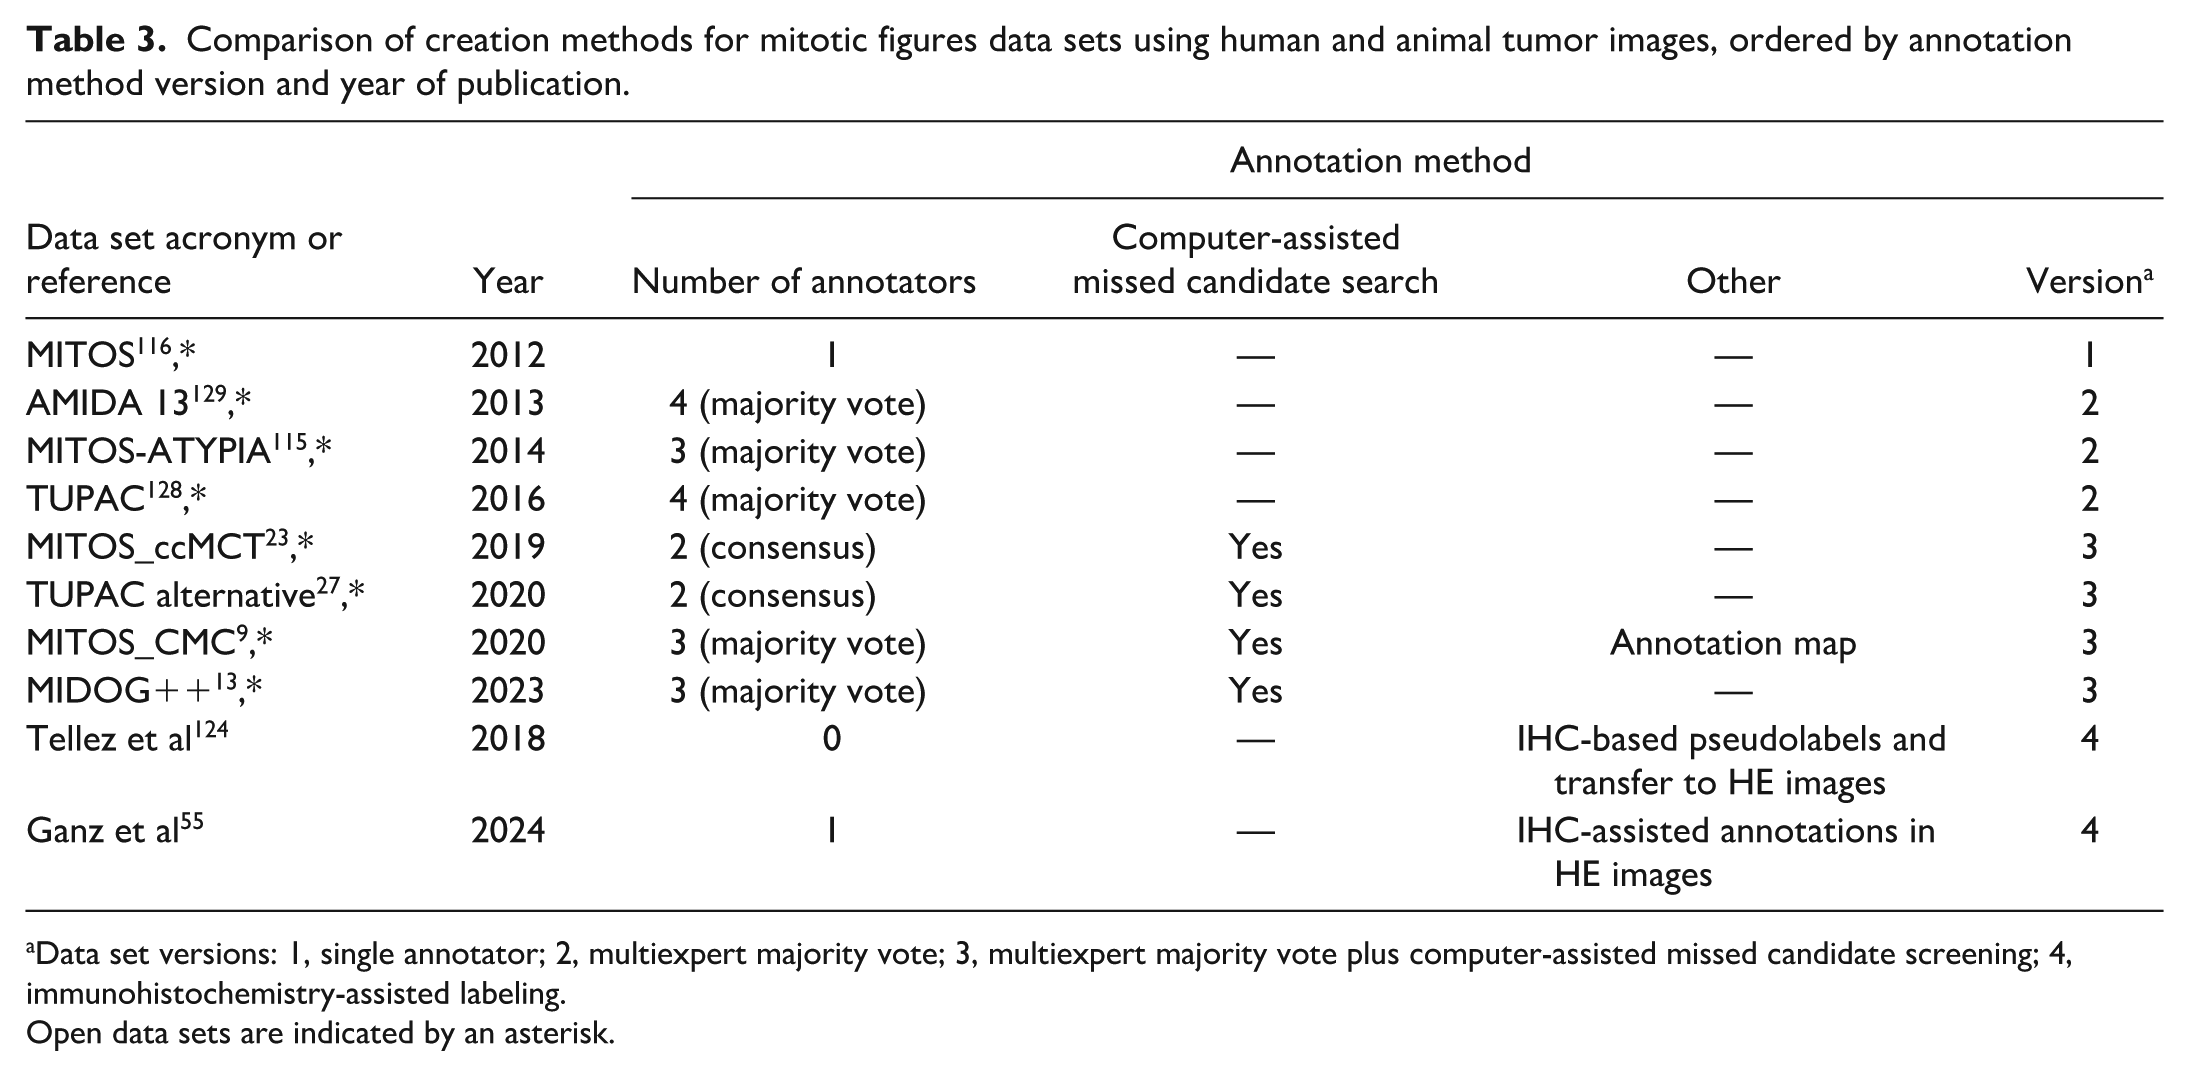
Data set versions: 1, single annotator; 2, multiexpert majority vote; 3, multiexpert majority vote plus computer-assisted missed candidate screening; 4, immunohistochemistry-assisted labeling.
Open data sets are indicated by an asterisk.
The earliest mitotic figure data set (the MITOS data set) used a ground truth derived from a single annotator (version 1). 116 This data set was used for a computer scientist challenge, where several research teams competed to develop the best-performing algorithm. A high F1-score of 0.782 was achieved by the winning team; however, this high performance can be largely attributed to data leakage (ie, image patches from each case were included in both the training and test data sets, significantly overinflating the performance). The primary source of label bias is the correctness of the mitotic figure annotations. Previous studies have shown that pathologists apply variable thresholds when classifying mitotic figures against the background (eg, apoptotic cells), which can result in differences in the number of annotations of up to a factor of 3.5 when analyzing the same images.22,138 While it is typically unknown whether the annotator applied sensitive or specific thresholds, the individual annotator has a great influence on the derived DL model.
Version 2 data sets attempted to address interannotator differences by employing a multiexpert majority vote for formulating the ground truth (eg, the AMIDA 13, MITOS-ATYPIA, and TUPAC data sets).115,128,129 The AMIDA13 data set is a good example of this version and it provides insight into the agreement between their annotators. 129 Two annotators independently screened the 23 images, resulting in 1088 annotations by annotator 1 and 1599 annotations by annotator 2. Of these, 649 objects were annotated by both annotators (31.8%), which were directly accepted for the final data set, while 1389 objects (68.2%) were labeled only by one annotator. The latter annotations were evaluated by additional pathologists who agreed that 434 of the 1389 objects (31.2%) were consistent with mitotic figures. This multiexpert majority vote aims to balance the individual pathologists’ thresholds toward an average pathologist’s interpretation. Two studies have evaluated the number of annotators needed for a consensus and both concluded that 3 expert annotators provide an ideal balance between increased label accuracy (defined as the average pathologists’ interpretation) and additional time investment.58,138 While this mean decision threshold is considered beneficial for achieving acceptance of the DL model by the majority of pathologists, it should be acknowledged that there will always be pathologists with divergent thresholds, meaning this approach does not completely resolve the issue of label correctness. Even the same annotators will not result in the same ground truth, revealing that there are challenges to apply the decision thresholds consistently. For example, when the ground truth objects of the AMIDA13 test set were reevaluated by the same annotators, only 379/533 objects (71.1%) were considered to be true mitotic figures upon reevaluation. 129 Another relevant source of label bias in this version 2 method is the completeness of annotations. This is also supported by the data from the AMIDA13 computer scientist challenge, for which all predictions by the best-performing DL models that were initially interpreted as “false positives” (ie, predictions not marked as ground truth labels) were reevaluated. Upon reevaluation of these objects, it was found that 61/208 (29.3%) “false positives” were indeed consistent with mitotic figures (ie, true positives) and thus should not have been interpreted as algorithmic error. Instead, these represent label errors of the initial annotation workflow (omission of actual mitotic figures) that had resulted in falsely low performance estimation. 129
Successive data sets incorporated computer assistance for identification of missed candidates and thereby increasing label completeness (version 3; eg, the MITOS_ccMCT, TUPAC alternative, MITOS_CMC, and MIDOG++ data sets).8,13,23,27 This approach is applied after all images have been annotated using a version 2 workflow (Fig. 5), with an emphasis on reducing annotator confirmation bias by predicting candidates at high sensitivity (ie, intentionally including many false positives). Two studies have demonstrated that the measured test set performance of the DL model (using the same images and training methods) between version 2 and 3 data sets can be improved from F1 = 0.755 to 0.820 23 and from F1 = 0.707 to 0.785, 8 showcasing the relevance of label completeness. Other researchers have applied this approach at a sensible diagnostic detection threshold (ie, without intentional sampling imposters), 112 which reduces the number of patches that need to be labeled by a pathologists; however, this approach may also induce a higher confirmation bias (possibly reducing label correctness) and does not detect the mitotic figures that the model struggles with (ie, have a lower detection threshold).
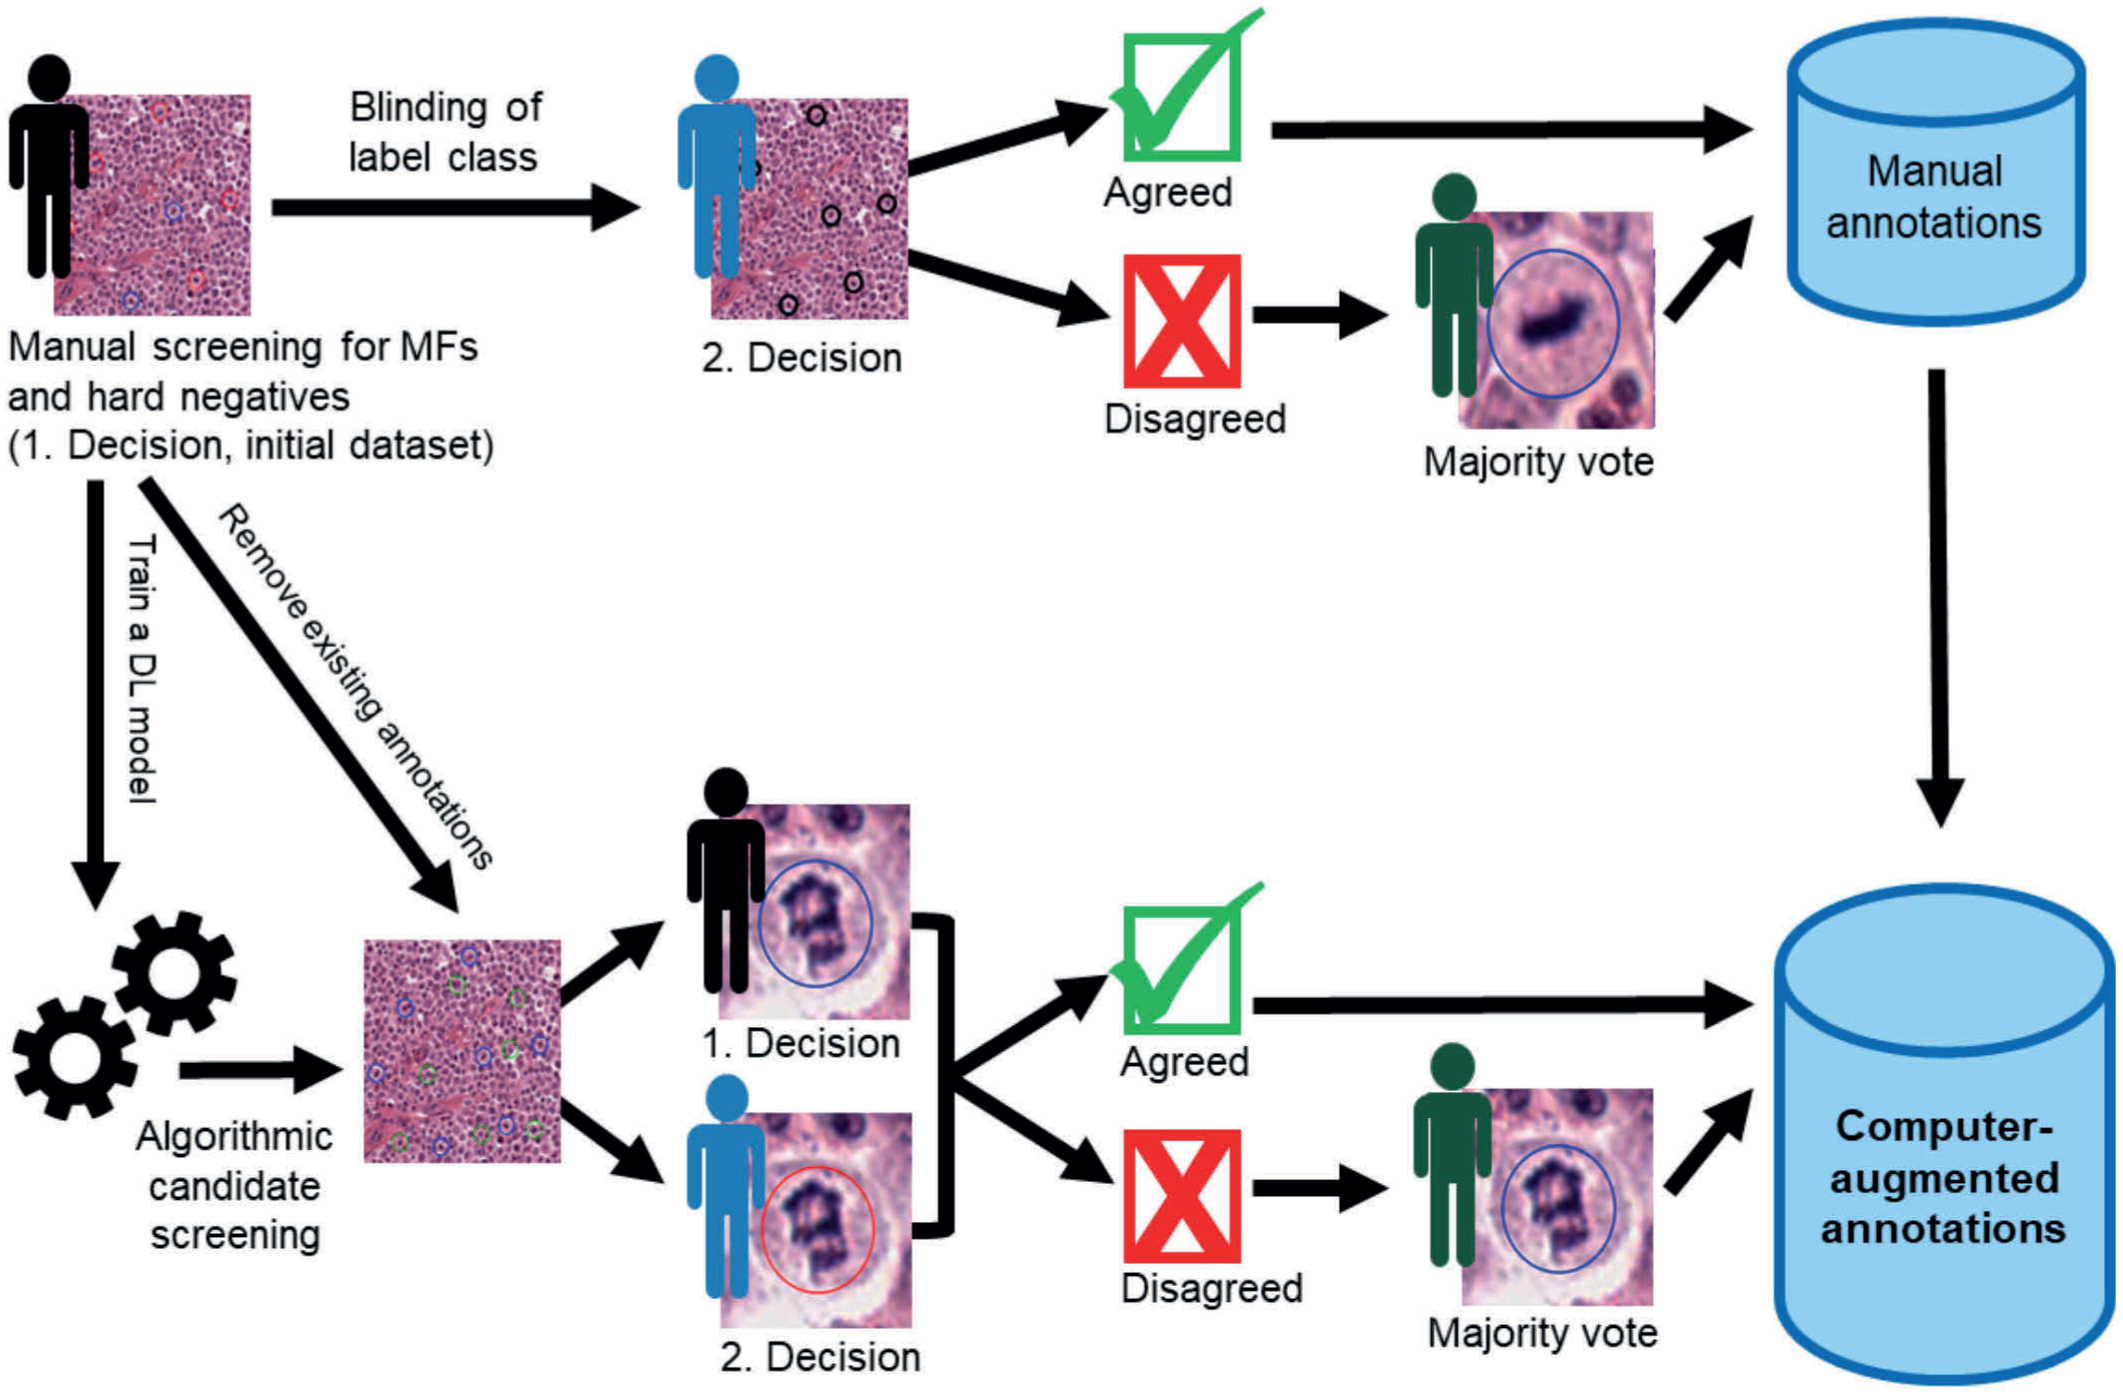
Annotation workflow for a version 3 data set, ie, majority voting and computer assistance for annotation. First, an initial data set is created by a pathologist screening all images for mitotic figures and hard negatives (background structures resembling mitotic figures such as apoptotic cells). The initial data set is further processed in two ways: (a) blinding for the label classes and majority voting by further pathologists and (b) defined as training data for a deep learning model that is used to screen for mitotic figure candidates that were missed by initial annotations. The model is designed to predict candidates with a high sensitivity, resulting in an intentionally high number of false positives, which removes confirmation bias in subsequent majority voting. This graph was modified from Bertram et al. 27 MFs, mitotic figures; DL, deep learning.
Given that the version 3 annotation workflow is time-consuming, alternative methods have been evaluated that use destaining and immunohistochemical labeling with pHH3 of the same tissue sections (version 4).12,22,55,58,124 pHH3 is a marker that highlights mitotic figures throughout prophase (not consistently recognizable in HE images) to anaphase. Tellez et al 124 have automatically detected the brown signal of mitotic figures (color deconvolution) and used a DL model (trained with only 2000 manually annotated objects) to distinguish staining artifacts from real signals (pseudolabels for a relatively easy computer vision task as compared the HE task). These pseudolabels were then transferred to the registered HE images, enabling the creation of a large-scale WSI data set with only 2 hours of annotation work. However, the derived model did not perform particularly well, despite the large amount of training data. Based on our experience, many pHH3-positive structures cannot be recognized in HE images based on morphology (eg, early mitotic figures, overstained cells, out-of-focus image regions, or marginally sectioned cells).12,55 This may have introduced label noise in the annotation method by Tellez et al 124 and impaired model training. A subsequent study by Ganz et al 55 used the pHH3 slide as decision support for pathologists during annotations in HE images (Supplemental Figure S9). This approach aimed to improve label completeness (eliminating the need for computer-assisted missed candidate screening) and enhance annotator consistency by helping pathologists better distinguish mitotic figures from imposters. While data sets from single annotators showed much higher agreement, this annotation method did not result in improved model performance. This outcome was attributed to an information mismatch between the HE and pHH3 images, which led to a label shift by annotators (ie, increasingly annotating morphologically less certain mitotic figures). Further improvements of this annotation approach, such as by majority voting (blinded to pHH3) for borderline morphologies, were suggested.
Further Considerations
Before using the data set for model development, it is recommended to conduct data cleaning, which involves detecting and correcting or removing errors, incompleteness, and inconsistencies, and quality control of annotations and images. 133 For example, missing metadata can be added and obvious errors, such as duplicate annotations and wrong annotation types that should not have been used, can be automatically removed. The development of an initial DL model may also provide insights into the data set’s quality and reveal potential areas for improvement through augmentation of the data set.
Effective data set management requires thoughtful storage, backup, and long-term accessibility. Storage should match access needs; fast local or network solutions during annotation and model training, and slower archival systems after project completion. To prevent data loss, at least one independent backup should be maintained on a separate medium (eg, cloud, external drive, server, or public data repository). During active data set creation, backups should be performed regularly, ideally with version control to track changes. Equally important is the choice of image and annotation formats. Proprietary or third-party formats may become unreadable if their software is discontinued and open, standardized solutions are preferred. In digital pathology, DICOM is a proposed solution for a well-documented, vendor-independent standard for WSI and annotations, which ensures interoperability and long-term accessibility. 38
Proper documentation of the intended use case of the data set and all data set creation steps, as well as a detailed description of the distribution of the final data set (eg, the number of images/cases and annotations as well as their distribution across image domains and disease subgroups) is essential for ensuring transparency regarding potential data set bias and enabling informed decision in subsequent DL model development steps.26,46,64 For example, metadata on patient subgroups will allow a stratified performance evaluation, possibly revealing sources of algorithmic error (hidden stratification). 64 However, it has been shown that public data sets with human samples often lack relevant information, 123 highlighting the need for particular attention to this matter. To support authors in complete reporting of data set characteristics, Elfer et al 46 have published a reporting guideline for annotations.
Although splitting the primary data set is typically done after data set creation and before DL model development (and is thus not necessarily part of data set creation), it is based on data set characteristics. Splitting into 3 subsets (training, validation, and test) must be done at the patient level to avoid data leakage between subsets, for which information on the patient ID for each image is needed.64,144 While the test data set should be representative of real-world applications, a random patient-wise splitting approach may not be ideal for small data sets. In such cases, stratified splitting, where groups are defined based on, for example, image domains or the density of annotations, is often preferred. These data set characteristics (patient ID, subgroup categorization) should be encoded in the final data set. Alternatively, unsupervised clustering of image variability has been proposed to assist data set splitting. 49 The data set splitting scheme should also be documented so it can be used consistently across studies enabling comparison of the results.
Data set owners should also discuss sharing policies with AI developers, whether they are from the same organization or from external institutions (eg, codevelopers or independent research groups). Open-access publications under the various Creative Commons licenses allow for the broadest distribution of data sets (see the section below). To enable others to use the data set effectively, usage notes (eg, recommended software, suggested data splitting strategies) should be prepared. Before sharing data with other institutions, pseudonymization (or anonymization) of images and the removal of private information about the patient or owner, which is information that is not necessary for DL model development, should be performed.
Open Data
Considering the dependency of DL model development on available data sets, publishing data sets and making them accessible for research purposes is an extremely important contribution to science. The opportunities enabled by open data are diverse; some of the most significant are the following:
Acceleration of methodological innovation: Open data allow researchers to explore innovative DL methods for the patterns of interest, fostering the development of state-of-the-art techniques, and thereby gradually enhancing algorithmic capabilities.
Augmentation of training data: Combining multiinstitutional open with in-house data sets leads to increased quantity and variability (eg, domain sources) of images needed for the development of robust and widely generalizable models. 123 These multiinstitutional applicable models may facilitate research collaboration. Exclusive use of public data to develop a model for an in-house application may not be appropriate due to laboratory specific image features.11,65,75 Also, possible differences in the ground truth (label shift) need to be considered.
Broadening of performance evaluation: Open data sets can serve as secondary test sets, enabling more extensive evaluations of algorithmic robustness across diverse domains 28,123 and facilitating comparisons with previous studies. However, care must be taken to account for differences in ground truth definitions, as these may impair consistent performance evaluations across data sets. 27
Reduction of redundant efforts: By making data sets publicly available, researchers can avoid duplicating data collection efforts, saving time and resources. This allows them to focus on developing new methods or addressing novel research questions.
Promotion of reproducibility of biomedical research: When DL-based image analysis is used to derive new biomedical insights, open data enhance the reproducibility of the analytic tools. In fact, a recent guideline for artificial intelligence (AI) in life sciences defines open data as one of the minimum criteria for reproducibility. 62
As listed in Table 4 and Supplemental Table S2, some veterinary researchers have made their data sets publicly available for research purposes.8,13,18,23,24,31,59,60,92,131,136,139,140,142 Some of these data sets span various domains, including several WSI scanner types,13,139 multiple tumor types,13,140 multiple species,13,92 and multiple laboratories,13,92 showcasing collaborative initiatives that will foster robust DL model development. However, despite the growing number of publications on AI models for various applications in veterinary pathology, this literature review reveals that the majority of the veterinary research community remains hesitant to publish their data sets. Instead of open data, some have indicated in their manuscripts (via data availability statements) that they are willing to share data upon reasonable request and through individual agreements,7,53,78 which introduces uncertainties regarding long-term availability. This hesitancy may stem from a desire to maintain control over proprietary data or plans to publish the data in subsequent studies.88,92,112,118 While we recognize these restrictions faced by some AI developers, we hope that the opportunities provided by open data, as listed above, will positively influence the veterinary research community’s willingness to publish data sets following the FAIR (findable, accessible, interoperable, reusable) principles. 137
List of open-access data sets containing microscopic images of animal tissue samples and labels for patterns of interest.
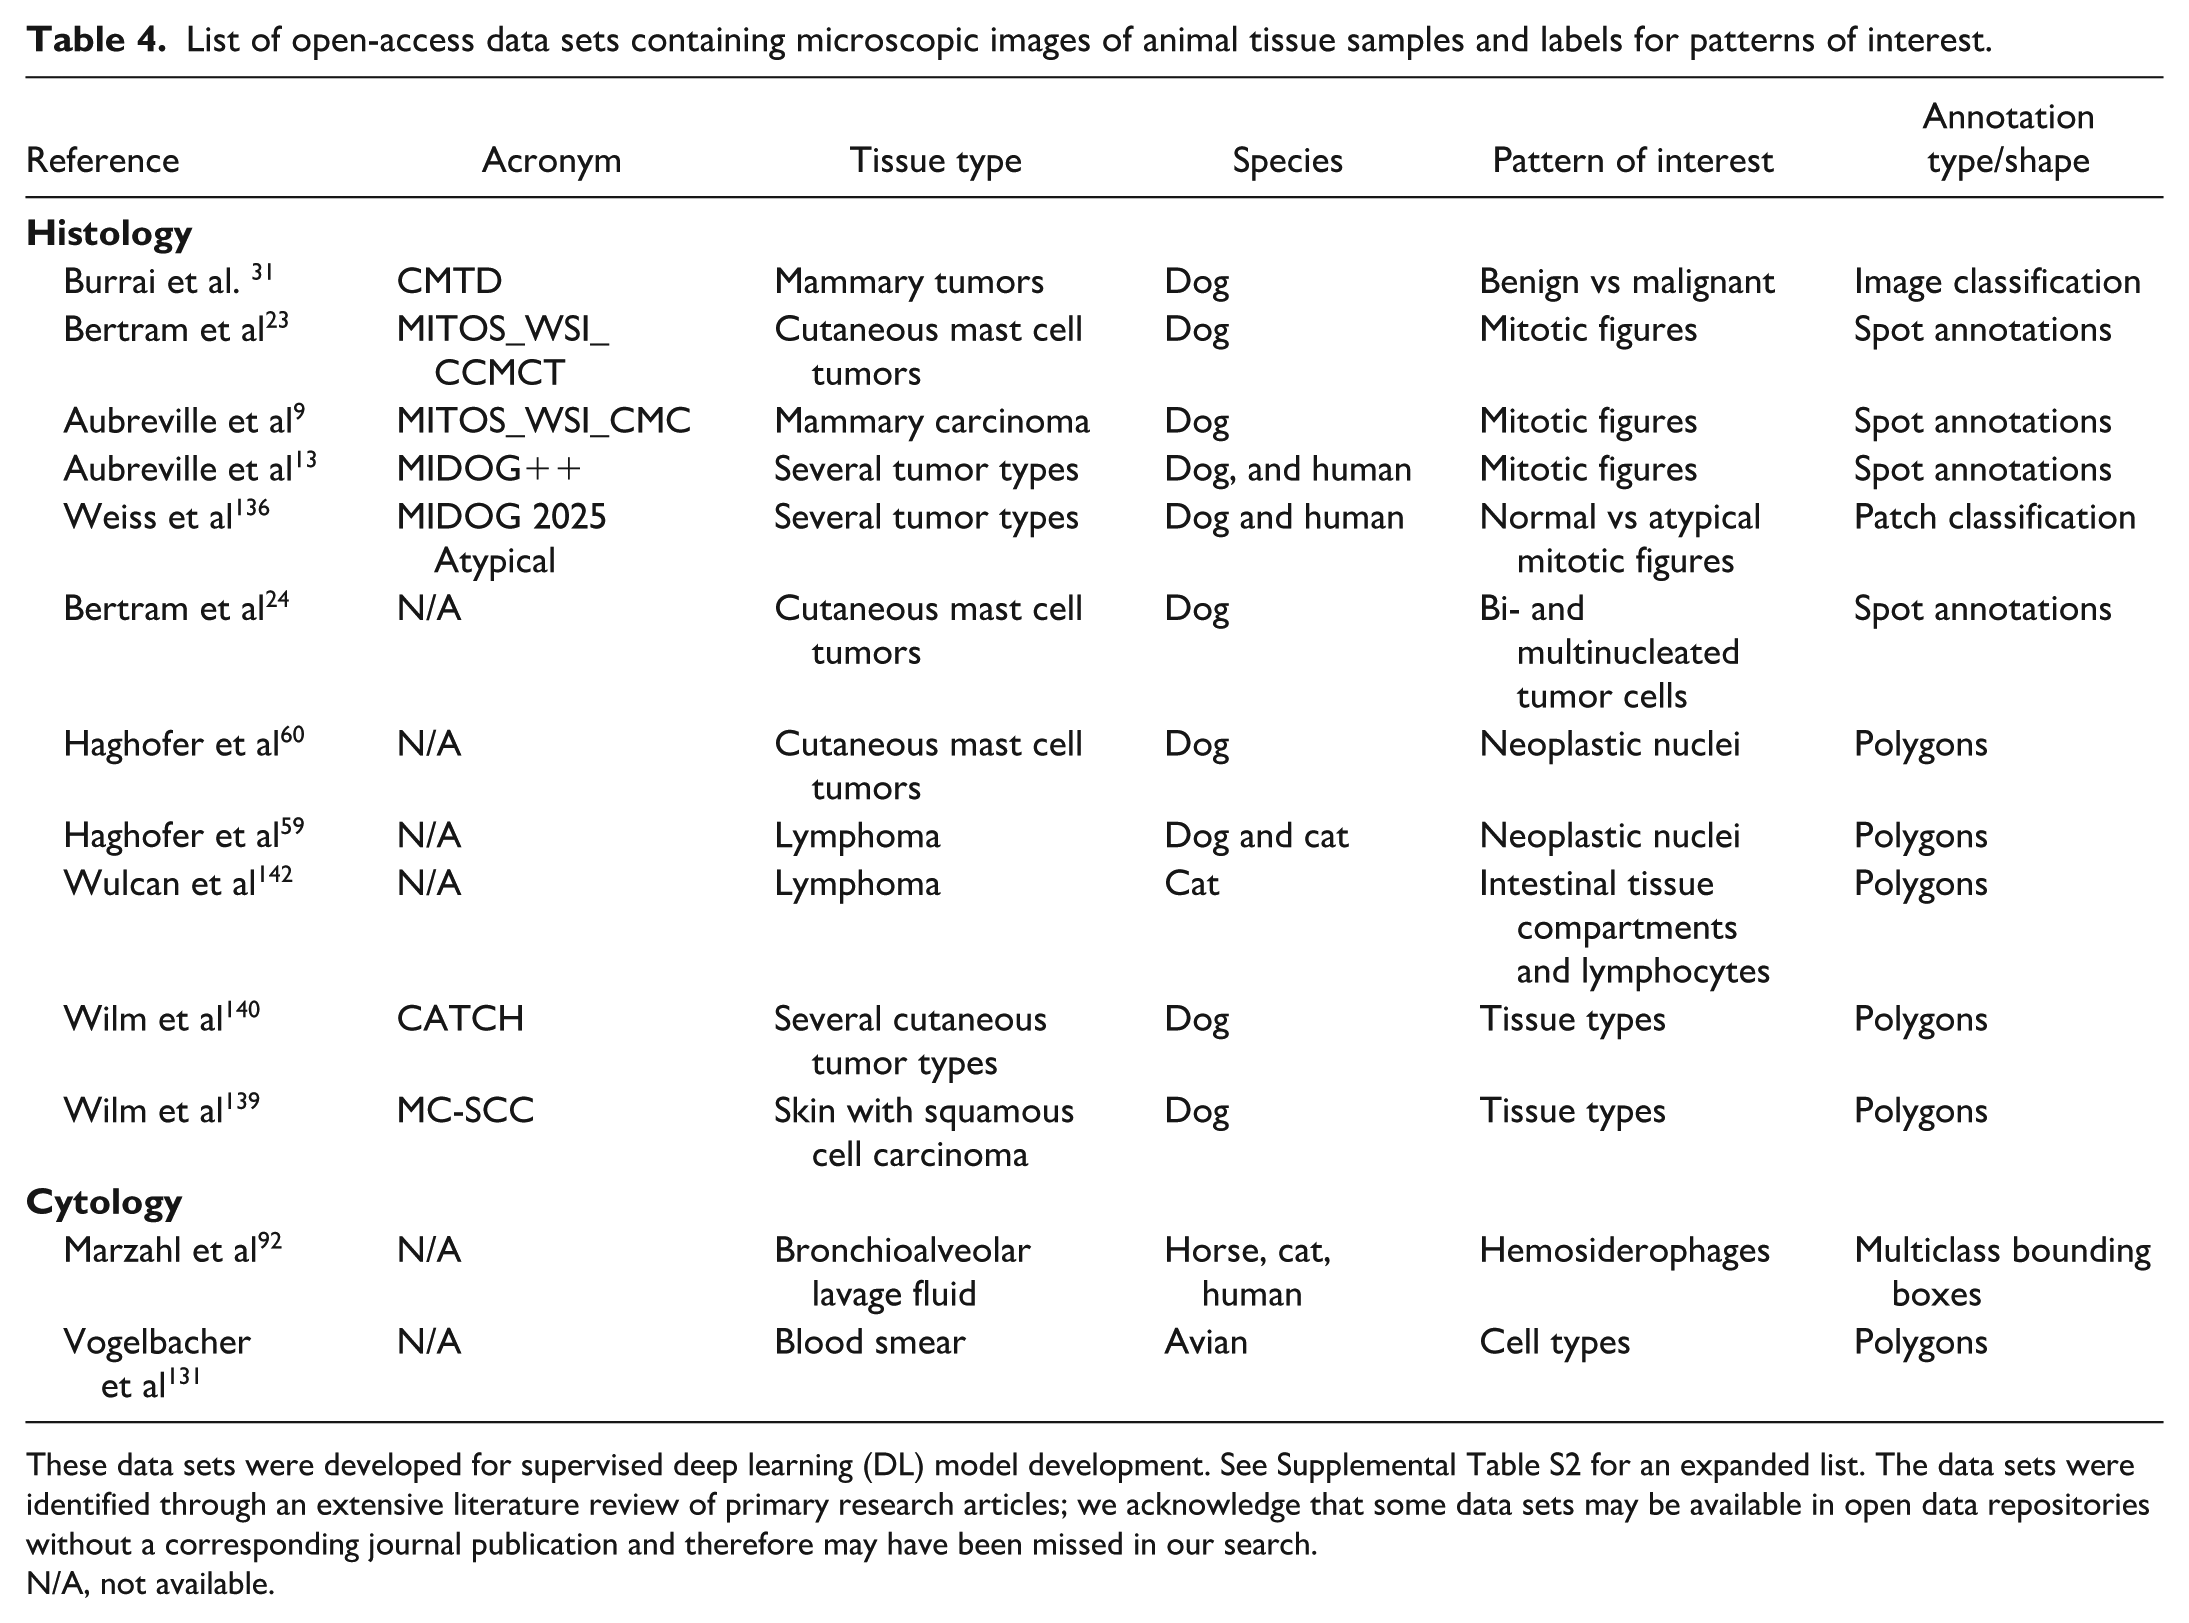
These data sets were developed for supervised deep learning (DL) model development. See Supplemental Table S2 for an expanded list. The data sets were identified through an extensive literature review of primary research articles; we acknowledge that some data sets may be available in open data repositories without a corresponding journal publication and therefore may have been missed in our search.
N/A, not available.
An additional finding from this literature review (Table 4) is that there is a particular lack of data sets related to laboratory animals and toxicologic pathology applications. This gap likely reflects the legal and data privacy constraints faced by toxicologic companies. Supporting this observation, a survey of toxicologic pathologists revealed that most respondents do not consider sharing training data sets with codevelopers for commercial or public projects. 106 Likewise, we acknowledge that diagnostic companies are often restrictive in data sharing due to concerns over future commercial and proprietary interests.7,28 Initiatives of whole-slide imaging platforms through multi-institutional and multidisciplinary consortia, such as Bigpicture, are promising to overcome these legal and proprietary challenges of image availability and sharing. 103
A variety of human data sets are also available;13,37,123 however, also the majority of DL articles in human medicine either use existing open data sets or private data sets, and a request for more publicly accessible data sets and a higher diversity of open data set (eg, on rare tumor types) has been made.37,132 Human data sets may serve as valuable supplements to animal data sets when developing models for veterinary applications. Previous research has demonstrated that models developed using human data sets (eg, algorithms for mitotic figure detection in tumors) can be successfully transferred to animal samples, and vice-versa, while maintaining a high performance or archiving high performance after some transfer learning.8,13,92,93 However, while cell and tissue morphologies are often comparable between humans and animals, there may be significant differences, such as variations in the frequency of disease subtypes. These differences require the incorporation of species-specific data, particularly in test data sets.
For image classification task, another valuable resource may be WSI repositories with metadata (eg, disease diagnosis, mutational status, etc) as potential image-level labels. In human medicine, a frequently used WSI repository is The Cancer Genome Atlas (TCGA), 39 which has been used by several studies for developing models that can predict mutational patterns in HE images.40,41 A potential limitation of WSI repositories are a higher degree of impurities (as compared with data sets specifically curated for DL-AIA) of the WSI (eg, large air bubbles, marker signs, lack of relevant tissue, poor tissue quality) and metadata, possibly requiring data cleaning.68,123 Research projects that enrich these WSI repositories by publishing object- or pixel-level annotations are valuable contributions. 15
When publishing data sets, it is essential to use data repositories that ensure long-term storage and access, such as Zenodo (https://zenodo.org/) or GitHub (https://github.com/). Clear usage notes and detailed data set descriptions (eg, included disease subtypes, digitization devices, etc) should be provided to enable other researchers to utilize the data as intended. The use of systematic nomenclature for metadata and disease diagnosis will facilitate the combination of several open (and in-house) data sets for model development. The publication of images and their associated metadata requires a well-planned strategy to address ethical, data privacy, and proprietary considerations, even more so than for internal use of images. 53 For veterinary samples, ethical approval may be waived (depending on the regulatory framework of the individual country) when routine diagnostic samples are used. However, many journals require owner consent from animal owners, and diagnostic laboratories intending to use their caseload for future research should consider strategies for obtaining such consent (eg, including a statement in the submission form). While the publication of an open data set does not necessarily require training and testing of a first DL model, it is highly recommended to do so as it provides first insight into the data set quality and provides a baseline for the intended task, which can be used in subsequent studies as orientation. When working with public data sets, researchers should ideally adopt the original training, validation, and test partitions to facilitate comparison between published studies.
Conclusion
Creation of large-scale and high-quality data sets for supervised DL in microscopic image analysis is a complex and resource-intensive process. Bias in selected images and created labels will be reflected in the model’s generalization performance and one’s ability to interpret performance metrics. This article has therefore highlighted critical considerations for data set creation regarding image selection, annotation software, annotation methods, and further considerations. For image selection, not only the sheer number matters; it is also essential to capture the image variability expected in the application cases. For example, if the development data set was digitized with one WSI scanner and the model is later applied to images from another scanner, performance may drop considerably. Active learning and synthetic data can help to increase the quantity or informativeness of training data sets and reduce the overall time investment; however, these methods should not be used to construct the test subset. The selected annotation software must provide all project-required features, including viewing support for specific file formats, online or offline application, and—if applicable—specific annotation tools such as guided screening and plug-ins for computer assistance. While annotations are often created by a single annotator, for complex patterns of interest (such as mitotic figures), there may be relevant visual and cognitive bias of annotators. Key criteria for annotation quality are the 3 “C”s: correctness, consistency, and completeness. Label bias of a single annotator may be reduced through multiexpert majority votes or computer assistance (such as by screening for missed candidates). To reduce the annotation workload, computer-assisted methods (algorithmic inference on unlabeled images and real-time algorithm-annotator interactions) or fully computerized methods (such as stain-registered transfer of computerized annotations) can be applied, with particular care to ensure high label quality for the test data set. Further considerations before concluding data set creation include data cleaning, storage and backup, documentation of data set characteristics, and deciding on data sharing policies.
Supplemental Material
sj-pdf-1-vet-10.1177_03009858261457959 – Supplemental material for Data set creation for supervised deep learning–based analysis of microscopic images: Review of important considerations and recommendations
Supplemental material, sj-pdf-1-vet-10.1177_03009858261457959 for Data set creation for supervised deep learning–based analysis of microscopic images: Review of important considerations and recommendations by Christof A. Bertram, Viktoria Weiss, Jonas Ammeling, F. Maria Schabel, Taryn A. Donovan, Frauke Wilm, Christian Marzahl, Katharina Breininger and Marc Aubreville in Veterinary Pathology
Footnotes
Acknowledgements
The authors acknowledge the use of ChatGPT (OpenAI, GPT-4, and GTP-5) for assistance with proofreading and improving the clarity of the manuscript. The authors take full responsibility for the content, accuracy, and interpretation of the work presented in this publication.
Supplemental Material for this article is available online.
Declaration of Conflicting Interests
The author(s) declared the following potential conflicts of interest with respect to the research, authorship, and/or publication of this article: Authors Taryn Donovan, Marc Aubreville, and Christof Bertram are members of the Editorial Board of Veterinary Pathology and have no further conflicts to declare. The authors did not take part in the peer review or decision-making process for this submission.
Funding
The author(s) disclosed receipt of the following financial support for the research, authorship, and/or publication of this article: CAB and VW acknowledge support from the Austrian Research Fund (FWF, project number: I 6555). JA acknowledges support by the Bavarian State Ministry for Science and the Arts (project FOKUS-TML). MA acknowledges support by the Deutsche Forschungsgemeinschaft (DFG, project number: 520330054).
References
Supplementary Material
Please find the following supplemental material available below.
For Open Access articles published under a Creative Commons License, all supplemental material carries the same license as the article it is associated with.
For non-Open Access articles published, all supplemental material carries a non-exclusive license, and permission requests for re-use of supplemental material or any part of supplemental material shall be sent directly to the copyright owner as specified in the copyright notice associated with the article.